MIRA INFORM REPORT
|
Report Date : |
02.06.2014 |
IDENTIFICATION DETAILS
|
Name : |
GLENCORE GRAIN B.V. |
|
|
|
|
Registered Office : |
Blaak 31 3011GA Rotterdam |
|
|
|
|
Country : |
Netherlands |
|
|
|
|
Financials (as on) : |
2013 |
|
|
|
|
Date of Incorporation : |
09.04.1980 |
|
|
|
|
Com. Reg. No.: |
24138640 |
|
|
|
|
Legal Form : |
Private Company |
|
|
|
|
Line of Business : |
|
|
|
|
|
No. of Employees |
219 |
RATING & COMMENTS
|
MIRA’s Rating : |
Ba |
|
RATING |
STATUS |
PROPOSED CREDIT LINE |
|
|
41-55 |
Ba |
Overall operation is considered normal. Capable to meet normal
commitments. |
Satisfactory |
|
Status : |
Satisfactory |
|
Payment Behaviour : |
No complaints |
|
Litigation : |
Clear |
NOTES :
Any query related to this report can be made
on e-mail : infodept@mirainform.com
while quoting report number, name and date.
ECGC Country Risk Classification List – March 31, 2014
|
Country Name |
Previous Rating (31.12.2013) |
Current Rating (31.03.2014) |
|
Netherlands |
A1 |
A1 |
|
Risk Category |
ECGC
Classification |
|
Insignificant |
A1 |
|
Low Risk |
A2 |
|
Moderate Low Risk |
B1 |
|
Moderate Risk |
B2 |
|
Moderate High Risk |
C1 |
|
High Risk |
C2 |
|
Very High Risk |
D |
netherlands ECONOMIC OVERVIEW
The Dutch economy is the
sixth-largest economy in the euro-zone and is noted for its stable industrial
relations, moderate unemployment and inflation, a sizable trade surplus, and an
important role as a European transportation hub. Industrial activity is predominantly
in food processing, chemicals, petroleum refining, and electrical machinery. A
highly mechanized agricultural sector employs only 2% of the labor force but
provides large surpluses for the food-processing industry and for exports. The
Netherlands, along with 11 of its EU partners, began circulating the euro
currency on 1 January 2002. After 26 years of uninterrupted economic growth,
the Dutch economy - highly dependent on an international financial sector and
international trade - contracted by 3.5% in 2009 as a result of the global
financial crisis. The Dutch financial sector suffered, due in part to the high
exposure of some Dutch banks to U.S. mortgage-backed securities. In 2008, the
government nationalized two banks and injected billions of dollars of capital
into other financial institutions, to prevent further deterioration of a
crucial sector. The government also sought to boost the domestic economy by
accelerating infrastructure programs, offering corporate tax breaks for
employers to retain workers, and expanding export credit facilities. The
stimulus programs and bank bailouts, however, resulted in a government budget
deficit of 5.3% of GDP in 2010 that contrasted sharply with a surplus of 0.7%
in 2008. The government of Prime Minister Mark RUTTE began implementing fiscal
consolidation measures in early 2011, mainly reductions in expenditures, which
resulted in an improved budget deficit in 2011. In 2012-13 tax revenues
dropped, GDP contracted, and the budget deficit deteriorated. Although jobless
claims continued to grow, the unemployment rate remained relatively low at 6.8
percent.
|
Source
: CIA |
Company
name and address
Company name GLENCORE
GRAIN B.V.
Operative address Blaak 31
3011GA Rotterdam
Netherlands
Legal form Private Company
Registration number KvK-nummer: 24138640
VAT-number 005199542
|
Year |
2013 |
Mutation |
2012 |
Mutation |
2011 |
|
Fixed assets |
115.747.000 |
-26,53 |
157.547.376 |
2.918,22 |
5.219.878 |
|
Total receivables |
2.108.596.000 |
-15,65 |
2.499.840.926 |
33,63 |
1.870.743.470 |
|
Total equity |
174.692.000 |
2,04 |
171.207.373 |
7,11 |
159.845.427 |
|
Short term liabilities |
1.919.251.000 |
-29,47 |
2.721.252.181 |
32,84 |
2.048.534.642 |
|
Net result |
3.030.000 |
-76,24 |
12.754.283 |
25,83 |
10.136.023 |
|
Working capital |
371.705.000 |
1.151,47 |
29.701.381 |
-80,79 |
154.625.549 |
|
Quick ratio |
1,11 |
18,09 |
0,94 |
1,08 |
0,93 |

Contact
information
Company name GLENCORE GRAIN B.V.
Trade names GLENCORE GRAIN B.V.
Operative address Blaak 31
3011GA Rotterdam
Netherlands
Correspondence address Postbus 1120
3000BC Rotterdam
Netherlands
Telephone number 0104044400
Fax number 0104129635
Email address hr.rotterdam@glencore.com
Website www.glencore.com
Registration
Registration number KvK-nummer: 24138640
Branch number 000017838428
VAT-number 005199542
Status Active
Memorandum 1980-04-09
Establishment date 1980-04-09
Legal form Private Company
Last proposed admendment 2006-02-24
Activities
SBI Wholesaler of grain (46211)
Wholesaler of ferrous metals and ferrous semi-finished products (46722)
Exporter Yes
Importer Yes
Branche organisations KVNR - Koninklijke Vereniging van Nederlandse Reders
Goal Trading, including futures commission trade, agencies, and im-export and
distribution, both for its own account and on behalf of third parties, in all goods, in particular in products, raw materials, energy and intermediate goods
Relations
Shareholders Finges
Investment B.V.
Blaak 31
3011GA ROTTERDAM
Netherlands
Registration number: 341194320000
Percentage: 100.00%
Companies on same address Amount: 171
Management
Active management
C.J. Mahoney (Christopher John)
Netherlands
Competence: Jointly authorized
Function: Manager
Starting date: 2005-08-31
Date of birth: 1959-01-02, Edmonton, GB
A.P. Hubmann (Andreas Peter)
Netherlands
Competence: Jointly authorized
Function: Manager
Starting date: 2005-08-31
Date of birth: 1966-10-11, Bichelsee-Balterswil, CH
E.C.B. Mostert (Ernest Christian Barend)
Netherlands
Competence: Jointly authorized
Function: Manager
Starting date: 2006-05-01
Date of birth: 1964-08-18, Pretoria, ZA
Involved with the following companies
• BIOPETROL MARKETING B.V.
Blaak 31
3011GA Rotterdam
Netherlands
Registration number: 244903130000
Function: Manager
• Glencore Grain Rotterdam B.V.
Blaak 31
3011GA Rotterdam
Netherlands
Registration number: 241417980000
Function: Manager
A.F.S. van Hoorn (Adrianus Frederik Sébastian)
Netherlands
Competence: Limited authorization
Function: Proxy
Starting date: 2013-07-17
Date of birth: 1976-12-24, Oud-Beijerland, NL
M.J. Pattenier (Michaëla Johanna)
Netherlands
Competence: Limited authorization
Function: Proxy
Starting date: 2005-09-12
Date of birth: 1964-05-08, Schiedam, NL
Involved with the following companies
• BIOPETROL MARKETING B.V.
Blaak 31
3011GA Rotterdam
Netherlands
Registration number: 244903130000
Function: Proxy
R.J.J. de Gelder (Ronald Jozef Johanna)
Netherlands
Competence: Limited authorization
Function: Proxy
Starting date: 2006-01-01
Date of birth: 1967-11-05, Sittard, NL
R. Jansen (Robert)
Netherlands
Competence: Limited authorization
Function: Proxy
Starting date: 2006-01-01
Date of birth: 1960-12-31, Rotterdam, NL
F. Ketting (Ferry)
Netherlands
Competence: Limited authorization
Function: Proxy
Starting date: 2006-01-01
Date of birth: 1966-08-18, Rotterdam, NL
R.J.D. Klein (Richard Jozef Daniel)
Netherlands
Competence: Limited authorization
Function: Proxy
Starting date: 2006-01-01
Date of birth: 1968-03-24, 's-Gravenhage, NL
S.M. Kosorog (Sylvie Marie-claire)
Netherlands
Competence: Limited authorization
Function: Proxy
Starting date: 2006-01-01
Date of birth: 1964-04-02, Tonnerre, FR
A. Kouwenhoven (Arie)
Netherlands
Competence: Limited authorization
Function: Proxy
Starting date: 2006-01-01
Date of birth: 1959-07-21, Bergambacht, NL
Involved with the following companies
• BIOPETROL MARKETING B.V.
Blaak 31
3011GA Rotterdam
Netherlands
Registration number: 244903130000
Function: Proxy
B. Kouwenhoven (Benny)
Netherlands
Competence: Limited authorization
Function: Proxy
Starting date: 2006-01-01
Date of birth: 1965-11-16, Sneek, NL
M.S. Kubbe (Maarten Sebastiaan)
Netherlands
Competence: Limited authorization
Function: Proxy
Starting date: 2006-01-01
Date of birth: 1972-09-20, Voorburg, NL
N.L.M. van den Meiracker (Nicolaas Leonardus Marie)
Netherlands
Competence: Limited authorization
Function: Proxy
Starting date: 2006-01-01
Date of birth: 1957-02-06, Rotterdam, NL
P.M. Mouthaan (Peter Mario)
Netherlands
Competence: Limited authorization
Function: Proxy
Starting date: 2006-01-01
Date of birth: 1970-08-14, Bergen op Zoom, NL
A.A. Rabeling (Antonius Alfonsius)
Netherlands
Function: Proxy
Starting date: 2006-01-01
Date of birth: 1962-07-30, Vlaardingen, NL
T.E. Schipper (Theo Eymert)
Netherlands
Competence: Limited authorization
Function: Proxy
Starting date: 2006-01-01
Date of birth: 1963-02-17, Delft, NL
A.B.J. Schrage (Antonius Bernardus Johannes)
Netherlands
Competence: Limited authorization
Function: Proxy
Starting date: 2006-01-01
Date of birth: 1959-03-15, Rotterdam, NL
J. Wakker (Jeffrey)
Netherlands
Competence: Limited authorization
Function: Proxy
Starting date: 2006-01-01
Date of birth: 1971-09-11, 's-Gravenhage, NL
A. de Veer (Abraham)
Netherlands
Competence: Limited authorization
Function: Proxy
Starting date: 2010-07-19
Date of birth: 1967-06-15, Breda, NL
M. den Otter (Margaretha)
Netherlands
Competence: Limited authorization
Function: Proxy
Starting date: 2011-01-25
Date of birth: 1963-05-31, Barendrecht, NL
Involved with the
following companies
• BIOPETROL MARKETING B.V.
Blaak 31
3011GA Rotterdam
Netherlands
Registration number: 244903130000
Function: Proxy
C. Both (Camiel)
Netherlands
Competence: Limited authorization
Function: Proxy
Starting date: 2011-09-01
Date of birth: 1978-08-23, Poortugaal, NL
D.A. Pickett (Daniel Anthony)
Netherlands
Competence: Limited authorization
Function: Proxy
Starting date: 2011-11-15
Date of birth: 1984-09-19, Goole, GB
J. Gielisse (Jerry)
Netherlands
Competence: Limited authorization
Function: Proxy
Starting date: 2012-06-11
Date of birth: 1979-06-08, Leidschendam, NL
C.R. Iles (Colin Richard)
Netherlands
Competence: Limited authorization
Function: Proxy
Starting date: 2012-06-19
Date of birth: 1973-08-24, Rinteln, DE
E.J. Aubailly (Etienne Jean-François)
Netherlands
Competence: Limited authorization
Function: Proxy
Starting date: 2014-01-23
Date of birth: 1970-08-14, Bourges, FR
Involved with the following companies
• BIOPETROL MARKETING B.V.
Blaak 31
3011GA Rotterdam
Netherlands
Registration number: 244903130000
Function: Proxy
O.A.M. Calvar (Olivier Andre Marie)
Netherlands
Competence: Limited authorization
Function: Proxy
Starting date: 2013-07-22
Date of birth: 1971-05-09, Vannes, FR
J.D. Maw (James Daniel)
Netherlands
Competence: Limited authorization
Function: Proxy
Starting date: 2013-07-22
Date of birth: 1963-07-06, Scarborough, GB
D.W. Johnson (Danial Wesley)
Netherlands
Competence: Limited authorization
Function: Proxy
Starting date: 2013-10-15
Date of birth: 1980-05-09, Tamworth, AU
P.J. Tustin (Peter John)
Netherlands
Competence: Limited authorization
Function: Proxy
Starting date: 2013-10-23
Date of birth: 1974-02-05, Geelong, AU
J. Hansen (Jimmy)
Netherlands
Competence: Limited authorization
Function: Proxy
Starting date: 2013-10-23
Date of birth: 1979-09-09, Heusden, NL
C.G.W. Popowich (Chad George William)
Netherlands
Competence: Limited authorization
Function: Proxy
Starting date: 2013-11-04
Date of birth: 1978-11-23, Regina, CA
C. Toral Oropesa (Cristobal)
Netherlands
Competence: Limited authorization
Function: Proxy
Starting date: 2013-11-05
Date of birth: 1973-01-22, Madrid, ES
J. Barth (Johannes)
Netherlands
Competence: Limited authorization
Function: Proxy
Starting date: 2014-02-14
Date of birth: 1980-11-02, Middelburg, NL
L.J. Dorrestein (Lucas James)
Netherlands
Competence: Limited authorization
Function: Proxy
Starting date: 2014-02-24
Date of birth: 1985-07-03, Brighton, GB
F.A. Mardon (Francis Albert)
Netherlands
Competence: Limited authorization
Function: Proxy
Starting date: 2014-05-05
Date of birth: 1972-10-16, Loches, FR
Employees
Employees
Year 2012
2011 2010
2009 2008
Total 219 183 1 142 1

Payments
Description Payments made under regular condition
Key
figures
|
Year |
2013 |
2012 |
2011 |
2010 |
2009 |
||
|
Quick ratio |
1,11 |
0,94 |
0,93 |
0,95 |
1,17 |
||
|
Current ratio |
1,19 |
1,01 |
1,08 |
1,06 |
1,36 |
||
|
Working capital/ balance total |
0,15 |
0,01 |
0,07 |
0,06 |
0,27 |
||
|
Equity / balance total |
0,07 |
0,06 |
0,07 |
0,06 |
0,27 |
||
|
Equity / Fixed assets |
1,51 |
1,09 |
30,62 |
47,09 |
271,69 |
||
|
Equity / liabilities |
0,08 |
0,06 |
0,08 |
0,06 |
0,37 |
||
|
Balance total / liabilities |
1,08 |
1,06 |
1,08 |
1,06 |
1,37 |
||
|
Working capital |
371.705.000 |
29.701.381 |
154.625.549 |
141.041.379 |
244.837.501 |
||
|
Equity |
174.692.000 |
171.207.373 |
159.845.427 |
144.101.447 |
245.741.985 |
||
|
Mutation equity |
2,04 |
7,11 |
10,93 |
-41,36 |
-36,57 |
||
|
Mutation short term liabilities |
-29,47 |
32,84 |
-15,30 |
260,19 |
-29,33 |
||
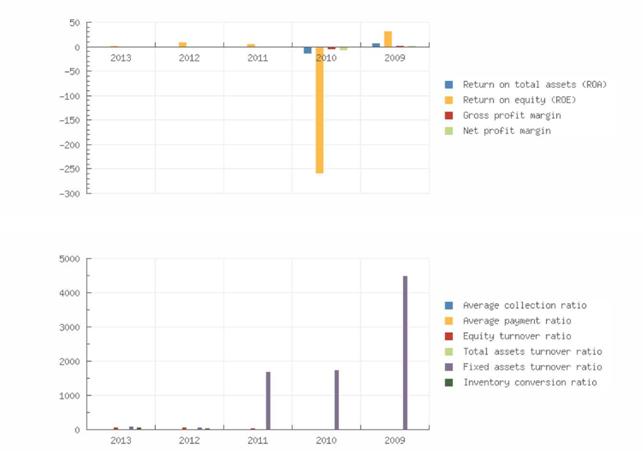
|
Return on total assets (ROA) |
0,23 |
0,59 |
0,51 |
-14,59 |
8,48 |
||
|
Return on equity (ROE) |
3,15 |
10,08 |
7,09 |
-259,41 |
31,64 |
||
|
Gross profit margin |
0,22 |
0,44 |
0,73 |
-6,39 |
2,43 |
||
|
Net profit margin |
0,02 |
0,11 |
0,11 |
-7,38 |
2,10 |
||
|
Average collection ratio |
6,57 |
4,22 |
4,33 |
2,22 |
6,06 |
||
|
Average payment ratio |
5,98 |
4,59 |
4,74 |
2,37 |
5,17 |
||
|
Equity turnover ratio |
72,20 |
67,02 |
55,50 |
37,29 |
16,55 |
||
|
Total assets turnover ratio |
5,24 |
3,95 |
4,02 |
2,10 |
4,43 |
||
|
Fixed assets turnover ratio |
108,97 |
72,83 |
1.699,48 |
1.756,21 |
4.495,19 |
||
|
Inventory conversion ratio |
83,12 |
57,12 |
29,10 |
19,85 |
31,17 |
||
|
Turnover |
12.613.363.000 |
11.474.447.128 |
8.871.088.094 |
5.374.112.762 |
4.065.827.012 |
||
|
Gross margin |
92.797.000 |
92.082.010 |
112.146.223 |
90.942.585 |
125.503.228 |
||
|
Operating result |
28.305.000 |
50.704.868 |
64.630.960 |
-343.171.167 |
98.606.803 |
||
|
Net result after taxes |
3.031.000 |
12.754.283 |
10.136.023 |
-396.466.165 |
85.204.752 |
||
|
EBIT |
|
50.704.868 |
64.630.960 |
-343.171.167 |
98.606.803 |
||
Summary
The 2013 financial result structure is a positive working capital of 371.705.000 euro, which is
in agreement with 15 % of the total assets of the company.
The working capital has increased with 1151.47 % compared to previous year. The ratio, with
respect to the total assets of the company has however, increased.
The improvement between 2012 and 2013 has mainly been caused by an increase of the
current assets.
The current ratio of the company in 2013 was 1.19. When the current ratio is below 1.5, the
company may have problems meeting its short-term obligations.
The quick ratio in 2013 of the company was 1.11. A company with a Quick Ratio of more than
1 can currently pay back its current liabilities.
The 2012 financial result structure is a positive working capital of 29.701.381 euro, which is in
agreement with 1 % of the total assets of the company.
The working capital has diminished with -80.79 % compared to previous year. The ratio, with
respect to the total assets of the company has however, declined.
The deterioration between 2011 and 2012 has mainly been caused by an increase of the
current liabilities.
The current ratio of the company in 2012 was 1.01. When the current ratio is below 1.5, the
company may have problems meeting its short-term obligations.
The quick ratio in 2012 of the company was 0.94. A company with a Quick Ratio of less than
1 cannot currently pay back its current liabilities


Financial
statement
Type of annual account Corporate
Annual account Glencore
Grain B.V.
Blaak 31
3011GA Rotterdam
Netherlands
Registration number: 241386400000
Balance
sheet
|
Year |
2013 |
2012 |
2011 |
2010 |
2009 |
|
End date |
2013-12-31 |
2012-12-31 |
2011-12-31 |
2010-12-31 |
2009-12-31 |
|
Other tangible fixed assets |
5.077.000 |
|
|
|
|
|
Tangible fixed assets |
5.077.000 |
|
3.614.653 |
2.362.932 |
|
|
Associated and affliated companies |
87.000 |
|
|
|
|
|
Financial fixed assets |
87.000 |
157.547.376 |
1.605.224 |
697.136 |
904.484 |
|
Other fixed assets |
110.583.000 |
|
|
|
|
|
Fixed assets |
115.747.000 |
157.547.376 |
5.219.878 |
3.060.068 |
904.484 |
|
Total stock |
151.745.000 |
200.892.079 |
304.822.626 |
270.761.778 |
130.458.107 |
|
Accounts receivable |
|
719.017.761 |
569.765.819 |
578.325.154 |
225.346.322 |
|
Other receivables |
|
1.780.823.165 |
1.300.977.651 |
1.685.208.033 |
560.362.889 |
|
Total receivables |
2.108.596.000 |
2.499.840.926 |
1.870.743.470 |
2.263.533.187 |
785.709.211 |
|
Liquid funds |
30.615.000 |
50.220.557 |
27.594.095 |
25.331.019 |
152.020 |
|
Current assets |
2.290.956.000 |
2.750.953.562 |
2.203.160.191 |
2.559.625.984 |
916.319.338 |
|
Total assets |
2.406.703.000 |
2.908.500.938 |
2.208.380.069 |
2.562.686.051 |
917.223.822 |
|
Issued capital |
17.640.000 |
16.502.956 |
16.579.334 |
16.577.175 |
16.441.062 |
|
Other reserves |
157.052.000 |
154.704.417 |
143.266.093 |
127.524.271 |
229.300.923 |
|
Total reserves |
157.052.000 |
154.704.417 |
143.266.093 |
127.524.271 |
229.300.923 |
|
Total equity |
174.692.000 |
171.207.373 |
159.845.427 |
144.101.447 |
245.741.985 |
|
Provisions |
2.682.000 |
16.041.383 |
|
|
|
|
Long term liabilities |
310.078.000 |
|
|||
|
Accounts payable |
1.647.081.000 |
145.954.985 |
113.846.509 |
95.816.552 |
72.749.529 |
|
Short term interest yielding debt |
251.938.000 |
|
|
|
|
|
Other short term liabilities |
20.232.000 |
2.575.297.197 |
1.934.688.133 |
2.322.768.053 |
598.732.308 |
|
Short term liabilities |
1.919.251.000 |
2.721.252.181 |
2.048.534.642 |
2.418.584.605 |
671.481.837 |
|
Total short and long term liabilities |
2.232.011.000 |
2.737.293.564 |
2.048.534.642 |
2.418.584.605 |
671.481.837 |
Summary
The total assets of the company decreased with -17.25 % between 2012 and 2013.
This downturn is mainly retrievable in the fixed asset decrease of -26.53 %.
The asset reduction is in contrast with the equity growth of 2.04 %. Due to this the total debt
decreased with -18.46 %.
In 2013 the assets of the company were 4.81 % composed of fixed assets and 95.19 % by
current assets. The assets are being financed by an equity of 7.26 %, and total debt of 92.74
%.
The total assets of the company increased with 31.7 % between 2011 and 2012.
The total asset increase is retrievable in the fixed asset growth of 2918.22 %.
The asset growth has mainly been financed by a debt increase of 33.62 %. The Net Worth,
however, grew with 7.11 %.
In 2012 the assets of the company were 5.42 % composed of fixed assets and 94.58 % by
current assets. The assets are being financed by an equity of 5.89 %, and total debt of 94.11
%.

Profit
and loss
|
Year |
2013 |
2012 |
2011 |
2010 |
2009 |
|
Revenues |
|
11.474.447.128 |
8.871.088.094 |
5.374.112.762 |
4.065.827.012 |
|
Net turnover |
12.613.363.000 |
11.474.447.128 |
8.871.088.094 |
5.374.112.762 |
4.065.827.012 |
|
Cost of sales |
12.520.566.000 |
|
|
|
|
|
Gross margin |
92.797.000 |
92.082.010 |
112.146.223 |
90.942.585 |
125.503.228 |
|
Wages and salaries |
|
21.678.794 |
22.276.837 |
16.903.303 |
|
|
Sales |
|
11.382.365.118 |
8.758.941.871 |
5.283.170.177 |
26.896.425 |
|
other operating costs |
|
19.698.348 |
25.238.426 |
417.210.448 |
|
|
Operating expenses |
64.491.000 |
11.423.742.260 |
8.806.457.134 |
5.717.283.929 |
3.967.220.208 |
|
Operating result |
28.306.000 |
50.704.868 |
64.630.960 |
-343.171.167 |
98.606.803 |
|
Financial income |
9.498.000 |
13.468.244 |
17.357.601 |
11.360.624 |
12.622.515 |
|
Financial expenses |
32.302.000 |
46.912.235 |
70.650.745 |
42.000.946 |
33.478.403 |
|
Financial result |
-22.804.000 |
-33.443.991 |
-53.293.144 |
-30.640.323 |
-20.855.888 |
|
Result on ordinary operations before taxes |
5.502.000 |
17.260.877 |
11.337.816 |
-373.811.490 |
77.750.916 |
|
Taxation on the result of ordinary activities |
1.812.000 |
4.506.594 |
1.201.793 |
11.235.708 |
-10.571.287 |
|
Result of ordinary activities after taxes |
3.690.000 |
12.754.283 |
10.136.023 |
-385.047.197 |
88.322.203 |
|
Extraordinary result after taxation |
-660.000 |
|
|
|
|
|
Result subsidiaries after taxes |
|
|
|
-11.418.968 |
-3.117.450 |
|
Net result |
3.030.000 |
12.754.283 |
10.136.023 |
-396.466.165 |
85.204.752 |
|
Attributable to shareholders |
3.030.000 |
|
|
|
|
Summary
The turnover of the company grew with 9.93 % between 2012 and 2013.
The gross profit of the company has remained the same between 2012 and 2013.
The operating result of the company declined with -44.18 % between 2012 and 2013. This
evolution implies an decrease of the company's economic profitability.
The result of these changes is a reduction of the company's Economic Profitability of -61.02
% of the analysed period, being equal to 2012 % in the year 2013.
Despite the decline the assets turnover increased by 32.66 % reaching 5.24.
The Net Result of the company increased by -76.24 % between 2012 and 2013.
The company's Financial Profitability has been positively affected by the financial activities in
comparison to the EBITs behaviour. The result of these variations is a profitability increase of
-68.75 % of the analysed period, being 3.15 % in the year 2013.
The company's financial profitability has been positively affected by its financial structure.
The turnover of the company grew with 29.35 % between 2011 and 2012.
The gross profit of the company decreased by -17.89 % between 2011 and 2012.
The operating result of the company declined with -21.55 % between 2011 and 2012. This
evolution implies an decrease of the company's economic profitability.
The result of these changes is an increase of the company's Economic Profitability of 15.69
% of the analysed period, being equal to 2011 % in the year 2012.
Despite the growth the assets turnover decreased, whose index evolved with -1.74 % to a
level of 3.95.
The Net Result of the company decreased by 25.83 % between 2011 and 2012.
The company's Financial Profitability has been negatively affected by the financial activities in
comparison to the EBITs behaviour. The result of these variations is a profitability reduction
of 42.17 % of the analysed period, being 10.08 % in the year 2012.
The company's financial structure has slowed down its financial profitability.
Analysis
Branch (SBI)
Wholesale trade (no motor vehicles and motorcycles) (46)
Region
Groot Rotterdam
In the Netherlands 109662 of the companies are registered with the SBI code 46
In the region Groot Rotterdam 8969 of the companies are registered with the SBI code 46
In the Netherlands 2387 of the bankrupcties are published within this sector
In the region Groot Rotterdam 231 of the bankruptcies are published within this sector
The risk of this specific sector in the Netherlands is normal
The risk of this specific sector in the region Groot Rotterdam is normal
Publications
Filings 20-05-2014: De jaarrekening over 2013 is gepubliceerd.
13-02-2014: De jaarrekening over 2012 is gepubliceerd.
10-02-2012: De jaarrekening over 2010 is gepubliceerd.
17-03-2011: De jaarrekening over 2009 is gepubliceerd.
03-03-2010: De jaarrekening over 2008 is gepubliceerd.
Functions
14-05-2014: Per 30-04-2014 is gevolmachtigde Wilhelmus Marinus van Deurzen uit functie
getreden.
14-05-2014: Per 05-05-2014 is gevolmachtigde Francis Albert Mardon in functie getreden.
26-02-2014: Per 24-02-2014 is gevolmachtigde Lucas James Dorrestein in functie getreden.
21-02-2014: Per 14-02-2014 is gevolmachtigde Johannes Barth in functie getreden.
21-02-2014: Per 14-02-2014 is gevolmachtigde Thomas Theodorus Maria Heijselaar uit
functie getreden.
27-01-2014: Per 23-01-2014 is gevolmachtigde Etienne Jean-François Aubailly in functie
getreden.
13-11-2013: Per 05-11-2013 is gevolmachtigde Cristobal Toral Oropesa in functie getreden.
13-11-2013: Per 04-11-2013 is gevolmachtigde Chad George William Popowich in functie
getreden.
31-10-2013: Per 23-10-2013 is gevolmachtigde Peter John Tustin in functie getreden.
31-10-2013: Per 23-10-2013 is gevolmachtigde Jimmy Hansen in functie getreden.
17-10-2013: Per 15-10-2013 is gevolmachtigde Danial Wesley Johnson in functie getreden.
15-10-2013: Per 14-10-2013 is gevolmachtigde Peter Johannes Poort uit functie getreden.
05-09-2013: Per 01-09-2013 is gevolmachtigde Manuel David Schöngüt uit functie getreden.
14-08-2013: Per 22-07-2013 is gevolmachtigde James Daniel Maw in functie getreden.
14-08-2013: Per 17-07-2013 is gevolmachtigde Adrianus Frederik Sébastian van Hoorn in
functie getreden.
30-07-2013: Per 22-07-2013 is gevolmachtigde Olivier Andre Marie Calvar in functie
getreden.
22-06-2012: Per 19-06-2012 is gevolmachtigde Colin Richard Iles in functie getreden.
15-06-2012: Per 11-06-2012 is gevolmachtigde Jerry Gielisse in functie getreden.
15-02-2012: Per 30-01-2012 is gevolmachtigde Ronald Burki uit functie getreden.
16-11-2011: Per 15-11-2011 is gevolmachtigde Daniel Anthony Pickett in functie getreden.
27-09-2011: Per 20-09-2011 is gevolmachtigde Mark Simon Allen uit functie getreden.
08-09-2011: Per 01-09-2011 is gevolmachtigde Marc Webbers uit functie getreden.
06-09-2011: Per 01-09-2011 is gevolmachtigde Camiel Both in functie getreden.
24-03-2011: Per 24-03-2011 is gevolmachtigde Marc Webbers in functie getreden.
25-01-2011: Per 25-01-2011 is gevolmachtigde Margaretha den Otter in functie getreden.
21-07-2010: Per 19-07-2010 is gevolmachtigde Abraham de Veer in functie getreden.
FOREIGN EXCHANGE RATES
|
Currency |
Unit
|
Indian Rupees |
|
US Dollar |
1 |
Rs.59.03 |
|
|
1 |
Rs.98.91 |
|
Euro |
1 |
Rs.80.34 |
INFORMATION DETAILS
|
Analysis Done by
: |
RAS |
|
|
|
|
Report Prepared
by : |
MNL |
RATING EXPLANATIONS
|
RATING |
STATUS |
PROPOSED CREDIT LINE |
|
|
|
>86 |
Aaa |
Possesses an extremely sound financial base with the strongest capability
for timely payment of interest and principal sums |
Unlimited |
|
|
71-85 |
Aa |
Possesses adequate working capital. No caution needed for credit
transaction. It has above average (strong) capability for payment of interest
and principal sums |
Large |
|
|
56-70 |
A |
Financial & operational base are regarded healthy. General
unfavourable factors will not cause fatal effect. Satisfactory capability for
payment of interest and principal sums |
Fairly Large |
|
|
41-55 |
Ba |
Overall operation
is considered normal. Capable to meet normal commitments. |
Satisfactory |
|
|
26-40 |
B |
Capability to overcome financial difficulties seems comparatively
below average. |
Small |
|
|
11-25 |
Ca |
Adverse factors are apparent. Repayment of interest and principal sums
in default or expected to be in default upon maturity |
Limited with
full security |
|
|
<10 |
C |
Absolute credit risk exists. Caution needed to be exercised |
Credit not
recommended |
|
|
-- |
NB |
New Business |
-- |
|
This score serves as a reference to assess
SC’s credit risk and to set the amount of credit to be extended. It is
calculated from a composite of weighted scores obtained from each of the major sections
of this report. The assessed factors and their relative weights (as indicated
through %) are as follows:
Financial
condition (40%) Ownership
background (20%) Payment
record (10%)
Credit history
(10%) Market trend (10%) Operational size
(10%)
This report is issued at your request without any
risk and responsibility on the part of MIRA INFORM PRIVATE LIMITED (MIPL)
or its officials.