MIRA INFORM REPORT
|
Report Date : |
06.06.2014 |
IDENTIFICATION DETAILS
|
Name : |
HWATAI INDUSTRY
COMPANY LIMITED |
|
|
|
|
Registered Office : |
582 Moo 14,
Bangpoo Industrial Estate,
Sukhumvit Rd., Praeksa,
Muang, Samutprakarn 10280 |
|
|
|
|
Country : |
Thailand |
|
|
|
|
Financials (as on) : |
31.12.2013 |
|
|
|
|
Date of Incorporation : |
06.11.1991 |
|
|
|
|
Com. Reg. No.: |
0105534105606 |
|
|
|
|
Legal Form : |
Private Limited Company |
|
|
|
|
Line of Business : |
engaged in manufacturing and distributing wide range of dyestuffs such as Acid, Disperse, Reactive & Direct Dyes |
|
|
|
|
No of Employees : |
50
(Approximately) |
RATING & COMMENTS
|
MIRA’s Rating : |
Ba |
|
RATING |
STATUS |
PROPOSED CREDIT LINE |
|
|
41-55 |
Ba |
Overall operation is considered normal. Capable to meet normal
commitments. |
Satisfactory |
|
Status : |
Satisfactory |
|
|
|
|
Payment Behaviour : |
No Complaints |
|
|
|
|
Litigation : |
Clear |
NOTES :
Any query related to this report can be made
on e-mail : infodept@mirainform.com
while quoting report number, name and date.
ECGC Country Risk Classification List – March 31, 2014
|
Country Name |
Previous Rating (31.12.2013) |
Current Rating (31.03.2014) |
|
Thailand |
B1 |
B1 |
|
Risk Category |
ECGC
Classification |
|
Insignificant |
A1 |
|
Low Risk |
A2 |
|
Moderate Low Risk |
B1 |
|
Moderate Risk |
B2 |
|
Moderate High Risk |
C1 |
|
High Risk |
C2 |
|
Very High Risk |
D |
Thailand ECONOMIC OVERVIEW
With a well-developed
infrastructure, a free-enterprise economy, generally pro-investment policies, and
strong export industries, Thailand achieved steady growth due largely to
industrial and agriculture exports - mostly electronics, agricultural
commodities, automobiles and parts, and processed foods. Unemployment, at less
than 1% of the labor force, stands as one of the lowest levels in the world,
which puts upward pressure on wages in some industries. Thailand also attracts
nearly 2.5 million migrant workers from neighboring countries. The Thai
government is implementing a nation-wide 300 baht ($10) per day minimum wage
policy and deploying new tax reforms designed to lower rates on middle-income
earners. The Thai economy has weathered internal and external economic shocks
in recent years. The global economic recession severely cut Thailand's exports,
with most sectors experiencing double-digit drops. In late 2011 Thailand's
recovery was interrupted by historic flooding in the industrial areas in
Bangkok and its five surrounding provinces, crippling the manufacturing sector.
The government approved flood mitigation projects worth $11.7 billion, which
were started in 2012, to prevent similar economic damage, and an additional $75
billion for infrastructure over the following seven years.
|
Source : CIA |
Company
name
HWATAI INDUSTRY
COMPANY LIMITED
SUMMARY
BUSINESS
ADDRESS : 582
MOO 14, BANGPOO
INDUSTRIAL ESTATE,
SUKHUMVIT ROAD,
PRAEKSA, MUANG,
SAMUTPRAKARN 10280,
THAILAND
TELEPHONE : [66] 2709-4996-8,
2709-6991-3
FAX :
[66] 2709-3946,
2323-0868
E-MAIL
ADDRESS : sales@hwa-tai.com
REGISTRATION
ADDRESS : SAME
AS BUSINESS ADDRESS
ESTABLISHED
: 1991
REGISTRATION
NO. : 0105534105606
TAX
ID NO. : 3011031193
CAPITAL REGISTERED : BHT. 158,000,000
CAPITAL PAID-UP : BHT.
158,000,000
SHAREHOLDER’S PROPORTION : THAI :
95.00%
CHINESE :
5.00%
FISCAL YEAR CLOSING DATE : DECEMBER 31
LEGAL
STATUS : PRIVATE LIMITED
COMPANY
EXECUTIVE : MS. YASINEE APITANOTAI,
THAI
MANAGING DIRECTOR
NO.
OF STAFF : 50
LINES
OF BUSINESS : DYESTUFFS
MANUFACTURER, DISTRIBUTOR
AND EXPORTER
CORPORATE
PROFILE
OPERATING
TREND : STABLE
PRESENT
SITUATION : OPERATING NORMALLY
REPUTATION : GOOD
WITH NORMAL BUSINESS
ENGAGEMENT
MANAGEMENT
STANDARD : MANAGEMENT WITH
FAIR PERFORMANCE
HISTORY
The
subject was established
on November 6, 1991 as
a private limited
company under the
name style HWATAI
INDUSTRY COMPANY LIMITED,
by a joint
investment between Taiwan Dyestuff
& Chemical Corp.,
and Allied Industrial
Corp., Ltd. in Taiwan,
in order to
manufacture and distribute
wide range of
dyestuff to both
domestic and international
markets. It currently employs
approximately 50 staff.
It
achieved the ISO
9002 : 1994 certification, with
the certificate No. B2000-013
by BQR & ANSI-RAB.
The
subject’s registered address
is 582 Moo
14, Bangpoo Industrial
Estate, Sukhumvit Rd.,
Praeksa, Muang, Samutprakarn
10280, and this
is the subject’s
current operation address.
THE BOARD
OF DIRECTOR
|
Name |
|
Nationality |
Age |
|
|
|
|
|
|
Mr. Pasit Apitanotai |
[x] |
Thai |
59 |
|
Mr. Chue Wei Chang |
|
Chinese |
45 |
|
Mrs. Nontaya Apitanotai |
[x] |
Thai |
57 |
|
Ms. Yasinee Apitanotai |
[x] |
Thai |
31 |
AUTHORIZED
PERSON
Anyone of the
mentioned directors [x]
can sign on
behalf of the
subject with company’s
affixed.
MANAGEMENT
Ms. Yasinee Apitanotai is
the Managing Director.
She is Thai
nationality with the
age of 31
years old.
BUSINESS
OPERATIONS
The subject is
engaged in manufacturing
and distributing wide
range of dyestuffs
as follows:
Product Brand
Acid Dyes “Halon”, “Halan”,
“Hellonol”, “Hellonolset”
Disperse Dyes “Hellocron”
Reactive Dyes “Helllofix”
Direct Dyes “Hello Direct”
PURCHASE
Most of raw
materials and chemicals
are purchased from
local suppliers, the
remaining is imported
from Taiwan, Republic of
China, Germany and
Malaysia.
MAJOR SUPPLIERS
Taiwan
Dyestuff & Chemical
Corp. : Taiwan
Siam
Pro Trading Co.,
Ltd. : Thailand
SALES
80% of the
products is sold
locally by wholesale
to dealers, manufacturers
and end-users, and
the remaining 20%
is exported to
Republic of China,
Indonesia, Vietnam, Malaysia,
India, Bangladesh and
Taiwan.
RELATED AND AFFILIATED
COMPANY
Siam Pro Dyechem
Group Co., Ltd.
Business Type :
Manufacturer and distributor
of textile chemical
LITIGATION
Bankruptcy and
Receivership
There are no
litigation on bankruptcy
and receivership cases
filed against the
subject found at
Legal Execution Department
for the past
five years.
Others
There are no
legal suits filed
against the subject
for the past
two years.
CREDIT
Sales are by
cash or on the credits
term of 30-60
days.
Local bills are
paid by cash
or on the
credits term of
30-60 days.
Imports are by
L/C at sight
or T/T.
Exports are against
T/T.
BANKING
Bangkok Bank Public
Co., Ltd.
EMPLOYMENT
The
subject currently employs
approximately 50 staff.
LOCATION
DETAILS
The
premise is owned
for administrative office,
factory and warehouse
at the heading
address. Premise is
located in industrial
area.
Branch/Warehouse:
1/108
Moo 2, Thonburi-Pakthor Road,
Thasai, Muang, Samutprakarn
74000.
COMMENT
The
subject’s sales in 2013 was reported
higher than the previous year,
but slow market
growth has seen
for several months
due to continuous rising
of raw materials,
operating expenses and
sluggish industrial
consumption. Subject’s performance
is likely to
grow at slow
pace this year.
FINANCIAL
INFORMATION
The
capital was registered
at Bht. 1,000,000
divided into 10,000
shares of Bht. 100
each.
The
capital was increased
later as following:
Bht. 45,000,000
on January 13,
1992
Bht. 115,000,000
on June 27,
1994
Bht. 158,000,000
on November 29,
1999
The
latest registered capital
was increased to
Bht. 158 million, divided
into 15,800,000 shares
of Bht. 10
each with fully
paid.
THE
SHAREHOLDERS LISTED WERE
: [as at
April 30, 2014]
|
NAME |
HOLDING |
% |
|
|
|
|
|
Mr. Pasit Apitanotai Nationality: Thai Address : 701/1606
Pattanakarn 30 Rd.,
Suanluang, Bangkok |
7,900,000 |
50.00 |
|
Mrs. Nontaya Apitanotai Nationality: Thai Address : 2031 Moo
9, Samrongnua, Muang, Samutprakarn |
4,740,000 |
30.00 |
|
Ms. Yasinee Apitanotai Nationality: Thai Address : 701/1606
Pattanakarn 30 Rd.,
Suanluang, Bangkok |
790,000 |
5.00 |
|
Mr. Thitipong Apitanotai Nationality: Thai Address : 701/1606
Pattanakarn 30 Rd.,
Suanluang, Bangkok |
790,000 |
5.00 |
|
Mr. Krongwich Apitanotai Nationality: Thai Address : 701/1606
Pattanakarn 30 Rd.,
Suanluang, Bangkok |
790,000 |
5.00 |
|
Mr. Chue Wei Chang Nationality: Chinese Address : 16/80
Srinakarin Rd., Nongbon,
Praves, Bangkok |
474,000 |
3.00 |
|
Mrs. Chue Hui Chang Nationality: Chinese Address : 16/80
Srinakarin Rd., Nongbon,
Praves, Bangkok |
316,000 |
2.00 |
Total Shareholders : 7
Share Structure [as
at April 30,
2014]
|
Nationality |
Shareholders |
No. of Share |
% Shares |
|
|
|
|
|
|
Thai |
5 |
15,010,000 |
95.00 |
|
Foreign - Chinese |
2 |
790,000 |
5.00 |
|
Total |
7 |
15,800,000 |
100.00 |
NAME OF AUDITOR
& CERTIFIED PUBLIC
ACCOUNTANT NO. :
Ms. Sasithorn
Methapitaksakul No. 5742
BALANCE
SHEET [BAHT]
The latest financial figures published as
at December 31,
2013, 2012 &
2011 were:
ASSETS
|
Current Assets |
2013 |
2012 |
2011 |
|
|
|
|
|
|
Cash and Cash Equivalents |
8,041,271.69 |
6,070,911.52 |
7,367,410.72 |
|
Trade Accounts and
Other Receivable |
122,331,890.24 |
75,169,351.12 |
84,038,571.84 |
|
Inventories |
225,249,623.35 |
160,600,153.13 |
146,661,528.40 |
|
Value Added Tax Receivable |
531,005.22 |
- |
1,439,674.39 |
|
Other Current Assets
|
18,635,314.68 |
733,606.10 |
737,193.97 |
|
|
|
|
|
|
Total Current Assets
|
374,789,105.18 |
242,574,021.87 |
240,244,379.32 |
|
Fixed Assets |
55,962,098.63 |
62,939,540.04 |
71,391,696.17 |
|
Other Non-current Assets |
194,940.23 |
194,906.10 |
194,876.78 |
|
Total Assets |
430,946,144.04 |
305,708,468.01 |
311,830,952.27 |
LIABILITIES &
SHAREHOLDERS’ EQUITY [BAHT]
|
Current Liabilities |
2013 |
2012 |
2011 |
|
|
|
|
|
|
Bank Overdraft & Short-term Loan From Financial Institutions |
210,221,410.61 |
111,806,239.92 |
113,088,796.46 |
|
Trade Accounts and
Other Payable |
28,925,028.41 |
5,185,613.67 |
30,699,861.76 |
|
Current Portion of Long-term Liabilities |
585,493.02 |
1,943,901.07 |
1,973,581.35 |
|
Short-term Loan from Related
Company |
80,428,139.00 |
96,453,576.25 |
89,500,003.25 |
|
Accrued Income Tax |
3,080,236.53 |
2,557,979.52 |
3,082,807.34 |
|
Other Current Liabilities |
89,149.97 |
670,367.65 |
97,931.74 |
|
|
|
|
|
|
Total Current Liabilities |
323,329,457.54 |
218,617,678.08 |
238,442,981.90 |
|
|
|
|
|
|
Long-term Loans |
182,967.20 |
782,764.50 |
2,802,887.64 |
|
Total Liabilities |
323,512,424.74 |
219,400,442.58 |
241,245,869.54 |
|
|
|
|
|
|
Shareholders' Equity |
|
|
|
|
|
|
|
|
|
Share capital : Baht 10
par value authorized, issued
and fully paid share
capital 15,800,000 shares |
158,000,000.00 |
158,000,000.00 |
158,000,000.00 |
|
|
|
|
|
|
Capital Paid |
158,000,000.00 |
158,000,000.00 |
158,000,000.00 |
|
Retained Earnings
Unappropriated |
[50,566,280.70] |
[71,691,974.57] |
[87,414,917.27] |
|
Total Shareholders' Equity |
107,433,719.30 |
86,308,025.43 |
70,585,082.73 |
|
Total Liabilities & Shareholders' Equity |
430,946,144.04 |
305,708,468.01 |
311,830,952.27 |
PROFIT &
LOSS ACCOUNT
|
Sales |
2013 |
2012 |
2011 |
|
|
|
|
|
|
Sales Income |
356,741,604.89 |
298,928,849.43 |
319,226,601.55 |
|
Other Income |
954,472.81 |
4,727,552.92 |
8,956,644.54 |
|
Total Sales |
357,696,077.70 |
303,656,402.35 |
328,183,246.09 |
|
Expenses |
|
|
|
|
|
|
|
|
|
Cost of Goods
Sold |
279,151,887.16 |
244,310,865.87 |
265,587,965.62 |
|
Selling Expenses |
15,223,904.89 |
15,181,510.31 |
15,538,771.10 |
|
Administrative Expenses |
23,192,865.73 |
19,478,577.55 |
29,177,716.59 |
|
Other Expenses |
9,783,309.10 |
- |
4,491,723.77 |
|
Total Expenses |
327,351,966.88 |
278,970,953.73 |
314,796,177.08 |
|
|
|
|
|
|
Profit before Financial Cost & Income
Tax |
30,344,110.82 |
24,685,448.62 |
13,387,069.01 |
|
Financial Costs |
[3,348,180.42] |
[3,782,526.40] |
[3,378,470.83] |
|
Profit before Income
Tax |
26,995,930.40 |
20,902,922.22 |
10,008,598.18 |
|
Income Tax |
[5,870,236.53] |
[5,179,979.52] |
[6,344,614.60] |
|
|
|
|
|
|
Net Profit / [Loss] |
21,125,693.87 |
15,722,942.70 |
3,663,983.58 |
FINANCIAL ANALYSIS
|
ITEM |
UNIT |
2013 |
2012 |
2011 |
|
|
|
|
|
|
|
LIQUIDITY RATIO |
|
|
|
|
|
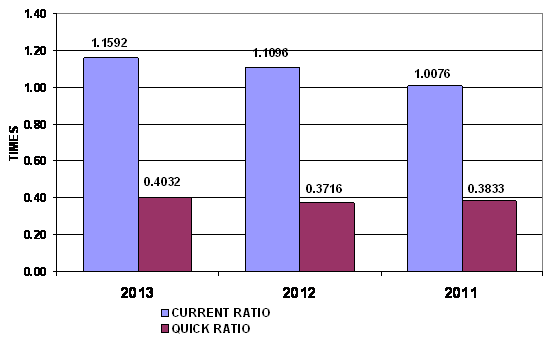
CURRENT RATIO |
TIMES |
1.16 |
1.11 |
1.01 |
|
QUICK RATIO |
TIMES |
0.40 |
0.37 |
0.38 |
|
|
|
|
|
|
|
ACTIVITY RATIO |
|
|
|
|
|
FIXED ASSETS TURNOVER |
TIMES |
6.37 |
4.75 |
4.47 |
|
TOTAL ASSETS TURNOVER |
TIMES |
0.83 |
0.98 |
1.02 |
|
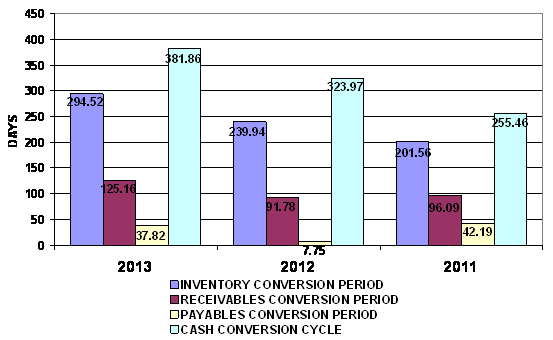
INVENTORY CONVERSION PERIOD |
DAYS |
294.52 |
239.94 |
201.56 |
|
INVENTORY TURNOVER |
TIMES |
1.24 |
1.52 |
1.81 |
|
RECEIVABLES CONVERSION PERIOD |
DAYS |
125.16 |
91.78 |
96.09 |
|
RECEIVABLES TURNOVER |
TIMES |
2.92 |
3.98 |
3.80 |
|
PAYABLES CONVERSION PERIOD |
DAYS |
37.82 |
7.75 |
42.19 |
|
CASH CONVERSION CYCLE |
DAYS |
381.86 |
323.97 |
255.46 |
|
|
|
|
|
|
|
PROFITABILITY
RATIO |
|
|
|
|
|
COST OF GOODS SOLD |
% |
78.25 |
81.73 |
83.20 |
|
SELLING & ADMINISTRATION |
% |
10.77 |
11.59 |
14.01 |
|
INTEREST |
% |
0.94 |
1.27 |
1.06 |
|
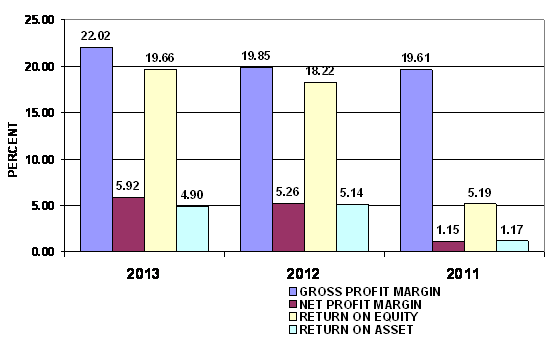
GROSS PROFIT MARGIN |
% |
22.02 |
19.85 |
19.61 |
|
NET PROFIT MARGIN BEFORE EX. ITEM |
% |
8.51 |
8.26 |
4.19 |
|
NET PROFIT MARGIN |
% |
5.92 |
5.26 |
1.15 |
|
RETURN ON EQUITY |
% |
19.66 |
18.22 |
5.19 |
|
RETURN ON ASSET |
% |
4.90 |
5.14 |
1.17 |
|
EARNING PER SHARE |
BAHT |
1.34 |
1.00 |
0.23 |
|
|
|
|
|
|
|
LEVERAGE RATIO |
|
|
|
|
|
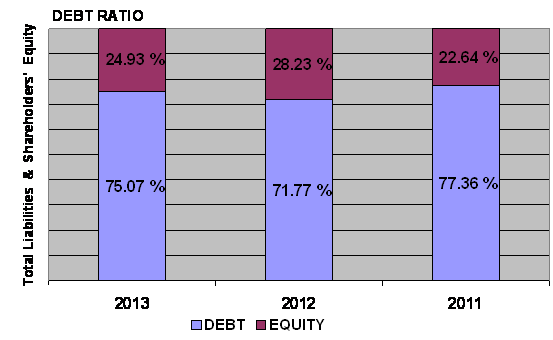
DEBT RATIO |
TIMES |
0.75 |
0.72 |
0.77 |
|
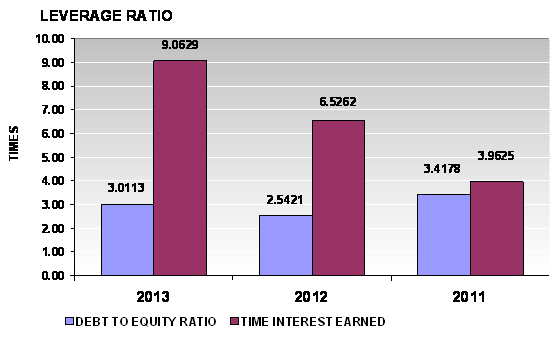
DEBT TO EQUITY RATIO |
TIMES |
3.01 |
2.54 |
3.42 |
|
TIME INTEREST EARNED |
TIMES |
9.06 |
6.53 |
3.96 |
|
|
|
|
|
|
|
ANNUAL GROWTH |
|
|
|
|
|
SALES GROWTH |
% |
19.34 |
(6.36) |
|
|
OPERATING PROFIT |
% |
22.92 |
84.40 |
|
|
NET PROFIT |
% |
34.36 |
329.12 |
|
|
FIXED ASSETS |
% |
(11.09) |
(11.84) |
|
|
TOTAL ASSETS |
% |
40.97 |
(1.96) |
|
ANNUAL GROWTH :
IMPRESSIVE
An annual sales growth is 19.34%. Turnover has increased from THB
298,928,849.43 in 2012 to THB 356,741,604.89 in 2013. While net profit has
increased from THB 15,722,942.70 in 2012 to THB 21,125,693.87 in 2013. And
total assets has increased from THB 305,708,468.01 in 2012 to THB
430,946,144.04 in 2013.
PROFITABILITY :
EXCELLENT
PROFITABILITY
RATIO
|
Gross Profit Margin |
22.02 |
Impressive |
Industrial Average |
1.04 |
|
Net Profit Margin |
5.92 |
Impressive |
Industrial Average |
1.09 |
|
Return on Assets |
4.90 |
Impressive |
Industrial Average |
1.55 |
|
Return on Equity |
19.66 |
Impressive |
Industrial Average |
2.03 |
Gross Profit Margin used to assess a firm's financial health by
revealing the proportion of money left over from sales after accounting for the
cost of goods sold. Gross profit margin serves as the source for paying
additional expenses and future savings. The
company’s figure is 22.02%. When compared with the industry average, the
ratio of the company was higher, indicated that company was more profitable
than the same industry.
Net Profit Margin is the indicator of the company's efficiency in that
net profit takes into consideration all expenses of the company. A low profit
margin indicates a low margin of safety, higher risk that a decline in sales
will erase profits and result in a net loss. The company’s figure is 5.92%, higher figure when compared with those
of its average competitors in the same industry, indicated that business was an
efficient operator in a dominant
position within its industry.
Return on Assets measures how efficiently profits are being generated
from the assets employed in the business when compared with the ratios of firms
in a similar business. A low ratio in comparison with industry averages
indicates an inefficient use of business assets. Return on Assets ratio is
4.9%, higher figure when compared with those of its average competitors in the
same industry, indicated that business
was an efficient profit in a dominant
position within its industry.
Return on Equity indicates how profitable a company is by comparing its
net income to its average shareholders' equity, ROE measures how much the
shareholders earned for their investment in the company. Return on Equity ratio is 19.66%, higher figure when compared
with those of its average competitors in the same industry, indicated that business
was an efficient profit in a dominant
position within its industry.
Trend of the
average competitors in the same industry for last 5 years
Return on Assets Uptrend
Return on Equity Downtrend
LIQUIDITY : RISKY
LIQUIDITY RATIO
|
Current Ratio |
1.16 |
Deteriorated |
Industrial Average |
2.58 |
|
Quick Ratio |
0.40 |
|
|
|
|
Cash Conversion Cycle |
381.86 |
|
|
|
The Current Ratio is to ascertain whether a company's short-term assets are
readily available to pay off its short-term liabilities. The company's figure
is 1.16 times in 2013, increased from 1.11 times, then it is generally
considered to have good short-term financial strength. When compared with the
industry average, the ratio of the company was lower.
The Quick Ratio is a liquidity indicator that further refines the
current ratio by measuring the amount of the most liquid current assets there
are to cover current liabilities. The company's figure is 0.4 times in 2013,
increased from 0.37 times, then the company has not enough current assets that
presumably can be quickly converted to cash for pay financial obligations.
The Cash Conversion Cycle measures the number of days a company's cash
is tied up in the production and sales process of its operations and the
benefit from payment terms from its creditors. It meant the company could
survive when no cash inflow was received from sale for 382 days.
Trend of the
average competitors in the same industry for last 5 years
Current Ratio Uptrend
LEVERAGE :
ACCEPTABLE
LEVERAGE RATIO
|
Debt Ratio |
0.75 |
Acceptable |
Industrial Average |
0.18 |
|
Debt to Equity Ratio |
3.01 |
Risky |
Industrial Average |
0.22 |
|
Times Interest Earned |
9.06 |
Impressive |
Industrial Average |
- |
Debt to Equity Ratio a measurement of how much suppliers, lenders,
creditors and obligors have committed to the company versus what the shareholders
have committed. A higher the percentage means that the company is using less
equity and has stronger leverage position.
Times Interest Earned measuring a company's ability to meet its debt
obligations. Ratio is 9.07 higher than 1, so the company can pay interest
expenses on outstanding debt.
Debt Ratio shows the proportion of a company's assets which are financed
through debt. The company's figure is 0.75 greater than 0.5, most of the
company's assets are financed through debt.
Trend of the average
competitors in the same industry for last 5 years
Debt Ratio Downtrend
Times Interest Earned Stable
ACTIVITY :
ACCEPTABLE
ACTIVITY RATIO
|
Fixed Assets Turnover |
6.37 |
Impressive |
Industrial Average |
- |
|
Total Assets Turnover |
0.83 |
Acceptable |
Industrial Average |
1.43 |
|
Inventory Conversion Period |
294.52 |
|
|
|
|
Inventory Turnover |
1.24 |
Deteriorated |
Industrial Average |
6.86 |
|
Receivables Conversion Period |
125.16 |
|
|
|
|
Receivables Turnover |
2.92 |
Deteriorated |
Industrial Average |
10.90 |
|
Payables Conversion Period |
37.82 |
|
|
|
The company's Account Receivable Ratio is calculated as 2.92 and 3.98 in
2013 and 2012 respectively. This ratio measures the efficiency of the company
in managing its trade debtors to generate sales. A lower ratio may indicate
over extension and collection problems. Conversely, a higher ratio may indicate
an overtly stringent policy. In this case, the company's A/R ratio in 2013
decreased from 2012. This would suggest the company had deteriorated in the
management of its debt collections.
Inventory Turnover in Days Ratio indicates the liquidity of inventory.
It estimates the number of days that it will take to sell the current
inventory. Inventory is particularly sensitive to change in business
activities. The inventory turnover in days has increased from 240 days at the
end of 2012 to 295 days at the end of 2013. This represents a negative trend.
And Inventory turnover has decreased from 1.52 times in year 2012 to 1.24 times
in year 2013.
The company's Total Asset Turnover is calculated as 0.83 times and 0.98
times in 2013 and 2012 respectively. This ratio is determined by dividing total
assets into total sales turnover. The ratio measures the activity of the assets
and the ability of the firm to generate sales through the use of the assets.
Trend of the
average competitors in the same industry for last 5 years
Fixed Assets Turnover Stable
Total Assets Turnover Uptrend
Inventory Turnover Uptrend
Receivables Turnover Uptrend
FOREIGN EXCHANGE RATES
|
Currency |
Unit
|
Indian Rupees |
|
US Dollar |
1 |
Rs.59.30 |
|
UK Pound |
1 |
Rs.99.34 |
|
Euro |
1 |
Rs.80.70 |
INFORMATION DETAILS
|
Analysis Done by
: |
KAR |
|
|
|
|
Report Prepared
by : |
MNL |
RATING EXPLANATIONS
|
RATING |
STATUS |
PROPOSED CREDIT LINE |
|
|
>86 |
Aaa |
Possesses an extremely sound financial base with the strongest capability
for timely payment of interest and principal sums |
Unlimited |
|
71-85 |
Aa |
Possesses adequate working capital. No caution needed for credit
transaction. It has above average (strong) capability for payment of interest
and principal sums |
Large |
|
56-70 |
A |
Financial & operational base are regarded healthy. General
unfavourable factors will not cause fatal effect. Satisfactory capability for
payment of interest and principal sums |
Fairly Large |
|
41-55 |
Ba |
Overall operation is considered normal. Capable to meet normal
commitments. |
Satisfactory |
|
26-40 |
B |
Capability to overcome financial difficulties seems comparatively
below average. |
Small |
|
11-25 |
Ca |
Adverse factors are apparent. Repayment of interest and principal sums
in default or expected to be in default upon maturity |
Limited with
full security |
|
<10 |
C |
Absolute credit risk exists. Caution needed to be exercised |
Credit not
recommended |
|
-- |
NB |
New Business |
-- |
This score serves as a reference to assess
SC’s credit risk and to set the amount of credit to be extended. It is
calculated from a composite of weighted scores obtained from each of the major
sections of this report. The assessed factors and their relative weights (as
indicated through %) are as follows:
Financial
condition (40%) Ownership
background (20%) Payment
record (10%)
Credit history
(10%) Market trend (10%) Operational size
(10%)
This report is issued at your request without any
risk and responsibility on the part of MIRA INFORM PRIVATE LIMITED (MIPL)
or its officials.