MIRA INFORM REPORT
|
Report Date : |
10.06.2014 |
IDENTIFICATION DETAILS
|
Name : |
SCHNEIDER ELECTRIC INFRASTRUCTURE LIMITED (w.e.f. 08.12.2011) |
|
|
|
|
Formerly Known
As : |
SMARTGRID AUTOMATION DISTRIBUTION AND SWITCHGEAR LIMITED |
|
|
|
|
Registered
Office : |
Milestone 87, Vadodara, Halol Highway, Village Kotambi, Post Office
Jarod, Vadodara – 391510, Gujarat |
|
|
|
|
Country : |
India |
|
|
|
|
Financials (as
on) : |
31.03.2013 |
|
|
|
|
Date of
Incorporation : |
12.03.2011 |
|
|
|
|
Com. Reg. No.: |
04-064420 |
|
|
|
|
Capital
Investment / Paid-up Capital : |
Rs.478.210 Millions |
|
|
|
|
CIN No.: [Company Identification
No.] |
L31900GJ2011PLC064420 |
|
|
|
|
PAN No.: [Permanent Account No.] |
AAPCS6078Q |
|
|
|
|
Legal Form : |
A Public Limited Liability Company. The Company’s Shares are Listed on
the Stock Exchanges. |
|
|
|
|
Line of Business
: |
The company is engaged in the business of Manufacturing, Designing,
Building and Servicing Technologically Advanced Products and Systems for
Electricity Distribution Including Products such as Distribution
Transformers, Medium Voltage Switchgears, Medium and Low Voltage Protection
Relays and Electricity Distribution and Automation Equipments. |
|
|
|
|
No. of Employees
: |
Not Available |
RATING & COMMENTS
|
MIRA’s Rating : |
Ba (42) |
|
RATING |
STATUS |
PROPOSED CREDIT LINE |
|
|
41-55 |
Ba |
Overall operation is considered normal. Capable to meet normal
commitments. |
Satisfactory |
|
sStatus : |
Satisfactory |
|
|
|
|
Payment Behaviour : |
Slow but correct |
|
|
|
|
Litigation : |
Clear |
|
|
|
|
Comments : |
Subject is a well-established and reputed company having satisfactory
track record. The company has incurred a loss during current year. However, networth
of the company appears to be decent. The company receives good support from its group company. Trade
relations are reported as fair. Business is active. Payments are reported to
be slow but correct. The company can be considered normal for business dealings at usual
trade terms and conditions. |
NOTES :
Any query related to this report can be made
on e-mail : infodept@mirainform.com
while quoting report number, name and date.
ECGC Country Risk Classification List – March 31, 2014
|
Country Name |
Previous Rating (31.12.2013) |
Current Rating (31.03.2014) |
|
India |
A1 |
A1 |
|
Risk Category |
ECGC
Classification |
|
Insignificant |
A1 |
|
Low |
A2 |
|
Moderate |
B1 |
|
High |
B2 |
|
Very High |
C1 |
|
Restricted |
C2 |
|
Off-credit |
D |
INDIAN ECONOMIC OVERVIEW
US investment bank
Goldman Sachs has upgraded its outlook on Indian markets as it expects
positive impact of the election cycle.
India’s economy may grow
4.7 % in the current financial year, lower than the official estimate of 4.9 %,
Fitch Rating said. The global rating agency expects the economy to pick up in
the next two financial years.
Global ratings
agency Standard & Poor said increasing focus by India Inc on lowering debt
is likely to improve their credit profiles.
Singapore (1.1
million Indian tourists in 2012), Thailand (one million), the United Arab
Emirates ().98 million) and Malaysia ().82 million) emerged as the preferred
holidays hotspots for Indians. The total figure is expected to increase to 1.93
million by 2017, according to the latest Eurmonitor international report.
There is a $29.34 bn
outward foreign direct investment by domestic companies between April and
January of 2013/14 which has seen some signs of recovery according to a Care
Ratings report.
There are 264 number
of new companies being set up every day on average during 2014. Most of them
are registered in Mumbai. India had 1.38 million registered companies at the
end of January, 2014.
Twitter like
messaging service Weibo Corporation has filed to raise $ 500 million via a US
initial public offering. Alibaba, which owns a stake in Weibo is expected to
raise about $ 15 billion New York this year in the highest profile Internet IPO
since Facebook’s in 2012.
Bharti Airtel has
raised Rs.2,453.2 crore (350 million Swiss Francs) by selling six-year bonds at
a coupon rate of three per cent and maturing in 2020. This is the largest ever
bond offering by an Indian company in Swiss Francs. Bharat Petroleum
Corporation raised 175 million Swiss Francs by selling five year bonds at 2.98
% coupon rate in February.
Indian Oil
Corporation plans to invest Rs 7650 crore in setting up a petrochemical complex
at its almost complete Paradip refinery in Odhisha in three to four years. The
company board is set to consider the setting up of a 700000 tonne per annum
polypropylene plant at an estimated cost at Rs.3150 crore.
Global chief
information officers at gathering in Bangalore in April to meet Indian startups
at an event called Tech50 Watchout for Little Eye Labs-Facebook type deals in
the making.
RBI DEFAULTERS’ LIST STATUS
Subject’s name is not enlisted as a defaulter
in the publicly available RBI Defaulters’ list.
EPF (Employee Provident Fund) DEFAULTERS’ LIST STATUS
Subject’s name is not enlisted as a defaulter
in the publicly available EPF (Employee Provident Fund) Defaulters’ list as of
31-03-2012.
INFORMATION DENIED
MANAGEMENT NON CO-OPERATIVE (91-120-3940400)
LOCATIONS
|
Registered Office : |
Milestone 87, Vadodara, Halol Highway, Village Kotambi, Post Office
Jarod, Vadodara – 391510, Gujarat, India |
|
Tel. No.: |
91-120-3940400 / 3898703 |
|
Fax No.: |
91-120-3898700 |
|
E-Mail : |
|
|
Website : |
|
|
|
|
|
Corporate Office : |
7th Floor, Tower 3, IGL Complex, Plot 2B Sector 126, Noida
– 201304, Uttar Pradesh, India |
|
|
|
|
Factory 1: |
Naini Works, P. O. Naini, Allahabad – 211006, Uttar Pradesh, India |
|
Tel. No.: |
91-532-2699990 |
|
Fax No.: |
91-532-2699990 |
|
|
|
|
Factory 2: |
Survey No. 215, Gagilapur Village, Qutbullapur Mandal. District Rangareddy,
Hyderabad – 500043, Andhra Pradesh, India |
|
|
|
|
Factory 3 : |
PSS – 58, MIDC Satpur, Nasik – 422007, Maharashtra, India |
|
|
|
|
Branch Office : |
Technopolis, 3rd Floor, Block BP, Sector V, Salt Lake City,
Kolkata – 700091, West Bengal, India |
|
|
|
|
Regional Office : |
Located At:
|
|
|
|
|
Branch Offices : |
Located At:
|
DIRECTORS
As on: 31.03.2013
|
Name : |
Mr. Vinod Kumar Dhall |
|
Designation : |
Chairman (Non-Executive) |
|
|
|
|
Name : |
Mr. Prakash Kumar Chandraker |
|
Designation : |
Managing Director |
|
|
|
|
Name : |
Mr. Olivier Blum |
|
Designation : |
Director (Upto 01.03.2013 |
|
|
|
|
Name : |
Mr. Anil Chaudhry |
|
Designation : |
Director |
|
|
|
|
Name : |
Mr. Ranjan Pant |
|
Designation : |
Director |
|
|
|
|
Name : |
Mr. Alexandre Tagger |
|
Designation : |
CFO and Whole Time Director |
|
|
|
|
Name : |
Mr. Rajani Kesari |
|
Designation : |
Director (w.e.f. 22.05.2013) |
|
|
|
|
Name : |
Mr. V S Vsudevan |
|
Designation : |
Director (w.e.f. 11.03.2013) |
KEY EXECUTIVES
|
Name : |
Mr. C. S. Ashok Kumar |
|
Designation : |
Company Secretary |
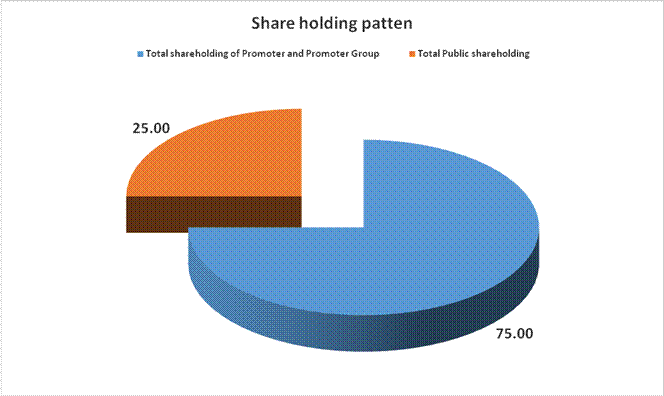
MAJOR SHAREHOLDERS / SHAREHOLDING PATTERN
As on: 31.03.2014
|
Category of
Shareholder |
Total No. of
Shares |
% of Total No.
of Shares |
|
(A) Shareholding of Promoter and Promoter Group |
||
|
|
|
|
|
|
168735367 |
70.57 |
|
|
168735367 |
70.57 |
|
|
|
|
|
|
10592659 |
4.43 |
|
|
10592659 |
4.43 |
|
Total shareholding of Promoter and Promoter Group (A) |
179328026 |
75.00 |
|
(B) Public Shareholding |
||
|
|
|
|
|
|
13510512 |
5.65 |
|
|
10335 |
0.00 |
|
|
605 |
0.00 |
|
|
8285359 |
3.47 |
|
|
468313 |
0.20 |
|
|
22275124 |
9.32 |
|
|
|
|
|
|
11304294 |
4.73 |
|
|
|
|
|
|
20972499 |
8.77 |
|
|
3181812 |
1.33 |
|
|
2042280 |
0.85 |
|
|
567274 |
0.24 |
|
|
405 |
0.00 |
|
|
4415 |
0.00 |
|
|
1470186 |
0.61 |
|
|
37500885 |
15.68 |
|
Total Public shareholding (B) |
59776009 |
25.00 |
|
Total (A)+(B) |
239104035 |
100.00 |
|
(C) Shares held by Custodians and against which Depository Receipts
have been issued |
0 |
0.00 |
|
|
0 |
0.00 |
|
|
0 |
0.00 |
|
|
0 |
0.00 |
|
Total (A)+(B)+(C) |
239104035 |
0.00 |
BUSINESS DETAILS
|
Line of Business : |
The company is engaged in the business of Manufacturing, Designing,
Building and Servicing Technologically Advanced Products and Systems for
Electricity Distribution Including Products such as Distribution
Transformers, Medium Voltage Switchgears, Medium and Low Voltage Protection
Relays and Electricity Distribution and Automation Equipments. |
GENERAL INFORMATION
|
No. of Employees : |
Not Available |
|
|
|
|
Bankers : |
Not Available |
|
Banking
Relations : |
-- |
|
|
|
|
Auditors : |
|
|
Name : |
S.R Batliboi and Company Chartered Accountants |
|
Address : |
Golf View, Corporate Tower B, Sector 42, Sector Road, Gurgaon - 122002,
Haryana-, India |
|
|
|
|
Holding Company: |
Alstom Grid SAS, France (Upto March 28, 2012), Energy Grid Automation
Transformers and Switchgears India Limited (w.e.f. March 28, 2012) |
|
|
|
|
Ultimate Holding Company: |
Alstom Sextant 5 SAS, France a special purpose vehicle formed with
Alstom Holdings and Schneider Electric Services International (Upto March 28,
2012) |
|
|
|
|
Parent of holding company and Others |
T and D Holding, France (parent of holding company) (upto March 28,
2012) Long and Crawford Limited (along with other promoters) (upto March 28,
2012) |
|
|
|
|
Subsidiary company: |
Energy Grid Automation Transformers and Switchgears India Limited (Upto
January5, 2012) |
|
|
|
|
Fellow
Subsidiaries : |
·
Schneider Electric India Pvt Ltd, India ·
Schneider Electric Huadian Switchgear, China ·
Schneider Electric Protectionale, France ·
Schneider Electric East Mediterranean S.A.L,
Jordan ·
Alstom T&D India Ltd, India (Upto February
14, 2013) ·
Schneider Electric Brasil Ltda., Brazil ·
Schneider Electric Sachsenwerk Gmbh, Germany ·
Areva Energietechnik Gmbh, Germany (Upto February
14, 2013) ·
Schneider Electric Energy, France ·
Schneider Electric Taiwan Co., Ltd., Taiwan ·
Schneider Electric Industries SAS, France ·
Alstom Switchgear, South Africa (Upto February
14, 2013) ·
Schneider Electric Service International Sprl,
Belgium ·
Schneider Electric Energy De, Columbia ·
Schneider Electric Energy UK Ltd, UK ·
Schneider Electric It Business India Pvt Ltd,
India ·
Schneider Electric Energy Poland Sp. Z O.O., ·
Poland Schneider Electric Mexico, Mexico ·
Schneider Electric Australia Pty Ltd, Australia ·
Areva Solar India Private Limited, India (Upto February
14, 2013) ·
Schneider Electric Industries, Malaysia ·
Areva T&D Uk Ltd Systems Produ, Uk (Upto
February 14, 2013) ·
Schneider Electric Energy, Italy ·
Schneider Electric Sri Lanka( Pvt) Ltd, Sri Lanka ·
Schneider Switchgear (Suzhou) Co. Ltd, ·
China Alstom Transport SA, France (Upto February
14, 2013) ·
Alstom S A Transport Tarbes, France (Upto
February 14, 2013) ·
Schneider Electric Vietnam., Ltd, Vietnam ·
Schneider Electric Nigeria Ltd., Nigeria ·
Schneider Electric (China) Investment Co. Ltd.,
Shanghai, China ·
Schneider Electric Canada Inc., Canada ·
Schneider Electric D.O.O., Croatia ·
Schneider Electric Sa, Uae Alstom Grid Sas,
France (Upto February 14, 2013) ·
Alstom Projects India Ltd, India (Upto February
14, 2013) ·
Schneider Electric Sa, South Africa ·
Schneider Enerji Endustri, Turkey ·
Areva T&D Australia Limited, Australia (Upto
February 14, 2013) ·
Schneider Electric Ftr, France ·
Alstom Grid Pte Ltd, Singapore (Upto February 14,
2013) ·
Areva T&D Sas, France (Upto February 14,
2013) ·
Alstom Grid Italy S.P.A., Italy (Upto February
14, 2013) ·
Alstom Grid Uk Ltd, (Upto February 14, 2013) ·
Power Measurement Ltd, Canada ·
Schneider Electric Telecontrol, France ·
Areva Renewable Energies Ltd, India (Upto
February 14, 2013) ·
Areva Ert Tanzania, Tanzania (Upto February 14,
2013) ·
Schneider Electric(China), China ·
Schneider-Electric Energy, ·
Schneider Electric, Indonesia ·
Shanghai Schneider Electric Power Automation
Co.,Ltd, China ·
Areva Suzhou High Voltage, Suzhou, China (Upto
February 14, 2013) ·
Areva T&D Enerji Endustrisi A.S.Turkey (Upto
February 14, 2013) ·
Areva T&D Malaysia Sdn Bhd-215632V, Malaysia
(Upto February 14, 2013) |
CAPITAL STRUCTURE
As on: 31.03.2013
Authorised Capital :
|
No. of Shares |
Type |
Value |
Amount |
|
|
|
|
|
|
250000000 |
Equity Shares |
Rs.2/- each |
Rs.500.000 Millions |
|
|
|
|
|
Issued, Subscribed & Paid-up Capital :
|
No. of Shares |
Type |
Value |
Amount |
|
|
|
|
|
|
239104035 |
Equity Shares |
Rs.2/- each |
Rs.478.210 Millions |
|
|
|
|
|
FINANCIAL DATA
[all figures are in
Rupees Millions]
ABRIDGED BALANCE
SHEET
|
SOURCES OF FUNDS |
31.03.2013 |
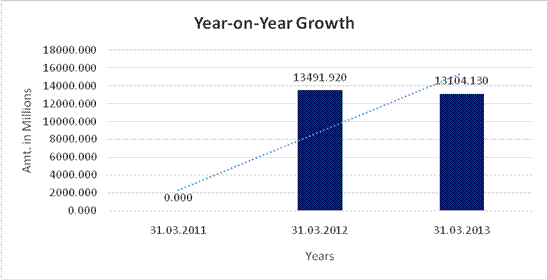
31.03.2012 |
31.03.2011 |
|
I.
EQUITY
AND LIABILITIES |
|
|
|
|
(1)Shareholders' Funds |
|
|
|
|
(a) Share Capital |
478.210 |
478.210 |
1.000 |
|
(b) Reserves & Surplus |
1906.850 |
2191.440 |
(0.160) |
|
(c) Money
received against share warrants |
0.000 |
0.000 |
0.000 |
|
|
|
|
|
|
(2) Share Application money pending allotment |
0.000 |
0.000 |
0.000 |
|
Total
Shareholders’ Funds (1) + (2) |
2385.060 |
2669.650 |
0.840 |
|
|
|
|
|
|
(3)
Non-Current Liabilities |
|
|
|
|
(a) long-term borrowings |
0.000 |
0.000 |
0.000 |
|
(b) Deferred tax liabilities (Net) |
0.000 |
0.000 |
0.000 |
|
(c) Other long term
liabilities |
0.000 |
0.000 |
0.000 |
|
(d) long-term
provisions |
244.660 |
206.100 |
0.000 |
|
Total Non-current
Liabilities (3) |
244.660 |
206.100 |
0.000 |
|
|
|
|
|
|
(4) Current Liabilities |
|
|
|
|
(a) Short term
borrowings |
2341.380 |
2248.170 |
0.000 |
|
(b) Trade payables |
6154.590 |
4867.630 |
0.170 |
|
(c) Other current
liabilities |
1767.110 |
2096.230 |
0.010 |
|
(d) Short-term
provisions |
158.060 |
332.530 |
0.000 |
|
Total Current
Liabilities (4) |
10421.140 |
9544.560 |
0.180 |
|
|
|
|
|
|
TOTAL |
13050.860 |
12420.310 |
1.020 |
|
|
|
|
|
|
II.
ASSETS |
|
|
|
|
(1) Non-current assets |
|
|
|
|
(a) Fixed Assets |
|
|
|
|
(i) Tangible assets |
1932.590 |
2072.690 |
0.000 |
|
(ii) Intangible Assets |
0.000 |
0.000 |
0.000 |
|
(iii) Capital
work-in-progress |
56.510 |
13.450 |
0.000 |
|
(iv)
Intangible assets under development |
0.000 |
0.000 |
0.000 |
|
(b) Non-current Investments |
0.000 |
0.000 |
0.000 |
|
(c) Deferred tax assets (net) |
114.230 |
82.390 |
0.020 |
|
(d) Long-term Loan and Advances |
88.750 |
85.790 |
0.000 |
|
(e) Other
Non-current assets |
0.000 |
0.000 |
0.000 |
|
Total Non-Current
Assets |
2192.080 |
2254.320 |
0.020 |
|
|
|
|
|
|
(2) Current assets |
|
|
|
|
(a) Current investments |
0.000 |
0.000 |
0.000 |
|
(b) Inventories |
1497.200 |
1639.370 |
0.000 |
|
(c) Trade receivables |
8089.880 |
7262.540 |
0.000 |
|
(d) Cash and cash
equivalents |
43.940 |
107.720 |
0.000 |
|
(e) Short-term loans
and advances |
1088.070 |
943.120 |
1.000 |
|
(f) Other current
assets |
139.690 |
213.240 |
0.000 |
|
Total Current Assets |
10858.780 |
10165.990 |
1.000 |
|
|
|
|
|
|
TOTAL |
13050.860 |
12420.310 |
1.020 |
PROFIT & LOSS
ACCOUNT
|
|
PARTICULARS |
31.03.2013 |
31.03.2012 |
31.03.2011 |
|
|
|
SALES |
|
|
|
|
|
|
|
Income |
13104.130 |
13491.920 |
0.000 |
|
|
|
Other Income |
68.310 |
43.090 |
0.000 |
|
|
|
TOTAL |
13172.440 |
13535.010 |
0.000 |
|
|
|
|
|
|
|
|
Less |
EXPENSES |
|
|
|
|
|
|
|
Cost of raw material and components consumed |
9073.920 |
9289.020 |
0.000 |
|
|
|
(Increases/ Decreases in inventories of finished goods and work in
progress |
(92.540) |
252.460 |
0.000 |
|
|
|
Employee benefits expenses |
1482.690 |
1224.380 |
0.000 |
|
|
|
Exceptional Item |
100.000 |
0.000 |
0.000 |
|
|
|
Other expenses |
2311.202 |
1782.730 |
0.180 |
|
|
|
TOTAL |
12875.270 |
12548.590 |
0.180 |
|
|
|
|
|
|
|
|
Less |
PROFIT
BEFORE INTEREST, TAX, DEPRECIATION AND AMORTISATION |
297.170 |
986.420 |
(0.180) |
|
|
|
|
|
|
|
|
|
Less |
FINANCIAL EXPENSES |
259.510 |
215.010 |
0.000 |
|
|
|
|
|
|
|
|
|
|
PROFIT
BEFORE TAX, DEPRECIATION AND AMORTISATION |
37.660 |
771.410 |
(0.180) |
|
|
|
|
|
|
|
|
|
Less/ Add |
DEPRECIATION/
AMORTISATION |
318.340 |
158.470 |
0.000 |
|
|
|
|
|
|
|
|
|
|
PROFIT BEFORE
TAX |
(280.680) |
612.940 |
(0.180) |
|
|
|
|
|
|
|
|
|
Less |
TAX |
3.910 |
215.290 |
(0.020) |
|
|
|
|
|
|
|
|
|
|
PROFIT AFTER TAX |
(284.590) |
397.650 |
(0.160) |
|
|
|
|
|
|
|
|
|
Add |
PREVIOUS
YEARS’ BALANCE BROUGHT FORWARD |
246.560 |
(0.160) |
0.000 |
|
|
|
|
|
|
|
|
|
Less |
APPROPRIATIONS |
|
|
|
|
|
|
|
Transfer to General Reserve |
0.000 |
39.770 |
0.000 |
|
|
|
Dividend |
0.000 |
95.640 |
0.000 |
|
|
|
Tax on Dividend |
0.000 |
15.520 |
0.000 |
|
|
BALANCE CARRIED
TO THE B/S |
(38.030) |
246.560 |
(0.160) |
|
|
|
|
|
|
|
|
|
|
EARNINGS IN
FOREIGN CURRENCY |
|
|
|
|
|
|
|
FOB Value Export |
1039.900 |
648.380 |
0.000 |
|
|
|
Other Services Income |
315.070 |
0.000 |
0.000 |
|
|
TOTAL EARNINGS |
1354.970 |
648.380 |
0.000 |
|
|
|
|
|
|
|
|
|
|
IMPORTS |
|
|
|
|
|
|
|
Raw Materials |
2061.850 |
1759.750 |
0.000 |
|
|
|
Components and Spares parts |
1.120 |
4.340 |
0.000 |
|
|
|
Capital Goods |
9.310 |
87.730 |
0.000 |
|
|
TOTAL IMPORTS |
2072.280 |
1851.820 |
0.000 |
|
|
|
|
|
|
|
|
|
|
Earnings Per
Share (Rs.) |
(1.19) |
1.66 |
(0.31) |
|
KEY RATIOS
|
PARTICULARS |
|
31.03.2013 |
31.03.2012 |
31.03.2011 |
|
PAT / Total Income |
(%) |
(2.16)
|
2.94 |
0.00 |
|
|
|
|
|
|
|
Net Profit Margin (PBT/Sales) |
(%) |
(2.14)
|
4.54 |
0.00 |
|
|
|
|
|
|
|
Return on Total Assets (PBT/Total Assets} |
(%) |
(2.18)
|
4.97 |
(18.00) |
|
|
|
|
|
|
|
Return on Investment (ROI) (PBT/Networth) |
|
(0.12)
|
0.23 |
(0.21) |
|
|
|
|
|
|
|
Debt Equity Ratio (Total Debt /Networth) |
|
0.98
|
0.08 |
0.00 |
|
|
|
|
|
|
|
Current Ratio (Current Asset/Current Liability) |
|
1.04
|
1.06 |
5.55 |
FINANCIAL ANALYSIS
[all figures are
in Rupees Millions]
DEBT EQUITY RATIO
|
Particular |
31.03.2011 |
31.03.2012 |
31.03.2013 |
|
|
(Rs.
In Millions) |
(Rs.
In Millions) |
(Rs.
In Millions) |
|
Share Capital |
1.000 |
478.210 |
478.210 |
|
Reserves & Surplus |
-0.160 |
2191.440 |
1906.850 |
|
Net
worth |
0.840 |
2669.650 |
2385.060 |
|
|
|
|
|
|
long-term borrowings |
0.000 |
0.000 |
0.000 |
|
Short term borrowings |
0.000 |
2248.170 |
2341.380 |
|
Total
borrowings |
0.000 |
2248.170 |
2341.380 |
|
Debt/Equity
ratio |
0.000 |
0.842 |
0.982 |

YEAR-ON-YEAR GROWTH
|
Year
on Year Growth |
31.03.2011 |
31.03.2012 |
31.03.2013 |
|
|
(Rs.
In Millions) |
(Rs.
In Millions) |
(Rs.
In Millions) |
|
Sales |
0.000 |
13491.920 |
13104.130 |
|
|
|
(2.874) |
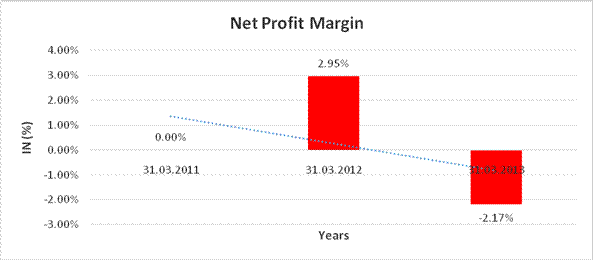
NET PROFIT MARGIN
|
Net
Profit Margin |
31.03.2011 |
31.03.2012 |
31.03.2013 |
|
|
(Rs.
In Millions) |
(Rs.
In Millions) |
(Rs.
In Millions) |
|
Sales |
0.000 |
13491.920 |
13104.130 |
|
Profit |
(0.160) |
397.650 |
(284.590) |
|
|
2.95% |
(2.17%) |
LOCAL AGENCY FURTHER INFORMATION
|
Sr. No. |
Check List by Info Agents |
Available in
Report (Yes / No) |
|
1] |
Year of Establishment |
Yes |
|
2] |
Locality of the firm |
Yes |
|
3] |
Constitutions of the firm |
Yes |
|
4] |
Premises details |
No |
|
5] |
Type of Business |
Yes |
|
6] |
Line of Business |
Yes |
|
7] |
Promoter's background |
No |
|
8] |
No. of employees |
No |
|
9] |
Name of person contacted |
No |
|
10] |
Designation of contact
person |
No |
|
11] |
Turnover of firm for last
three years |
Yes |
|
12] |
Profitability for last
three years |
Yes |
|
13] |
Reasons for variation
<> 20% |
-------------------- |
|
14] |
Estimation for coming
financial year |
No |
|
15] |
Capital in the business |
Yes |
|
16] |
Details of sister
concerns |
Yes |
|
17] |
Major suppliers |
No |
|
18] |
Major customers |
No |
|
19] |
Payments terms |
No |
|
20] |
Export / Import details
(if applicable) |
No |
|
21] |
Market information |
---------------------- |
|
22] |
Litigations that the firm
/ promoter involved in |
---------------------- |
|
23] |
Banking Details |
Yes |
|
24] |
Banking facility details |
Yes |
|
25] |
Conduct of the banking
account |
---------------------- |
|
26] |
Buyer visit details |
---------------------- |
|
27] |
Financials, if provided |
Yes |
|
28] |
Incorporation details, if
applicable |
Yes |
|
29] |
Last accounts filed at
ROC |
Yes |
|
30] |
Major Shareholders, if
available |
Yes |
|
31] |
Date of Birth of Proprietor/Partner/Director,
if available |
No |
|
32] |
PAN of
Proprietor/Partner/Director, if available |
No |
|
33] |
Voter ID No of
Proprietor/Partner/Director, if available |
No |
|
34] |
External Agency Rating,
if available |
Yes |
UNSECURED LOAN:
|
Particulars |
31.03.2013 [Rs.
in Millions] |
31.03.2012 [Rs.
in Millions] |
|
Short Term
Borrowing |
|
|
|
Loans from banks repayable on demand |
0.000 |
740.020 |
|
Short term loans from bank |
1175.000 |
740.000 |
|
Short term foreign currency loan from banks |
166.380 |
768.150 |
|
Short term loan from Schneider Electric IT Business India Private
Limited |
1000.000 |
0.000 |
|
|
|
|
|
Total |
2341.380 |
2248.170 |
INDEX OF CHARGES
No Charges Exist for Company
PERFORMANCE REVIEW
PERFORMANCE ANALYSIS
Despite challenging market conditions in 2012-13, The Company has shown resilience and a strong execution of its strategy in managing maintaining a leadership position in the medium voltage electrical infrastructure sector. The Infrastructure market overall has decreased in value as investment in key sectors such as Power Generation and Renewable have slowed down. Their orders have decreased by 7.7%. The order Intake rested at 13115 MINR compared to 14214 MINR last year. Their sales only decreased 2.8% thanks to a strong backlog, better execution and customer intimacy. The Sales valued at 13104 MINR compared to 13492 MINR in the previous year.
PERFORMANCE
HIGHLIGHTS
The Company has strengthened its position in the Infrastructure business as a key player with a strong portfolio of 'Smart' products and solutions. They have also worked for further collaboration with the Schneider Electric Group to both widen their scope of offer, market coverage and also apply best practices to improve efficiency and decrease costs.
The company continued its focus on innovation, customer satisfaction, strengthening the local manufacturing / R and D capabilities and has built a new factory at Poonamallee, Chennai for Energy Automation. The Company has won several prestigious contracts in Utility, Industry including in new segments like Transport, IT, Building etc. The Company is also involved in the execution of Smart Grid projects including the prestigious project
The operating performance of the business during the year has been stable. However, it has been impacted by separation and integration costs incurred as a result of the legal framework they operate in, as well as further provisioning of older receivables, whose recoverability in the current market environment has become more challenging.
They believe they have dealt with most of the major issues, however, some operational or separation steps may still be required as per the governance process or legal framework, and may necessitate further extraordinary expenses. involving an advanced distribution management system for Temple city Puri.
During the year, the company launched several initiatives on employee engagement, training and development, etc. to further improve employee competencies. The Company's energized and committed workforce is one of the most important assets that creates values for their customers and stake holders.
In a nutshell, the company continues to remain focused on generating sustainable and profitable growth for its shareholders, and would sincerely like to thank all the stake-holders, customers, and employees for their continued support and confidence in Schneider Electric Infrastructure Limited.
MANAGEMENT DISCUSSIONS
MARKET OVERVIEW
India is ranked as the fifth largest power producing and fifth largest power consuming country in the world (Source: IEA - Key World Energy Statistics, 2010).
Power generation capacity in India has increased substantially over recent years and as of October 31, 2011 India had a total installed capacity of 182,689.6 MW. The proposed capacity addition for power generation during the XI Five-year Plan (2007-12) is 78,700.4MW and tentative capacity addition of approximately 100,000 MW has been envisaged under the XII Five-year Plan (2012-17) (Source: CEA Monthly Review, October 2011). However, supply has not kept pace with the rapid growth of the Indian economy, despite relatively low per capita electricity consumption in comparison to other major economies.
OUTLOOK
The energy infrastructure market is on an upward trajectory. Power and Infrastructure sector continue to be a priority sector for the government. In view of Government of India’s announcement of increasing investments in the Infrastructure and the Industry segments, it is expected that the energy infrastructure market in India will double in the next five years. With the synergies accruing from its integration with Schneider Electric India, the company is in a perfect position to cater to Infrastructure market solutions leveraging on expertise in the field of Power, Infrastructure, Buildings, and Industry and IT businesses.
However there are many challenges which may impact the growth of the Company in the short run. To control the high inflation, RBI the central bank of India had followed a monetary policy of liquidity tightening and raising interest rates. Aggressive competition might put strong price pressure and affect profitability. Schneider Electric Infrastructure’s management team will remain completely focused to meet these challenges and continue to deliver the best value for its shareholders.
FIXED ASSETS:
œ Freehold Land
œ Leasehold Land
œ Buildings
œ Plant and Equipments
œ Furniture and Fixtures
œ Office Equipments
œ
Motor Vehicles
STATEMENT
OF UNAUDITED FINANCIAL RESULTS FOR THE QUARTER / NINE MONTHS ENDED
31ST
DECEMBER, 2013
|
|
|
Particulars |
Quarter Ended |
Nine
Month |
|
|
|
|
|
31.03.2014 |
31.12.2013 |
31.03.2014 |
|
1 |
Income
from Operations |
|
|
|
|
|
|
a) Net
Sales/Income from Operations (net of excise duty) |
2603.300 |
4138.600 |
12087.900 |
|
|
|
b) Other
Operating Income |
7.100 |
21.700 |
68.600 |
|
|
|
Total Income from Operations (Net) |
2610.400 |
4160.300 |
12156.500 |
|
|
2 |
Expenses |
|
|
|
|
|
|
a) |
Cost of
Materials consumed |
2012.600 |
2769.800 |
8817.600 |
|
|
b) |
Purchase
of stock in-trade |
0.000 |
-- |
-- |
|
|
c) |
Changes in
inventories of finished goods, work-in-progress and stock-in-trade |
(157.400) |
343.000 |
(120.800) |
|
|
d) |
Employee
benefit expenses |
345.400 |
380.500 |
1434.700 |
|
|
e) |
Depreciation
and amortization expense |
53.400 |
58.300 |
227.100 |
|
|
f) |
Other
expenses |
854.500 |
816.600 |
2864.200 |
|
|
Total Expenses |
3108.500 |
4368.200 |
13222.800 |
|
|
3 |
|
Profit
/(Loss) from operations before other income, finance costs and exceptional
items (1-2) |
(498.100) |
(207.900) |
(1066.300) |
|
4 |
Other
Income |
431.800 |
6.100 |
450.300 |
|
|
5 |
|
Profit /(Loss)
from ordinary activities before finance costs and exceptional items (3+4) |
(66.300) |
(201.800) |
(616.000) |
|
6 |
Finance
Costs |
77.800 |
62.400 |
260.300 |
|
|
7 |
|
Profit /(Loss)
from ordinary activities after finance costs but before exceptional items
(5-6) |
(144.100) |
(264.200) |
(876.300) |
|
8 |
Exceptional
Items |
214.000 |
159.000 |
373.000 |
|
|
9 |
Profit
/(Loss) from ordinary activities before tax |
(358.100) |
(423.200) |
(1249.300) |
|
|
10 |
Tax
Expense |
0.000 |
-- |
-- |
|
|
11 |
Net Profit
/(Loss) from ordinary activities after tax (9-10) |
(358.100) |
(423.200) |
(1249.300) |
|
|
12 |
Extraordinary
items (net of tax expense) |
0.000 |
-- |
-- |
|
|
13 |
Net Profit
/(Loss) for the period (11-12) |
(358.100) |
(423.200) |
(1249.300) |
|
|
14 |
Paid up
equity share capital (Eq. shares of
Rs.10/- each) |
478.200 |
478.200 |
478.200 |
|
|
15 |
Reserve
excluding revaluation reserves |
-- |
-- |
657.600 |
|
|
16 |
|
Earnings
per share (before/after extraordinary items) of Rs.10/- each |
|
|
|
|
|
|
Basic |
(1.50) |
(1.77) |
(5.22) |
|
|
|
Diluted |
(1.50) |
(1.77) |
(5.22) |
|
|
|||||
|
A |
|
PARTICULARS
OF SHAREHOLDING |
|
|
|
|
1 |
|
Public
Shareholding |
|
|
|
|
|
|
- No. of
Shares |
59776009 |
52296831 |
59776009 |
|
|
|
-
Percentage of Shareholding |
25.00 |
21.90 |
25.00 |
|
2 |
|
Promoters
and promoter group shareholding |
|
|
|
|
|
|
a)
Pledged/Encumbered |
|
|
|
|
|
|
- Number
of shares |
-- |
-- |
-- |
|
|
|
-
Percentage of shares ( as a % of the total shareholding of the promoter and
promoter group) |
-- |
-- |
-- |
|
|
|
-
Percentage of shares (as a % of the total share capital of the Company) |
-- |
-- |
-- |
|
|
|
b) Non- encumbered |
|
|
|
|
|
|
- Number
of shares |
179328026 |
186807204 |
179328026 |
|
|
|
-
Percentage of shares ( as a % of the total shareholding of the promoter and
promoter group) |
100.00 |
100.00 |
100.00 |
|
|
|
- Percentage
of shares (as a % of the total share capital of the Company) |
75.00 |
78.10 |
75.00 |
|
|
Particulars |
Quarter
ended 31.12.2013 |
|
|
B |
|
Investor
Complaints |
|
|
|
|
Pending at
the beginning of the quarter |
-- |
|
|
|
Received
during the quarter |
1 |
|
|
|
Disposed
during the quarter |
1 |
|
|
|
Remaining
unresolved at the end of the quarter |
-- |
STANDALONE
STATEMENT OF ASSETS AND LIABILITIES
(Rs.
In Millions)
|
Particular |
31.03.2014 |
|
EQUITY AND
LIABILITIES |
|
|
Shareholders’
funds |
|
|
(a) Share capital |
478.200 |
|
(b) Reserves and surplus |
657.600 |
|
Sub-total
- Shareholders' funds |
1135.800 |
|
|
|
|
Non-current
liabilities |
|
|
(a) Long-term borrowings |
1900.000 |
|
(b) Deferred Tax Liabilities (Net) |
0.000 |
|
(c) Other Long Term Liability |
0.000 |
|
(d) Long Term Provision |
428.300 |
|
Sub-total
- Non-current liabilities |
2328.300 |
|
|
|
|
Current
liabilities |
|
|
(a) Short -term borrowings |
696.600 |
|
(b) Trade payables |
6522.700 |
|
(c) Other Current Liability |
1725.800 |
|
(d) Short-term provision |
157.100 |
|
Sub-total
- Current liabilities |
9102.200 |
|
|
|
|
TOTAL
- EQUITY AND LIABILITIES |
12566.300 |
|
|
|
|
ASSETS |
|
|
Non-current
assets |
|
|
(a) Fixed assets |
1946.400 |
|
(b) Deferred tax Assets (net) |
114.200 |
|
(c) Trade Receivable |
402.900 |
|
(d) Long-term loans and advances |
224.800 |
|
Sub-total
- Non-current assets Current assets |
2688.300 |
|
Current assets |
|
|
(a) Inventories |
1799.300 |
|
(b) Trade receivables |
6811.000 |
|
(c) Cash and cash equivalents |
11.200 |
|
(d) Short-term loans and advances |
916.800 |
|
(e) Other current assets |
339.700 |
|
Sub-total
- Current assets |
9878.000 |
|
|
|
|
TOTAL
- ASSETS |
12566.300 |
NOTE:
- The above Financial Results were reviewed by the Audit Committee and taken on record by the Board of Directors at the meeting held on May 22, 20
- The Company had entered into transactions of purchase and sale of goods and availing and rendering of services with a company covered under section 297 of the Companies Act, 1956. The Company has received approval from Central Government for goods transactions starting from March 6 2013 and services transactions starting April 1, 2013. Pending Government approval on compounding the goods transactions prior March 6 2013 and services transaction prior April 1, 2013, no adjustments have been considered in financial results as Management is of the view that it will not have any material impact on the results. Auditors have also drawn attention on this matter in their audit report and their opinion is not qualified In respect of this matte
- The Company has only one business segment. i.e. business relating to product and systems for electricity distributors, and accordingly disclose requirements as per accounting standard - 17 on Segment Reporting are not applicable.
- In order to achieve minimum 25% public shareholding in the Company in terms of Rule 19(2)(b) and 19A of the Securities Contracts (Regulation) Rules, 1957, read with Clause 40A (14) (c) of the Listing Agreement, Energy Grid Automation Transformers and Switchgears India Limited (promoter) sold 7,479,178 equity shares of the Company (3.13%) in the secondary market by way of "Offer for Sale" of shares through the Stock exchange mechanism in the month of January,
- Exceptional items represent cost incurred on account of rationalization of Company's transformer business in respect of Nalni Unit.
- Other Income includes subvention received from corporate for operational financial support – Rs. 421.200 Millions
- The figures of the last quarter are the balancing figures between audited figures in respect of the full financial year up to March 31, 2014 and the unaudited published year-to-date figures up to December 31, 2013, being the date of the end of the third quarter of year which were subject to limited review.
- Prior period figures have been reclassified / regrouped wherever necessary for comparative purposes.
PRESS RELEASES
Schneider Electric says will remain focused on India
French major sees opportunity in dismal distribution network
June 7, 2014
Schneider Electric Infrastructure, part of the euro 24-billion French Schneider Electric Group, wants to remain focused on high-end power distribution equipment and solutions in India. The company sees an opportunity in the high transmission and distribution (T&D) losses in India.
“A third of the energy in India is wasted in T&D losses,” Prakash
Chandraker, vice-president and managing director of infrastructure business at
Schneider Electric Infrastructure said.
Chandraker refused to share or give any indication of the outlook on the
company’s India revenues in the current year or its plan to add manpower in the
country.
He said the company’s interest was backed by government policies aimed at
deploying smart-grid solutions to bring down losses. The company, in India for
50 years, is providing smart-grid solutions in Bihar, Kerala, Jammu and Kashmir
and Odisha.
The company supplies medium voltage switch gear and transformers apart from
digitised substations, network automation systems and renewable integration
systems.
Schneider Electric employs 29,000 in 33 factories in India. Chandraker said the
company had added enough capacity for expansion. “Most investment required for
hardware has been done. We are investing in integration capabilities on the
smart-grid side.”
Chandraker said there were no constraints for growth “but some policy change is
required for demand growth. We see there is potential to reduce losses by 10 to
15 per cent.” He added the company saw opportunity also because of the new
government’s 10-point agenda that focused on energy.
Volumes
jump at Schneider Electric Infrastructure counter
June 5, 2014
Praj Industries, Edelweiss Financial Services, Havells India and Greaves Cotton are among the other stocks to see a surge in
volumes on BSE today, 5 June 2014.
Schneider Electric Infrastructure clocked volume of 9.02 lakh shares by
13:43 IST on BSE, a 28.51-times surge over two-week average daily volume of
32,000 shares. The stock lost 1.1% at Rs 121.90.
Praj Industries notched up volume of 2 crore shares, a 28.32-fold surge
over two-week average daily volume of 7.10 lakh shares. The stock tumbled 5.18%
at Rs 73.20.
Edelweiss Financial Services saw volume of 1.65 crore shares, a
24.61-fold surge over two-week average daily volume of 6.71 lakh shares. The
stock surged 8.28% at Rs 58.20
.
Havells India clocked volume of 6.74 lakh shares, a 19.71-fold
surge over two-week average daily volume of 34,000 shares. The stock jumped
9.22% at Rs 1161.
Greaves Cotton saw volume of 12.22 lakh shares, a 13.01-fold rise over
two-week average daily volume of 94,000 shares. The stock rose 6.28% at Rs 105.
CMT REPORT (Corruption, Money Laundering and Terrorism]
The Public Notice information has been collected from various sources
including but not limited to: The Courts,
1] INFORMATION ON
DESIGNATED PARTY
No exist designating subject or any of its beneficial owners, controlling
shareholders or senior officers as terrorist or terrorist organization or whom
notice had been received that all financial transactions involving their assets
have been blocked or convicted, found guilty or against whom a judgement or
order had been entered in a proceedings for violating money-laundering,
anti-corruption or bribery or international economic or anti-terrorism sanction
laws or whose assets were seized, blocked, frozen or ordered forfeited for
violation of money laundering or international anti-terrorism laws.
2] Court Declaration :
No exist to suggest that subject is or was
the subject of any formal or informal allegations, prosecutions or other
official proceeding for making any prohibited payments or other improper payments
to government officials for engaging in prohibited transactions or with
designated parties.
3] Asset Declaration :
No records exist to suggest that the property or assets of the subject
are derived from criminal conduct or a prohibited transaction.
4] Record on Financial
Crime :
Charges or conviction
registered against subject: None
5] Records on Violation of
Anti-Corruption Laws :
Charges or
investigation registered against subject: None
6] Records on Int’l
Anti-Money Laundering Laws/Standards :
Charges or
investigation registered against subject: None
7] Criminal Records
No
available information exist that suggest that subject or any of its principals
have been formally charged or convicted by a competent governmental authority for
any financial crime or under any formal investigation by a competent government
authority for any violation of anti-corruption laws or international anti-money
laundering laws or standard.
8] Affiliation with
Government :
No record
exists to suggest that any director or indirect owners, controlling
shareholders, director, officer or employee of the company is a government
official or a family member or close business associate of a Government
official.
9] Compensation Package :
Our market
survey revealed that the amount of compensation sought by the subject is fair
and reasonable and comparable to compensation paid to others for similar
services.
10] Press Report :
No press reports / filings exists on
the subject.
CORPORATE GOVERNANCE
MIRA INFORM as part of its Due Diligence do provide comments on
Corporate Governance to identify management and governance. These factors often
have been predictive and in some cases have created vulnerabilities to credit
deterioration.
Our Governance Assessment focuses principally on the interactions
between a company’s management, its Board of Directors, Shareholders and other
financial stakeholders.
CONTRAVENTION
Subject is not known to have contravened any existing local laws,
regulations or policies that prohibit, restrict or otherwise affect the terms
and conditions that could be included in the agreement with the subject.
FOREIGN EXCHANGE RATES
|
Currency |
Unit
|
Indian Rupees |
|
US Dollar |
1 |
Rs.59.06 |
|
|
1 |
Rs.99.35 |
|
Euro |
1 |
Rs.80.62 |
INFORMATION DETAILS
|
Information
Gathered by : |
NYA |
|
|
|
|
Analysis done by
: |
SUB |
|
|
|
|
Report Prepared
by : |
ANK |
SCORE and RATING EXPLANATIONS
|
SCORE FACTORS |
RANGE |
POINTS |
|
HISTORY |
1~10 |
5 |
|
PAID-UP CAPITAL |
1~10 |
5 |
|
OPERATING SCALE |
1~10 |
5 |
|
FINANCIAL CONDITION |
|
|
|
--BUSINESS SCALE |
1~10 |
5 |
|
--PROFITABILIRY |
1~10 |
4 |
|
--LIQUIDITY |
1~10 |
5 |
|
--LEVERAGE |
1~10 |
4 |
|
--RESERVES |
1~10 |
6 |
|
--CREDIT LINES |
1~10 |
5 |
|
--MARGINS |
-5~5 |
-- |
|
DEMERIT POINTS |
|
|
|
--BANK CHARGES |
YES/NO |
YES |
|
--LITIGATION |
YES/NO |
NO |
|
--OTHER ADVERSE INFORMATION |
YES/NO |
NO |
|
MERIT POINTS |
|
|
|
--SOLE DISTRIBUTORSHIP |
YES/NO |
NO |
|
--EXPORT ACTIVITIES |
YES/NO |
YES |
|
--AFFILIATION |
YES/NO |
YES |
|
--LISTED |
YES/NO |
YES |
|
--OTHER MERIT FACTORS |
YES/NO |
NO |
|
DEFAULTER |
|
|
|
--RBI |
YES/NO |
NO |
|
--EPF |
YES/NO |
NO |
|
TOTAL |
|
42 |
This score serves as a reference to assess SC’s
credit risk and to set the amount of credit to be extended. It is calculated
from a composite of weighted scores obtained from each of the major sections of
this report. The assessed factors and their relative weights (as indicated
through %) are as follows:
Financial
condition (40%) Ownership
background (20%) Payment
record (10%)
Credit history
(10%) Market trend (10%) Operational size
(10%)
RATING EXPLANATIONS
|
RATING |
STATUS |
PROPOSED CREDIT LINE |
|
|
>86 |
Aaa |
Possesses an extremely sound financial base with the strongest
capability for timely payment of interest and principal sums |
Unlimited |
|
71-85 |
Aa |
Possesses adequate working capital. No caution needed for credit
transaction. It has above average (strong) capability for payment of interest
and principal sums |
Large |
|
56-70 |
A |
Financial and operational base are regarded healthy. General
unfavourable factors will not cause fatal effect. Satisfactory capability for
payment of interest and principal sums |
Fairly Large |
|
41-55 |
Ba |
Overall operation is considered normal. Capable to meet normal
commitments. |
Satisfactory |
|
26-40 |
B |
Capability to overcome financial difficulties seems comparatively below
average. |
Small |
|
11-25 |
Ca |
Adverse factors are apparent. Repayment of interest and principal sums
in default or expected to be in default upon maturity |
Limited with
full security |
|
<10 |
C |
Absolute credit risk exists. Caution needed to be exercised |
Credit not
recommended |
|
-- |
NB |
New Business |
-- |
This report is issued at your request without any
risk and responsibility on the part of MIRA INFORM PRIVATE LIMITED (MIPL) or
its officials.