1. Summary Information
|
Country |
India |
||
|
Company Name |
Varun Shipping Company Limited |
Principal Name 1 |
Mr. Yudhishthir D. Khatau |
|
Status |
Moderate |
Principal Name 2 |
Mr. C. M. Maniar |
|
Registration # |
11-14985 |
||
|
Street Address |
Laxmi Building, 6, Shoorji Vallabhdas
Marg, Ballard Estate, Mumbai – 400001, Maharashtra, India |
||
|
Established Date |
29.01.1971 |
SIC Code |
-- |
|
Telephone# |
91-22-66350100-109 |
Business Style 1 |
Business of Shipping and Ship Management Activities. |
|
Fax # |
91-22-66350274/ 280 |
Business Style 2 |
-- |
|
Homepage |
Product Name 1 |
-- |
|
|
# of employees |
Information declined by management. |
Product Name 2 |
-- |
|
Paid up capital |
Rs.1500,078,000/- |
Product Name 3 |
-- |
|
Shareholders |
Total
shareholding of Promoter and Promoter Group- 37.79%, Total Public
shareholding- 2.21% |
Banking |
State Bank of India |
|
Public Limited Corp. |
Yes |
Business Period |
43 years |
|
IPO |
Yes |
International Ins. |
-- |
|
Public |
Yes |
Rating |
Ca (21) |
|
Related Company |
|||
|
Relation
|
Country |
Company
Name |
CEO |
|
Associates
|
-- |
Varun Asia Pte. Limited |
-- |
|
Note |
-- |
||
2. Summary
Financial Statement
|
Balance Sheet as of |
30.09.2012 (18 Months) |
(Unit: Indian Rs.) |
|
|
Assets |
Liabilities |
||
|
Current Assets |
19,844,018,000 |
Current Liabilities |
10,071,451,000 |
|
Inventories |
76,177,000 |
Long-term Liabilities |
8,172,205,000 |
|
Fixed Assets |
6,532,810,000 |
Other Liabilities |
860,404,000 |
|
Deferred Assets |
0,000 |
Total Liabilities |
19,104,060,000 |
|
Invest& other Assets |
1,075,124,000 |
Retained Earnings |
6,923,991,000 |
|
|
|
Net Worth |
8,424,069,000 |
|
Total Assets |
27,528,129,000 |
Total Liab. & Equity |
27,528,129,000 |
|
Total Assets (Previous Year) |
38,467,782,000 |
|
|
|
P/L Statement as of |
30.09.2012 (18 Months) |
(Unit: Indian Rs.) |
|
|
Sales |
4655,023,000 |
Net Profit |
383,654,000 |
|
Sales(Previous yr) |
4914,266,000 |
Net Profit(Prev.yr) |
168,219,000 |
MIRA INFORM REPORT
|
Report Date : |
10.06.2014 |
IDENTIFICATION DETAILS
|
Name : |
VARUN SHIPPING COMPANY LIMITED |
|
|
|
|
Registered
Office : |
Laxmi Building, 6, Shoorji Vallabhdas Marg, Ballard Estate, Mumbai –
400001, Maharashtra |
|
|
|
|
Country : |
|
|
|
|
|
Financials (as
on) : |
30.09.2012 (18 Months) |
|
|
|
|
Date of
Incorporation : |
29.01.1971 |
|
|
|
|
Com. Reg. No.: |
11-14985 |
|
|
|
|
Capital
Investment / Paid-up Capital : |
Rs.1500.078 Millions |
|
|
|
|
CIN No.: [Company Identification
No.] |
L61100MH1971PLC014985 |
|
|
|
|
TAN No.: [Tax Deduction &
Collection Account No.] |
MUMV00108D/ MUMV06824G/ MUMV07841B |
|
|
|
|
PAN No.: [Permanent Account No.] |
AAACV1658C |
|
|
|
|
Legal Form : |
A Public Limited Liability Company. The Company’s Shares are Listed on
the Stock Exchange. |
|
|
|
|
Line of Business
: |
Subject is
primarily engaged in the business of shipping and ship management activities.
|
|
|
|
|
No. of Employees
: |
Information declined by management. |
RATING & COMMENTS
|
MIRA’s Rating : |
Ca (21) |
|
RATING |
STATUS |
PROPOSED CREDIT LINE |
|
|
11-25 |
Ca |
Adverse factors are apparent. Repayment of interest and principal sums
in default or expected to be in default upon maturity |
Limited with
full security |
|
Status : |
Moderate |
|
|
|
|
Payment Behaviour : |
Slow |
|
|
|
|
Litigation : |
Exist |
|
|
|
|
Comments : |
Subject is a well-established company having moderate track. The management has not filed the latest financials of September, 2013,
as the company in its meeting has extended its financial year from September
30, 2013 to March 31, 2014 with due approval from the Registrar of companies.
Further, the company possesses a weak financial profile marked by
stretched liquidity position due to bad loans and has restructured nearly
2000 crore of debt in 2012. As per the reports from indirect sources, the company has reported a
net loss from its operations during FY 14. The ratings also take into consideration the loosing of subjects
license to operate ships after it failed to carry out a mandatory check of
its ships and pay wage arrears to its crew. However, business is active. Payment terms are reported as slow. In view of consolidated financial stress faced by the management, the
subject can be considered for business dealings on a safe and secured trade
terms and conditions. |
NOTES:
Any query related to this report can be made
on e-mail : infodept@mirainform.com
while quoting report number, name and date.
ECGC Country Risk Classification List – March 31, 2014
|
Country Name |
Previous Rating (31.12.2013) |
Current Rating (31.03.2014) |
|
India |
A1 |
A1 |
|
Risk Category |
ECGC
Classification |
|
Insignificant |
A1 |
|
Low |
A2 |
|
Moderate |
B1 |
|
High |
B2 |
|
Very High |
C1 |
|
Restricted |
C2 |
|
Off-credit |
D |
INDIAN ECONOMIC OVERVIEW
US investment bank
Goldman Sachs has upgraded its outlook on Indian markets as it expects positive
impact of the election cycle.
India’s economy may
grow 4.7 % in the current financial year, lower than the official estimate of
4.9 %, Fitch Rating said. The global rating agency expects the economy to pick
up in the next two financial years.
Global ratings
agency Standard & Poor said increasing focus by India Inc on lowering debt
is likely to improve their credit profiles.
Singapore (1.1
million Indian tourists in 2012), Thailand (one million), the United Arab
Emirates ().98 million) and Malaysia ().82 million) emerged as the preferred
holidays hotspots for Indians. The total figure is expected to increase to 1.93
million by 2017, according to the latest Eurmonitor international report.
There is a $29.34 bn
outward foreign direct investment by domestic companies between April and
January of 2013/14 which has seen some signs of recovery according to a Care
Ratings report.
There are 264 number
of new companies being set up every day on average during 2014. Most of them
are registered in Mumbai. India had 1.38 million registered companies at the
end of January, 2014.
Twitter like
messaging service Weibo Corporation has filed to raise $ 500 million via a US
initial public offering. Alibaba, which owns a stake in Weibo is expected to
raise about $ 15 billion New York this year in the highest profile Internet IPO
since Facebook’s in 2012.
Bharti Airtel has
raised Rs.2,453.2 crore (350 million Swiss Francs) by selling six-year bonds at
a coupon rate of three per cent and maturing in 2020. This is the largest ever
bond offering by an Indian company in Swiss Francs. Bharat Petroleum
Corporation raised 175 million Swiss Francs by selling five year bonds at 2.98
% coupon rate in February.
Indian Oil
Corporation plans to invest Rs.7650 crore in setting up a petrochemical complex
at its almost complete Paradip refinery in Odhisha in three to four years. The
company board is set to consider the setting up of a 700000 tonne per annum
polypropylene plant at an estimated cost at Rs.3150 crore.
Global chief
information officers at gathering in Bangalore in April to meet Indian startups
at an event called Tech50 Watchout for Little Eye Labs-Facebook type deals in
the making.
EXTERNAL AGENCY RATING
|
Rating Agency Name |
India Ratings and Research |
|
Rating |
Long Term Rating: BBB+ (Withdrawn) |
|
Rating Explanation |
Moderate degree of safety and moderate
credit risk. |
|
Date |
13.07.2012 |
|
Rating Agency Name |
India Ratings and Research |
|
Rating |
Short Term Rating: A2 (Withdrawn) |
|
Rating Explanation |
Strong degree of safety and low credit. |
|
Date |
13.07.2012 |
RBI DEFAULTERS’ LIST STATUS
Subject’s name is not enlisted as a defaulter in
the publicly available RBI Defaulters’ list.
EPF (Employee Provident Fund) DEFAULTERS’ LIST STATUS
Subject’s name is not enlisted as a defaulter
in the publicly available EPF (Employee Provident Fund) Defaulters’ list as of
31-03-2012.
INFORMATION DECLINED
MANAGEMENT NON CO-OPERATIVE
Contact No.: 91-22-66350128
LOCATIONS
|
Registered Office : |
Laxmi Building, 6, Shoorji Vallabhdas Marg, Ballard Estate, Mumbai -
400001, Maharashtra, India |
|
Tel. No.: |
91-22-66350100-109 |
|
Fax No.: |
91-22-66350274/ 280 |
|
|
|
|
Web site: |
|
|
|
|
|
Branches: |
5, |
|
Tel. No.: |
65-62211290 |
|
Fax No.: |
65-62213915 |
DIRECTORS
(AS ON 30.09.2012)
|
Name : |
Mr. Yudhishthir D. Khatau |
|
Designation : |
Chairman and Managing Director |
|
|
|
|
Name : |
Mr. C. M. Maniar |
|
Designation : |
Director |
|
|
|
|
Name : |
Mr. Praveen Singh |
|
Designation : |
Director |
|
|
|
|
Name : |
Dr. A. K. Bhattacharya |
|
Designation : |
Director |
|
|
|
|
Name : |
Mr. Khurshed M. Thanawalla |
|
Designation : |
Director |
KEY EXECUTIVES
|
Name : |
Ms. Manali Parekh |
|
Designation : |
Vice President – Corporate Affairs and Company Secretary. |
MAJOR SHAREHOLDERS / SHAREHOLDING PATTERN
(AS ON 31.03.2014)
|
Category of Shareholder |
Total No. of Shares |
Total Shareholding as a % of Total No. of Shares |
|
(A) Shareholding of Promoter and Promoter
Group |
|
|
|
|
|
|
|
|
23341562 |
15.56 |
|
|
23341562 |
15.56 |
|
|
|
|
|
|
|
|
|
|
33350000 |
22.23 |
|
|
33350000 |
22.23 |
|
|
|
|
|
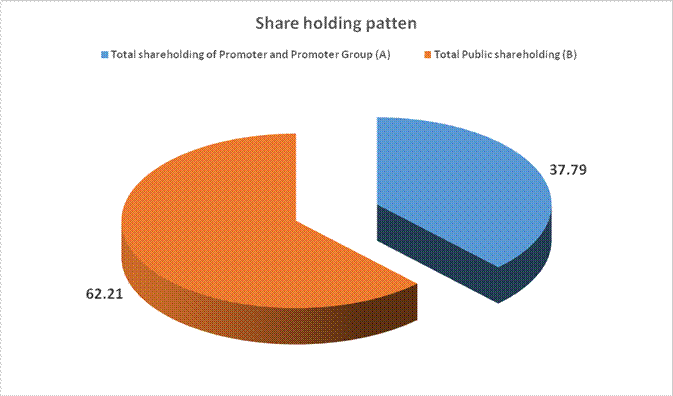
Total shareholding of Promoter and Promoter
Group (A) |
56691562 |
37.79 |
|
|
|
|
|
(B) Public Shareholding |
|
|
|
|
|
|
|
|
11010 |
0.01 |
|
|
3400 |
0.00 |
|
|
1500000 |
1.00 |
|
|
10050528 |
6.70 |
|
|
223931 |
0.15 |
|
|
11788869 |
7.86 |
|
|
|
|
|
|
|
|
|
|
6580175 |
4.39 |
|
|
|
|
|
|
|
|
|
|
38719907 |
25.81 |
|
|
19613551 |
13.08 |
|
|
16613709 |
11.08 |
|
|
4989577 |
3.33 |
|
|
150 |
0.00 |
|
|
1213 |
0.00 |
|
|
11622769 |
7.75 |
|
|
81527342 |
54.35 |
|
|
|
|
|
Total Public shareholding (B) |
93316211 |
62.21 |
|
|
|
|
|
Total (A)+(B) |
150007773 |
100.00 |
|
|
|
|
|
(C) Shares held by Custodians and against
which Depository Receipts have been issued |
|
|
|
|
0 |
0.00 |
|
|
0 |
0.00 |
|
|
0 |
0.00 |
|
|
|
|
|
Total (A)+(B)+(C) |
150007773 |
100.00 |
BUSINESS DETAILS
|
Line of Business : |
Subject is
primarily engaged in the business of shipping and ship management activities. |
GENERAL INFORMATION
|
No. of Employees : |
Information declined by management. |
||||||||||||||||||||||||||||||||||||||||||||||||
|
|
|
||||||||||||||||||||||||||||||||||||||||||||||||
|
Bankers : |
· State Bank of India Madame Cama Road, Mumbai - 400001, Maharashtra, India ·
Bank of · Axis Bank Limited · ICICI Bank Limited |
||||||||||||||||||||||||||||||||||||||||||||||||
|
|
|
||||||||||||||||||||||||||||||||||||||||||||||||
|
Facilities : |
|
||||||||||||||||||||||||||||||||||||||||||||||||
|
|
|
|
Banking
Relations : |
-- |
|
|
|
|
Auditors : |
|
|
Name : |
Messrs Sorab S. Engineer and Company Chartered Accountant |
|
Address : |
|
|
|
|
|
Wholly
Owned Subsidiary : |
· Varun Cyprus Limited · Varun Gas Infrastructure Limited · Varun Resources Private Limited · Varun Global Private Limited |
|
|
|
|
Associate
Companies : |
· VSC International Pte. Limited · Tarun Shipping and Industries Limited · Varun Asia Pte. Limited · Ocean Race Shipping Company Limited · Sea Fidelity Shipping Company Limited |
|
|
|
|
Companies with
which transactions have taken place during the period : |
·
Varun Corporation Limited ·
Realpoint (Mauritius) Limited |
|
|
|
|
Companies with which
no transactions have taken place during the period: |
·
Sunbeam Talc Private Limited ·
Yuka Plantations Private Limited |
CAPITAL STRUCTURE
(AS ON 30.09.2012)
Authorised Capital :
|
No. of Shares |
Type |
Value |
Amount |
|
|
|
|
|
|
300000000 |
Equity Share |
Rs.10/- each |
Rs.3000.000 Millions |
|
2000000 |
Preference Shares |
Rs.100/- each |
Rs.200.000
Millions |
|
|
|
|
|
|
|
|
Total |
Rs.3200.000
Millions |
Issued, Subscribed & Paid-up Capital :
|
No. of Shares |
Type |
Value |
Amount |
|
|
|
|
|
|
150007773 |
Equity Share |
Rs.10/- each |
Rs.1500.078 Millions |
|
|
|
|
|
Reconciliation of
number of shares outstanding at the beginning and end of the year
|
Particulars |
As at 30.09.2012 |
|
|
No. of Shares |
Rs. In millions |
|
|
|
|
|
|
Shares outstanding at the beginning of the year |
150,007,773 |
1500.078 |
|
Shares Issued during the year |
-- |
-- |
|
Shares bought back during the year |
-- |
-- |
|
Shares outstanding at the end of the year |
150,007,773 |
1500.078 |
Rights, Preferences
and Restrictions attached to Shares
The Company has
one class of shares referred to as equity shares having a par value of Rs.10
each. Each shareholder is entitled to one vote per share held. In the event of
liquidation, the equity shareholders are eligible to receive the remaining
assets of the Company after distribution of all preferential amounts, in
proportion to their shareholding.
List of
shareholders holding more than 5% shares
|
Name of
Shareholder |
As at 30.09.2012 |
|
|
No. of Shares held |
% of Holding |
|
|
|
|
|
|
Varun
Corporation Limited |
8,308,401 |
5.54% |
|
Tarun Shipping
and Industries Limited |
15,033,161 |
10.02% |
|
Realpoint (Mauritius) Limited |
33,350,000 |
22.23% |
|
Caledonia
Investments plc. |
9,972,769 |
6.65% |
The Company has
neither issued any Bonus Shares nor bought back any Shares during the last 5
years.
Unpaid calls- As
per of the Company, no calls remain unpaid by the directors and officers of the
Company as on 30th September, 2012
As per records of the Company, no shares have been forfeited by the
Company during the year.
FINANCIAL DATA
[All figures are
in Rupees Millions]
ABRIDGED BALANCE
SHEET
|
SOURCES OF FUNDS |
30.09.2012 (18
Months) |
31.03.2011 |
31.03.2010 |
|
|
SHAREHOLDERS FUNDS |
|
|
|
|
|
1] Share Capital |
1500.078 |
1500.078 |
1500.078 |
|
|
2] Share Application Money |
0.000 |
0.000 |
0.000 |
|
|
3] Reserves & Surplus |
6923.991 |
6627.509 |
6619.506 |
|
|
4] (Accumulated Losses) |
0.000 |
0.000 |
0.000 |
|
|
NETWORTH |
8424.069 |
8127.587 |
8119.584 |
|
|
LOAN FUNDS |
|
|
|
|
|
1] Secured Loans |
7683.657 |
19562.711 |
27018.454 |
|
|
2] Unsecured Loans |
488.548 |
696.500 |
375.000 |
|
|
TOTAL BORROWING |
8172.205 |
20259.211 |
27393.454 |
|
|
DEFERRED TAX LIABILITIES |
0.000 |
0.000 |
0.000 |
|
|
FINANCE LEASE PAYABLE |
638.299 |
615.836 |
20.473 |
|
|
FOREIGN CURRENCY MONETARY ITEM TRANSLATION DIFFERENCE |
0.000 |
0.000 |
52.614 |
|
|
|
|
|
|
|
|
TOTAL |
17234.573 |
29002.634 |
35586.125 |
|
|
|
|
|
|
|
|
APPLICATION OF FUNDS |
|
|
|
|
|
|
|
|
|
|
|
FIXED ASSETS [Net Block] |
6532.810 |
18923.043 |
29469.043 |
|
|
Capital work-in-progress |
0.000 |
0.000 |
0.000 |
|
|
|
|
|
|
|
|
FOREIGN CURRENCY MONETARY ITEM TRANSLATION DIFFERENCE |
9.241 |
0.000 |
0.000 |
|
|
FINANCE LEASE RECEIVABLE |
562.475 |
11462.366 |
0.000 |
|
|
INVESTMENT |
503.408 |
273.219 |
422.293 |
|
|
DEFERREX TAX ASSETS |
0.000 |
0.000 |
0.000 |
|
|
|
|
|
|
|
|
CURRENT ASSETS, LOANS & ADVANCES |
|
|
|
|
|
|
Inventories |
76.177
|
63.491 |
0.000 |
|
|
Sundry Debtors |
7831.614
|
1426.054 |
3319.240 |
|
|
Cash & Bank Balances |
3347.575
|
162.121 |
340.609 |
|
|
Other Current Assets |
1633.377
|
760.802 |
160.993 |
|
|
Loans & Advances |
7031.452
|
5396.686 |
3571.171 |
|
Total
Current Assets |
19920.195
|
7809.154 |
7392.013 |
|
|
Less : CURRENT
LIABILITIES & PROVISIONS |
|
|
|
|
|
|
Sundry Creditor |
3345.438
|
1921.818 |
871.266 |
|
|
Other Current Liabilities |
6726.013
|
7290.718 |
196.132 |
|
|
Provisions |
222.105
|
252.612 |
629.826 |
|
Total
Current Liabilities |
10293.556
|
9465.148 |
1697.224
|
|
|
Net Current Assets |
9626.639
|
(1655.994) |
5694.789
|
|
|
|
|
|
|
|
|
MISCELLANEOUS EXPENSES |
0.000 |
0.000 |
0.000 |
|
|
|
|
|
|
|
|
TOTAL |
17234.573 |
29002.634 |
35586.125 |
|
PROFIT & LOSS
ACCOUNT
|
|
PARTICULARS |
30.09.2012 (18
Months) |
31.03.2011 |
31.03.2010 |
|
|
|
SALES |
|
|
|
|
|
|
|
Revenue from Operations (Net) |
4655.023 |
4914.266 |
6662.227 |
|
|
|
Profit on sale of ships and other assets (Net) |
1386.268 |
3454.477 |
2304.240 |
|
|
|
Other Income |
1800.732 |
437.480 |
59.478 |
|
|
|
TOTAL (A) |
7842.023 |
8806.223 |
9025.945 |
|
|
|
|
|
|
|
|
Less |
EXPENSES |
|
|
|
|
|
|
|
Operating Costs |
2566.043 |
3334.623 |
|
|
|
|
Employee benefits Expense0073 |
1063.357 |
1070.944 |
4190.156 |
|
|
|
Other Expenses |
394.242 |
242.118 |
|
|
|
|
Extraordinary Items |
(1607.377) |
46.541 |
|
|
|
|
TOTAL (B) |
2416.265 |
4694.226 |
4190.156 |
|
|
|
|
|
|
|
|
Less |
PROFIT
BEFORE INTEREST, TAX, DEPRECIATION AND AMORTISATION (A-B) (C) |
5425.758 |
4111.997 |
4835.789 |
|
|
|
|
|
|
|
|
|
Less |
FINANCIAL
EXPENSES (D) |
3604.609 |
2164.853 |
1931.994 |
|
|
|
|
|
|
|
|
|
|
PROFIT
BEFORE TAX, DEPRECIATION AND AMORTISATION (C-D) (E) |
1821.149 |
1947.144 |
2903.795 |
|
|
|
|
|
|
|
|
|
Less/ Add |
DEPRECIATION/
AMORTISATION (F) |
1443.883 |
1778.925 |
2364.933 |
|
|
|
|
|
|
|
|
|
|
PROFIT BEFORE
TAX (E-F) (G) |
377.266 |
168.219 |
538.862 |
|
|
|
|
|
|
|
|
|
Less |
TAX (H) |
(6.388) |
20.743 |
413.333 |
|
|
|
|
|
|
|
|
|
|
PROFIT AFTER TAX
(G-H) (I) |
383.654 |
147.476 |
125.529 |
|
|
|
|
|
|
|
|
|
Add |
PREVIOUS
YEARS’ BALANCE BROUGHT FORWARD |
NA |
NA |
949.334 |
|
|
|
|
|
|
|
|
|
Less |
APPROPRIATIONS |
|
|
|
|
|
|
|
Dividend and tax on distributed profits of
previous year |
NA |
NA |
0.007 |
|
|
|
Proposed final dividend equity shares |
NA |
NA |
120.006 |
|
|
|
Tax on proposed final equity dividend |
NA |
NA |
19.932 |
|
|
BALANCE CARRIED
TO THE B/S |
NA |
NA |
934.918 |
|
|
|
|
|
|
|
|
|
|
Earnings Per
Share (Rs.) |
2.56 |
0.98 |
0.84 |
|
KEY RATIOS
|
PARTICULARS |
|
30.09.2012 (18
Months) |
31.03.2011 |
31.03.2010 |
|
PAT / Total Income |
(%) |
4.89
|
1.67 |
|
|
|
|
|
|
|
|
Net Profit Margin (PBT/Sales) |
(%) |
8.10
|
3.42 |
8.09 |
|
|
|
|
|
|
|
Return on Total Assets (PBT/Total Assets} |
(%) |
1.43
|
0.63 |
1.46 |
|
|
|
|
|
|
|
Return on Investment (ROI) (PBT/Networth) |
|
0.04
|
0.02 |
0.07 |
|
|
|
|
|
|
|
Debt Equity Ratio (Total Debt/Networth) |
|
0.97
|
2.49 |
3.37 |
|
|
|
|
|
|
|
Current Ratio (Current Asset/Current Liability) |
|
1.94
|
0.83 |
4.36 |
FINANCIAL ANALYSIS
[All figures are
in Rupees Millions]
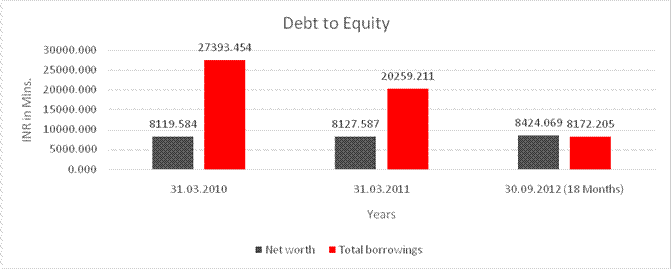
DEBT EQUITY RATIO
|
Particular |
31.03.2010 |
31.03.2011 |
30.09.2012 (18 Months) |
|
|
(INR in Mlns.) |
(INR in Mlns.) |
(INR in Mlns.) |
|
Share Capital |
1500.078 |
1500.078 |
1500.078 |
|
Reserves & Surplus |
6619.506 |
6627.509 |
6923.991 |
|
Net worth |
8119.584 |
8127.587 |
8424.069 |
|
|
|
|
|
|
long-term borrowings |
27018.454 |
19562.711 |
7683.657 |
|
Short term borrowings |
375.000 |
696.500 |
488.548 |
|
Total borrowings |
27393.454 |
20259.211 |
8172.205 |
|
Debt/Equity ratio |
3.374 |
2.493 |
0.970 |
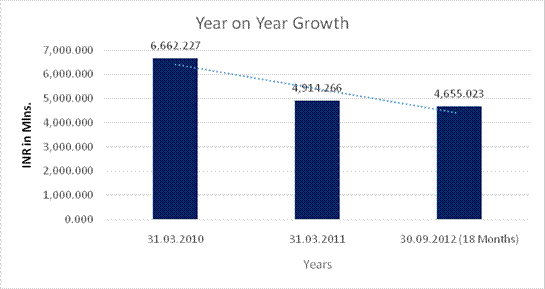
YEAR-ON-YEAR GROWTH
|
Year on Year Growth |
31.03.2010 |
31.03.2011 |
30.09.2012 (18 Months) |
|
|
(INR in Mlns) |
(INR in Mlns) |
(INR in Mlns) |
|
Revenue
from Operations |
6,662.227 |
4,914.266 |
4,655.023 |
|
|
|
(26.237) |
(5.275) |
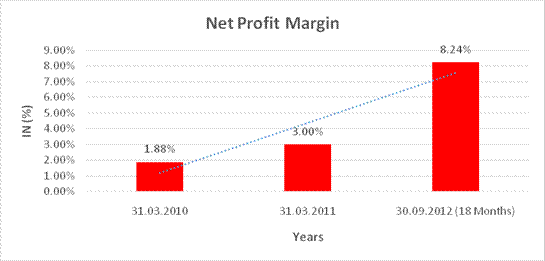
NET PROFIT MARGIN
|
Net Profit Margin |
31.03.2010 |
31.03.2011 |
30.09.2012 (18 Months) |
|
|
(INR in Mlns) |
(INR in Mlns) |
(INR in Mlns) |
|
Revenue
from Operations |
6,662.227 |
4,914.266 |
4,655.023 |
|
Profit |
125.529 |
147.476 |
383.654 |
|
|
1.88% |
3.00% |
8.24% |
LOCAL AGENCY FURTHER INFORMATION
|
Sr. No. |
Check List by Info Agents |
Available in Report (Yes / No) |
|
1] |
Year of Establishment |
Yes |
|
2] |
Locality of the firm |
Yes |
|
3] |
Constitutions of the firm |
Yes |
|
4] |
Premises details |
No |
|
5] |
Type of Business |
Yes |
|
6] |
Line of Business |
Yes |
|
7] |
Promoter's background |
Yes |
|
8] |
No. of employees |
No |
|
9] |
Name of person contacted |
No |
|
10] |
Designation of contact person |
No |
|
11] |
Turnover of firm for last three years |
Yes |
|
12] |
Profitability for last three years |
Yes |
|
13] |
Reasons for variation <> 20% |
----- |
|
14] |
Estimation for coming financial year |
No |
|
15] |
Capital in the business |
Yes |
|
16] |
Details of sister concerns |
Yes |
|
17] |
Major suppliers |
No |
|
18] |
Major customers |
No |
|
19] |
Payments terms |
No |
|
20] |
Export / Import details (if applicable) |
No |
|
21] |
Market information |
----- |
|
22] |
Litigations that the firm / promoter
involved in |
Yes |
|
23] |
Banking Details |
Yes |
|
24] |
Banking facility details |
Yes |
|
25] |
Conduct of the banking account |
----- |
|
26] |
Buyer visit details |
----- |
|
27] |
Financials, if provided |
Yes |
|
28] |
Incorporation details, if applicable |
Yes |
|
29] |
Last accounts filed at ROC |
Yes |
|
30] |
Major Shareholders, if available |
Yes |
|
31] |
Date of Birth of
Proprietor/Partner/Director, if available |
No |
|
32] |
PAN of Proprietor/Partner/Director, if
available |
No |
|
33] |
Voter ID No of Proprietor/Partner/Director,
if available |
No |
|
34] |
External Agency Rating, if available |
Yes |
------------------------------------------------------------------------------------------------------------------------------
HIGH COURT OF BOMBAY
|
CASE DETAILS |
|||||||
|
Bench:- Bombay Presentation Date: 26.02.2014 |
|||||||
|
Lodging No. : |
ARBPL/366/2014 |
Failing Date:- |
26.02.2014 |
|
|
|
|
|
Petitioner:- |
L and T Finance Limited - |
Respondent:- |
Varun Shipping Company Limited |
||||
|
Petn.Adv:- |
S. I. Joshi and Company (50) |
Resp. Adv.: |
Crawford Bayley and Company (I1491) |
||||
|
District:- |
MUMBAI |
||||||
|
Bench:- |
SINGLE |
Category:- |
Arbitration Act. |
||||
|
Status:- |
Pre-Admission |
Stage:- |
ARBP for Admission U/s – Fresh |
||||
|
Next Date |
02/07/2014 |
|
|
||||
|
Coram: |
Hon’ble Shri Justice S. Gupte |
|
|
||||
|
Last Date:- |
21/03/2014 |
Stage : |
ARBP for Admission U/s – Fresh |
||||
|
Last Coram |
Hon’ble Shri Justice S. Gupte |
|
|
||||
|
|
|||||||
|
Act. : |
Arbitration and Conciliation Act 1996 |
Under Section : 9 |
|||||
------------------------------------------------------------------------------------------------------------------------------
OPERATIONS
The Directors have recommended payment of dividend of Rs.0.50 per equity share for the 18 months period ended 30th September, 2012, which will absorb Rs.75.000 millions. Additional amount of Rs.12.170 millions will be absorbed towards dividend distribution tax. After the above appropriations, the directors propose to carry forward a balance of ` 1,239.40 million in the Profit and Loss Account.
Freight and charter hire income for the 18 months period ended 30th September, 2012 was Rs.4655.020 millions compared to Rs.4914.270 millions for the year ended 31st March, 2011. Profit before tax was ` 375.27 million for the 18 months period ended 30th September, 2012 as against Rs.168.220 millions during the year ended 31st March, 2011. Net profit after tax was Rs.383.650 millions for the 18 months period ended 30th September, 2012 as against Rs.147.480 millions during the year ended 31st March, 2011.
During the 18 months period ended 30th September, 2012, Company sold its AHTS vessel Suvarna and Amba Bhargavi on Bareboat Charter cum Demise (BBCD) basis to Varun Cyprus Limited, Cyprus andVarun Asia Pte. Limited, Singapore respectively and thereafter transferred the ownership of the vessels to the said companies. Further, the ownership of the vessels Amba Bhakti and Amba Bhavanee sold earlier on BBCD basis was transferred to Varun Asia Pte. Limited, Singapore and the ownership of AHTS vessels Subhiksha and Sudaksha sold earlier on BBCD basis was transferred to Varun Cyprus Limited, Cyprus.
The Company has also sold its AHTS vessels Subhadra and Suchandra to Varun Cyprus Limited. Due to flexibility of crewing under foreign flag and financing and fiscal benefits available to companies incorporated overseas, the subsidiaries/associate companies overseas have been able to obtain long-term low cost financing and long-term contracts/employment for the vessels acquired by them. The sale has also enabled the Company to reduce its debt from Rs.27036.500 millions as on 31st March, 2011 to Rs.13434.700 millions as on 30th September, 2012.
The Company together with its associates is the 5th largest in the world in terms of number of fully refrigerated LPG carriers and 7th largest in the world in terms of cbm, i.e. cargo carrying capacity under 10,000 + cbm category. The LPG carrier fleet presently owned and/or operated by the Company is the largest in India in terms of both fleet size and cargo carrying capacity.
With a view to realign businesses and increase focus on individual growth strategies of each business, the Company together with other companies has proposed to rearrange its businesses by segregating its traditional shipping business, ship management (technical and commercial management) and shipping investment business (presently confined to holding investment in group companies) into separate entities through a Composite Scheme of Arrangement and Amalgamation (the “Scheme”) under the provisions of the Companies Act, 1956 thereby resulting in enhancement of business prospects and shareholder’s value. The Company has received approval of Competition Commission of India and in-principle approvals from Bombay Stock Exchange Limited and National Stock Exchange of India Limited for the said Scheme.
The necessary application has also been made to the Hon’ble High Court of Judicature at Bombay for approval of the said Scheme.
During the period, following companies became wholly owned subsidiary companies of the Company:
Varun Gas Infrastructure Limited - the Company holds 1,000,000 equity shares of Rs.10 each.
Varun Global Private Limited - the Company holds 100,000 equity shares of Rs.1 each.
Varun Resources Private Limited - the Company holds 150,007,773 equity shares of Rs.1 each.
Further, Varun Asia Pte. Limited, Singapore was a wholly owned subsidiary of the Company for the period from 3rd April, 2012 to 28th September, 2012 and is now an associate of the Company.
Further, Varun Cyprus Limited, Cyprus became a wholly owned subsidiary of the Company on 15th December, 2011 - the Company holds 1,000 equity shares of US$ 1 each.
The consolidated financial statements presented by the Company include financial information of its subsidiaries prepared in compliance with applicable Accounting Standards. The Ministry of Corporate Affairs, Government of India vide its Circular No. 51/12/2007-CL-III dated 8th February, 2011 has granted general exemption under Section 212(8) of the Companies Act, 1956 from attaching the balance sheet, profit and loss account and other documents of the subsidiary companies to the balance sheet of the Company, provided certain conditions are fulfilled. Accordingly, annual accounts of the subsidiary companies and the related detailed information will be made available to the Company and subsidiary companies’ shareholders seeking such information at any point of time. The annual accounts of the subsidiary companies will also be kept for inspection by any shareholder at Company’s Registered Office in Mumbai and that of the subsidiary companies concerned.
MANAGEMENT DISCUSSION
AND ANALYSIS
(A) INDUSTRY
STRUCTURE AND DEVELOPMENT:
Transportation by sea is the leading and also most preferred mode of transportation the world over. The international shipping industry transports hydrocarbons and bulk commodities in wet bulk, dry bulk, liquefied gas, bulk chemicals and container sectors. Further, specialized vessels are also used to carry passengers, automobiles and project cargoes the world over. In addition thereto, offshore support vessels are used to provide services to offshore oil and gas exploration and production industry. The Company owns and/or operates a diversified fleet of 20 vessels, in the oil, gas and offshore support services sector.
According to Platou Report 2012, the steady relationship between the global GDP growth and sea-borne trade growth continued in 2011. Tonnage demand rose by 6.7 per cent compared to world GDP growth of 3.8 per cent. The respective figures were somewhat below observed long-term averages but broadly confirmed the 2:1 relationship between tonnage demand growth and GDP growth. However, had it not been for the strong increase in LNG volume, tonnage demand growth would have been weaker than expected based solely on the GDP vs. trade relationship. The main factor behind the slump in tonnage demand growth was the container trades which were hit hard by the weakness in the US and European economies. In addition, the continued strengthening of the Chinese yuan caused Chinese export growth to slow to 20 per cent from more than 30 per cent in 2010.
According to Platou Report 2012, the start of the year 2011 turned out to be a tough twelve months for the shipping industry overall. Market performance was weak, with the notable exception of LNG, despite relatively strong trade growth. With expectations for the world economy undergoing a marked shift to the negative and scheduled new building deliveries still high for 2012, any meaningful increase in capacity utilisation will be hard to come by for the main segments.
Further, overall capacity utilisation of 84 per cent was above the very depressed level of 2009 and in line with the low levels seen at the start of the previous decade which was not a satisfactory time for shipping. Big differences among segments still exist.
According to Platou Report 2012, the year 2011 turned out to be one of the most volatile and eventful years ever for the global shipping environment. Three sets of events stand out; another financial crisis raised its head, the social upheaval in the Middle East (known as the Arab Spring) continued and, lastly, it was a major year for natural disasters with the two biggest – a tsunami and earthquake in Japan and the “flood of the century” in Australia, having a direct impact on shipping.
While the effect of these disasters varied among segments, the overall impact was negative for world growth and hence for tonnage demand.
High new building deliveries for the third year in a row continued to drive a large increase in fleet capacity. Total fleet growth came in at 8.2 per cent, the highest level in more than 20 years.
A marked slowdown in tonnage demand growth added to the tanker market’s supply problems in 2012 and brought average freight rates down to the lowest level since 1994. Seaborne trade volume showed only marginal growth from the previous year. Fleet capacity continued its steady increase with a 6.2 per cent gain. Overall fleet utilisation fell by more than 3 percentage points to an estimated 83 percent in the tanker market.
The dry bulk market weakened in 2011, average freight rates fell by more than 40 per cent with Capesize rates leading the way with a 50 per cent drop. A sharp jump in fleet capacity outweighed continued strong albeit volatile, tonnage demand, which grew at 10 per cent. Fleet capacity growth was massive, despite ongoing delays, slippage and cancellations. Net fleet growth topped 15 per cent, a modern day record. Fleet utilisation fell by 4 percentage points but at 88 per cent remained well above the low levels seen for tankers and containers.
Average freight rates for container vessels rose in 2011 but market performance was very uneven. Demand growth was only half of the previous year’s sturdy pace, at 7.5 per cent. Fleet capacity added another 8.0 per cent resulting in a modest fall in capacity utilisation, keeping it below 80 per cent for the third straight year.
The LNG market had a fantastic year, in contrast to the rest of the industry. It is estimated that tonnage demand grew by more than 20 per cent while the active fleet increased only by 10 percent. This led to a significant tightening of market fundamentals.
According to Platou Report 2012 in the year 2011 in the crude oil tanker market, fleet capacity continued its above-trend expansion but the real negative surprise was that seaborne trade growth slowed to a trickle, only a year after one of the strongest performance on record. Fleet utilization thus moved significantly lower. VLCCs led the sharp drop in rates. Suezmaxes and Aframaxes also suffered, but rates did not fall as dramatically as for VLCCs. The seasonal upturn during the winter months was remarkably short and from the start of the second quarter and well into the fourth the market was exceptionally low for all segments.
LPG markets began a transition period in 2008. The year 2009 was the end of this beginning and start of a new era of sharply rising seaborne LPG supplies. The year 2012 has started seeing better utilisation of LPG vessels. Due to large expansion of Qatar Gas and Ras Gas LNG plants and establishment of new LNG export/import terminals, more LPG production and transportation is expected to take place during the times to come. Seaborne LPG supply is forecast to rise 47 percent to 83 mm t/year between 2008 and 2016. The growth a difference of 27 mm t/year of exports in 2016 v/s 2008 will alter the way LPG markets trade, changing trade dynamics and forcing product to new buyers.
According to Platou Report 2012, spending on oil and gas E and P accelerated further in 2011 and rose by an estimated 14 per cent, a very impressive figure considering that it came on top of robust double-digit growth in 2010. The sustained jump in oil prices to above $ 100 was an obvious catalyst. The demand for offshore support vessels (OSVs) in 2011 clearly benefited from significant increase in global offshore activity. The increase in offshore activity came on the back of rising oil prices and an estimated 14 per cent rise in global E&P spending. The rise in upstream investments produced growth across all the major drivers of OSV demand.
While day rates for large AHTS vessels generally increased in 2011, smaller sized vessels were left struggling to perform in many regions throughout the year.
Brazil was the epicentre of activity and increasing demand
there attracted a number of AHTS vessels from other regions.
SEGMENT-WISE
PERFORMANCE:
The Company is primarily engaged in the business of shipping and hence there are no separate reportable segments.
The Company together with its subsidiaries and associates, owns and/or operates a fleet of ten LPG carriers, including seven mid-size Gas Carriers (MGC’s), one Large Gas Carrier (LGC) and two Very Large Gas Carriers (VLGC’s), which have been deployed on a mix of time charters and spot charters with charterers such as Indian Oil Corporation Limited, Hindustan Petroleum Corporation Limited, Bharat Petroleum Corporation Limited, Reliance Industries Limited and Pertamina.
In the crude oil sector, as a ship manager, the Company operates three double hull Aframax crude oil tankers, which are placed in the Sigma Tanker Pool, trading globally. The benefit of working in the pool is that earnings of group of vessels owned by different owners are pooled together and distributed amongst various owners.
In the offshore support services sector, as a ship manager,
the Company operates a fleet of five large Anchor Handling Towing and Supply
(AHTS) vessels. The 3 large AHTS Vessels are on time charter to Petrobras,
Brazil for a firm period of four years with four extension options of one year
each. The other 2 large AHTS Vessels are on charter to Topaz Group in Caspian
Sea for ultimate charter to BP Exploration (Caspian Sea) Limited for a period
of two years with two extension options of one year each.
OUTLOOK:
There are encouraging signs that market mechanisms are being allowed to work and one may hope that a more balanced situation will emerge from 2013 onwards, world economy permitting.
One of the few bright spots for owners in 2011 has been the substantial reduction in the new building order book. New orders fell by almost 20 per cent, with conventional shipping segments seeing a decline of more than 50 per cent. That has brought the overall order book down to around 20 percent of the fleet, in line with the long-term pre 2007 trend. Another year of relatively high deliveries and limited ordering should take the ratio below trend. This is positive for everyone involved because the first step towards a balanced market and adequate earnings begins with a manageable supply side.
It appears that 2012 is another challenging year for world shipping markets, in line with 2011.
According to Platou Report 2012, freight market in the three major shipping segments-tankers, bulk carriers and container ships is expected to be subdued. However, less demand from the major segments may result in higher focus on smaller, industrial segment.
Increasing focus on fuel efficiency and new regulations for new tonnage might help boost ordering activity, as shipyards respond by offering new, improved designs. Another factor that will affect the balance in the new building markets is the potential downsizing of the building capacity. In difficult time shipbuilders will have to close down facilities due to lack of employment, but historically this has proven to be a slow process. However, yards may adopt conventional ship building capacity to offshore capacity or even utilize their capacity for other means than shipbuilding.
In conclusion, we foresee an oversupplied new building market in the coming year.
On the tanker markets, the supply side of the market will be the biggest challenge as more than 10 per cent of the fleet is scheduled to be delivered and considering other factors a net fleet growth of 6 per cent is expected. This will continue the downward pressure on fleet utilisation through 2012. LPG demand growth has been strong in Asia and the Middle East and while Asia is the largest LPG consuming region, it is still expanding. The Middle East has become a significant LPG demand centre due to rapid expansion of petrochemical industry and continued growth in both residential and commercial sectors. Overall demand in Europe and North America is reasonably flat but could increase if price sensitive LPG supplies are available. Also, demand will continue to expand slowly in Latin America due to rising consumption in residential and commercial markets. In the LPG sector, the order book is balanced considering the increased LPG demand in Asia, Middle East and Latin America. It is therefore expected that the freight rates will remain firm.
On a global basis, OSV day rates and fleet utilisation for
OSVs are forecast to rise but will vary by asset and region. OSV demand growth
is likely to be driven by a further focus on exploring and developing deepwater
assets. It seems likely that the main region propelling demand further will be
Brazil. As vessels per unit serviced in Brazil tend to be relatively high
compared to other regions combined with longer distances offshore, demand for
Offshore Supply Vessels is expected to receive an additional boost.
CONTINGENT LIABILITIES
|
Particulars |
30.09.2012 (18 Months) |
31.03.2011 |
|
|
|
|
|
On account of
guarantees executed by the Company’s bankers secured by charge on some of the
Company’s vessels and fixed deposits of Rs.5.865 Millions |
6240.960 |
38.850 |
|
|
|
|
|
Claims against the Company not acknowledged as debts |
182.565 |
84.845 |
|
|
|
|
|
Corporate
guarantees to the banks on behalf of VSC International Pte. Limited, Singapore,
Varun Asia Pte. Limited, Ocean Race Shipping Company Limited, Cyprus, and
Varun Gas Infrastructure Limited in respect of loans taken by them for
acquisition of ships. |
11068.564 |
2480.295 |
|
|
||
|
Deputy Commissioner
(CT) Chennai had raised a demand for Rs.83.284 Millions for earlier years on
account of levy of Commercial Tax on charter-hire in respect of some of their
ships. The Company was in appeal against the same and the Appellate authority
has given the ruling in favour of the Company. However the Deputy
Commissioner (CT) Chennai had preferred an appeal against the same with Sales
Tax Appellate Tribunal Chennai. The Appellate
Tribunal vide its Order dated 10th November, 2008, has allowed the Appeal filed
by the Revenue and has given the ruling in favour of the department. Company
has been advised that this demand is not sustainable and accordingly Company
has filed an appeal against the said Order in the Madras High Court. Hence no
provision has been made in the accounts. |
||
INDEX OF CHARGES:
|
S. No. |
Charge ID |
Date of Charge Creation/ Modification |
Charge amount secured |
Charge Holder |
Address |
Service Request Number
(SRN) |
|
1 |
10486532 |
24/02/2014 |
3,800,000,000.00 |
STATE BANK OF INDIA |
THE ARCADE, OVERSEAS
BRANCH, WORLD TRADE CENTRE, |
C01036995 |
|
2 |
10471104 |
09/01/2014 * |
1,500,000,000.00 |
STATE BANK OF INDIA |
THE ARCADE, WORLD TRADE CENTRE,
CUFFE PARADE, MUMBAI, MAHARASHTRA - 400005, INDIA |
B95607479 |
|
3 |
10438138 |
26/06/2013 |
500,000,000.00 |
IL&FS FINANCIAL
SERVICES LIMITED |
II & FS FINANCIAL
CENTREPLOT NO C-22 G BLOCK, BANDRA KURLA COMPLEX BANDRA E, MUMBAI,
MAHARASHTRA - |
B80164940 |
|
4 |
10418589 |
11/03/2013 |
2,600,000,000.00 |
STATE BANK OF INDIA |
THE ARCADE, WORLD TRADE
CENTRE, CUFFE PARADE, MUMBAI, MAHARASHTRA - 400005, INDIA |
B72848393 |
|
5 |
10416805 |
07/03/2013 |
1,100,000,000.00 |
STATE BANK OF HYDERABAD |
CORPORATE FINANCE BRANCH,
11-C, MITTAL TOWER, 210, NARIMAN POINT, MUMBAI, MAHARASHTRA - 400021, INDIA |
B72297617 |
|
6 |
10377749 |
21/09/2012 |
600,000,000.00 |
ICICI BANK LIMITED |
LANDMARKRACE COURCE CIRCLE,
ALKAPURI, BARODA, Gujarat - 390015, INDIA |
B58541152 |
|
7 |
10354360 |
03/05/2012 * |
800,000,000.00 |
SREI INFRASTRUCTURE
FINANCE LIMITED |
VISHWAKARMA,86C,TOPSIA
ROAD (SOUTH),, KOLKATA, Wes |
B39653266 |
|
8 |
10356388 |
28/05/2012 * |
410,000,000.00 |
India Infoline Finance
Limited |
IIFL House, Sun Infotech
Park, Road No. 16V,, Plo |
B40440067 |
|
9 |
10314490 |
02/11/2011 * |
900,000,000.00 |
State Bank of India |
Overseas Branch, World
Trade Centre, P.B No.16094 |
B24567612 |
|
10 |
10290334 |
01/03/2012 * |
500,000,000.00 |
EXPORT-IMPORT BANK OF
INDIA |
CENTRE OPNE BUILDING,
FLOOR 21, WORLD TRADE CENTR |
B34691451 |
|
11 |
10285789 |
10/05/2011 |
273,000,000.00 |
VIJAYA BANK |
MAKE CHAMBER IV (REAR
PORTION), NARIMAN POINT, MU |
B12393930 |
|
12 |
10246398 |
27/10/2010 |
500,000,000.00 |
VIJAYA BANK |
MAKER CHAMBER IV, (REAR
PORTION), NARIMAN POINT, |
A96931985 |
|
13 |
10229122 |
08/07/2010 |
500,000,000.00 |
INDIAN BANK |
MUMBAI FORT BRANCH, UNITED
INDIA BUILDING, SIR P. M.ROAD, FORT,, MUMBAI, MAHARASHTRA - 400001,
INDIA |
A89254502 |
|
14 |
10215011 |
30/04/2010 |
220,000,000.00 |
STATE BANK OF INDIA |
OVERSEAS BRANCH, WORLD
TRADE CENTRE, CUFFE PARADE, MUMBAI, MAHARASHTRA - 400005, INDIA |
A84348366 |
|
15 |
10218901 |
12/04/2010 |
450,000,000.00 |
Life Insurance
Corporation of India |
YOGAKSHEMA, JEEVAN BIMA
MARG, MUMBAI, MAHARASHTRA |
A84827997 |
|
16 |
10165673 |
09/07/2009 |
400,000,000.00 |
STATE BANK OF INDIA |
OVERSEAS BRANCH, WORLD
TRADE CENTRE, CUFFE PARAD |
A65113292 |
|
17 |
10144411 |
27/02/2009 |
243,150,000.00 |
BANK OF INDIA |
MUMBAI LARGE CORPORATE
BRANCH, 4TH FLOOR, 70/80, |
A57503070 |
|
18 |
10144422 |
27/02/2009 |
437,670,000.00 |
BANK OF INDIA |
MUMBAI LARGE CORPORATE
BRANCH, 4TH FLOOR, 70/80, |
A57511792 |
|
19 |
10074144 |
22/12/2008 * |
1,962,720,000.00 |
UNIT TRUST OF INDIA
INVESTMENT ADVISORY SERVICES L |
UTI TOWER GN BLOCKBANDRA
KURLA COMPLEX, BANDRA EAST, MUMBAI, MAHARASHTRA - 400051, INDIA |
A53871448 |
|
20 |
90230071 |
12/08/2005 |
100,000,000.00 |
EXPORT-IMPORT BANK OF
INDIA |
CENTRE ONE BUILDING;
WORLD TRADE CENTRE COMPLEX, |
- |
|
21 |
80020426 |
31/05/2012 * |
6,585,714,150.00 |
STATE BANK OF INDIA |
OVERSEAS BRANCH, WORLD TRADE
CENTRE, CUFFE PARADE, MUMBAI, MAHARASHTRA - 400005, INDIA |
B40440729 |
|
22 |
90229811 |
12/06/1998 * |
3,750,000,000.00 |
STATE BANK OF INDIA |
WORLD TRADE CENTRE, 2ND
FLOOR, MUMBAI, MAHARASHTRA - 400005, INDIA |
- |
|
23 |
90229745 |
28/01/2002 |
302,500,000.00 |
STAT BANK OF BARODA |
MUMBAI MAIN OFFICE,
MUMBAI SAMACHAR MARG, MUMBAI, |
- |
|
24 |
90229677 |
10/05/2001 |
188,000,000.00 |
STATE BANK OF PATIALA |
SPECIALISED CORPORATE
BRANCH, 13; ARCADE; WORLD T |
- |
|
25 |
90229307 |
19/01/2001 * |
440,000,000.00 |
BANK OF INDIA |
MUMBAI CORPORATE BANKING
BRANCH, 4TH FLOOR; 70/80; M.G. ROAD; FORT, MUMBAI, MAHARASHTRA - 400023,
INDIA |
- |
|
26 |
90229118 |
24/12/2001 * |
37,500,000.00 |
STATE BANK OF INDIA |
OVERSEAS BANCH, WORLD
TRADE CENTRE; 2ND FLOOR, MUMBAI MAHARASHTRA - 400005, INDIA |
- |
|
27 |
90229114 |
19/01/2001 * |
37,500,000.00 |
STATE BANK OF INDIA |
OVERSEAS BRANCH, WORLD TRADE
CENTRE; 2ND FLOOR, MUMBAI, MAHARASHTRA - 400005, INDIA |
- |
|
28 |
90232495 |
13/09/1996 |
37,500,000.00 |
STATE BANK OF INDIA |
WORLD TRADE CENTRE; 2ND
FLOOR, MUMBAI, MAHARASHTRA |
- |
|
29 |
90226788 |
14/10/1998 * |
250,000,000.00 |
ICICI LIMITED |
163; BACKBAY RECLAMATION,
MUMBAI, MAHARASHTRA - 400020, INDIA |
- |
|
30 |
90228579 |
18/09/1992 |
20,000,000.00 |
STATE BANK OF INDIA |
OVERSEAS BRANCH, WORLD
TRADE CENTRE; CUFFE PARADE, MUMBAI, MAHARASHTRA - 400005, INDIA |
- |
* Date of charge modification
FIXED ASSETS:
· Ships
· Land
· Other Premises
· Office Equipment
· Furniture and Fixture
· Vehicles
PRESS RELEASE
VARUN SHIPPING
COMPANY REPORTS NET LOSS OF RS.1200.400 MILLIONS IN THE MARCH 2014 QUARTER
CAPITAL MARKET, JUNE 2, 2014
Sales reported at Rs.251.800 Millions.
Net Loss of Varun Shipping Company
reported to Rs.1200.400 Millions in the quarter ended March 2014 as against net
loss of Rs.477.200 Millions during the previous quarter ended March 2013. Sales
reported to Rs.251.800 Millions in the quarter ended March 2014 as against
Rs.453.800 Millions during the previous quarter ended March 2013.
For the full year, net loss reported to Rs.4899.400 Millions in the year ended March 2014 as
against net profit of Rs.383.700 Millions
during the previous year ended September 2012. Sales declined 62.34% to
Rs.1753.100 Millions in the year ended
March 2014 as against Rs.4655.000 Millions
during the previous year ended September 2012.
VARUN SHIPPING LOSES LICENCE TO OPERATE SHIPS
MAR 13 2014.
Bangalore: Varun Shipping Company Limited, which runs one of the world’s largest fleet of liquefied petroleum gas (LPG) carriers, has lost its licence to operate ships after it failed to carry out a mandatory dry-docking of its ships for safety surveys and pay wage arrears to its crew.
The directorate general of shipping (DG Shipping) last week withdrew a so-called document of compliance of Varun Shipping-the first instance of the maritime regulator cancelling an Indian shipping company’s operating licence.
“I am directed to notify you that the Document of Compliance (DoC) issued to Varun Shipping Company Limited on 14 December 2012 is null and void since 4 March 2014 and that the vessels under your ownership/management are liable to be rendered ‘unseaworthy’,” Ajithkumar Sukumaran, deputy chief surveyor and senior deputy director general of shipping (technical), wrote in a 12 March notice to Varun Shipping.
The cancellation will only affect Varun Shipping’s Indian-registered ships over which DG Shipping has jurisdiction.
Sukumaran said in the notice that statutory surveys and certifications for Varun’s Indian-registered ships were overdue for several months, making them unsafe. He asked the company to “lay-up all the vessels, immediately, at safe locations with requisite operational staff on-board”
Yudhishthir Khatau, chairman and managing director of Varun Shipping, did not respond to calls made to his mobile phone seeking comment.
A DoC certifies that a ship-owning company has complied with the requirements of the International Management Code for the Safe Operation of Ships and for Pollution Prevention (ISM Code) of the International Maritime Organization.
It is issued by the maritime administration where a ship is registered, which in Varun’s case is DG Shipping. Failure to confirm to the rules could lead to suspension or cancellation of the DoC.
An immediate fallout of a DoC suspension or withdrawal is that the ships will lose insurance cover, said a Mumbai-based shipping consultant, who declined to be named.
In effect, “ships without a DoC will not be able to trade”, he said on condition of anonymity because his company’s policy doesn’t allow him to speak to the media.
Mumbai-listed Varun Shipping has a fleet of 18 ships comprising 10 LPG carriers, three crude oil tankers and five so-called anchor handling, towing and supply vessels, or AHTSVs, that are used to support offshore oil exploration activities.
Of these, six LPG carriers and two AHTSVs are registered in India. Of the other four LPG vessels, one each is registered in Singapore, Cyprus, Indonesia and Marshall Islands; three crude tankers are registered in Singapore and three AHTSVs in Cyprus.
In October, DG Shipping had issued a notice to Varun Shipping asking why its DoC should not be suspended for not complying with the rules and regulations under India’s maritime law. Varun Shipping was also asked to produce a financial package to meet its backlog of crew wages and dry-docking commitments.
Statutory safety surveys, particularly expensive dry-dock repairs, have to be done twice in a span of five years on a ship, with intervals between them not exceeding 36 months, according to the rules.
The maritime regulator said recent reports submitted by Varun Shipping on its financial restructuring plans had indicated alarming trends, including a mounting pendency of seafarer wages.
MERCATOR BUYS
VARUN SHIPPING’S LPG VESSEL
March 20, 2014
Mercator enters LPG transportation market with ship
acquisition, doesn’t disclose price at which vessel was bought
Bangalore/Mumbai: Shipping Company Mercator Limited has entered
the liquefied petroleum gas (LPG) transportation market by acquiring a so-called
very large gas carrier from financially stressed Varun Shipping Company Limited.
The India-registered ship is named the Maharshi Vishwamitra.
Atul Agarwal, managing director of Mercator, said his company has purchased the ship from Varun Shipping, but did not disclose the price at which it was bought.
A shipping industry executive, requesting anonymity, said that Varun Shipping is planning to exit the very-large gas carrier segment.
Varun Shipping owns another such ship, the Maharshi Bhardwaj. Agarwal would not confirm whether Mercator is buying the second ship, too.Yudhishthir Khatau, chairman and managing director of Varun Shipping, did not respond to calls made to his mobile phone seeking comment.
Earlier this month, India’s maritime regulator, the Directorate General of Shipping, annulled a so-called document of compliance (DoC)-a licence to operate ships-of Varun Shipping after the firm that runs one of the world’s largest fleets of LPG carriers failed to carry out mandatory dry-docking of ships for safety surveys and pay wage arrears to its crew.
Statutory surveys and certifications on six of Varun’s eight Indian ships were overdue for several months, rendering them unsafe and unseaworthy, the regulator said in a notice.
The ship purchased by Mercator does not figure in that list.
Statutory safety surveys, particularly expensive dry-dock repairs, have to be conducted twice every five years on a ship, with intervals between them not exceeding 36 months, according to the rules.
The crew of Varun ships has not been paid wages for about four months, according to the National Union of Seafarers of India (NUSI), which has a membership of some 70,000 ratings (general purpose staff working on board Indian ships).
Khatau, however, claims that the Directorate General of Shipping has not withdrawn Varun’s licence to operate ships.
“We have voluntarily surrendered the DoC to the Directorate General of Shipping as we have applied for a fresh DoC in the name of Varun Global Pvt. Ltd following a business reorganization,” Khatau told Mint on 13 March.
On 20 February, Mint reported that two shipping firms - Mercator and Great Eastern Shipping Company Limited - are evaluating the proposal put forth by Varun Shipping, citing two unnamed persons.
A surge in bad loans in the Rs.82 trillion banking system has pushed banks to take an aggressive stance in recovering dues from borrowers through asset sales. The Reserve Bank of India (RBI) has stressed the need for banks to take prompt action for loan recovery amid concerns over the rising pile of stressed assets.
Gross non-performing assets at 40 listed banks in the December quarter rose 35.8% to Rs.2.43 trillion from Rs.1.79 trillion a year earlier. About Rs.4 trillion of bank loans are being restructured, both through RBI’s so-called corporate debt restructuring mechanism and on a bilateral basis.
Mumbai-based Varun Shipping had restructured nearly Rs.20000.000 Millions of debt in 2012 by transferring some of its ships to overseas subsidiaries. The overseas arms, in turn, used the ships as collateral to raise inexpensive dollar loans to help repay costlier Indian debt.
According to Mint research, the consolidated debt of Varun Shipping stood at Rs.10833.400 Millions as of 30 September.
CMT REPORT (Corruption, Money Laundering & Terrorism]
The Public Notice information has been collected from various sources
including but not limited to: The Courts,
1] INFORMATION ON
DESIGNATED PARTY
No records exist designating subject or any of its beneficial owners,
controlling shareholders or senior officers as terrorist or terrorist
organization or whom notice had been received that all financial transactions
involving their assets have been blocked or convicted, found guilty or against
whom a judgement or order had been entered in a proceedings for violating
money-laundering, anti-corruption or bribery or international economic or
anti-terrorism sanction laws or whose assets were seized, blocked, frozen or
ordered forfeited for violation of money laundering or international
anti-terrorism laws.
2] Court Declaration:
No records exist to suggest that subject is or
was the subject of any formal or informal allegations, prosecutions or other
official proceeding for making any prohibited payments or other improper
payments to government officials for engaging in prohibited transactions or
with designated parties.
3] Asset Declaration:
No records exist to suggest that the property or assets of the subject
are derived from criminal conduct or a prohibited transaction.
4] Record on Financial
Crime:
Charges or conviction
registered against subject: None
5] Records on Violation of
Anti-Corruption Laws:
Charges or
investigation registered against subject: None
6] Records on Int’l
Anti-Money Laundering Laws/Standards :
Charges or
investigation registered against subject: None
7] Criminal Records
No available
information exist that suggest that subject or any of its principals have been
formally charged or convicted by a competent governmental authority for any
financial crime or under any formal investigation by a competent government
authority for any violation of anti-corruption laws or international anti-money
laundering laws or standard.
8] Affiliation with
Government :
No record
exists to suggest that any director or indirect owners, controlling
shareholders, director, officer or employee of the company is a government
official or a family member or close business associate of a Government
official.
9] Compensation Package :
Our market
survey revealed that the amount of compensation sought by the subject is fair
and reasonable and comparable to compensation paid to others for similar
services.
10] Press Report:
No press reports / filings exists on
the subject.
CORPORATE GOVERNANCE
MIRA INFORM as part of its Due Diligence do provide comments on
Corporate Governance to identify management and governance. These factors often
have been predictive and in some cases have created vulnerabilities to credit
deterioration.
Our Governance Assessment focuses principally on the interactions
between a company’s management, its Board of Directors, Shareholders and other
financial stakeholders.
CONTRAVENTION
Subject is not known to have contravened any existing local laws,
regulations or policies that prohibit, restrict or otherwise affect the terms
and conditions that could be included in the agreement with the subject.
FOREIGN EXCHANGE RATES
|
Currency |
Unit
|
Indian Rupees |
|
US Dollar |
1 |
Rs.59.20 |
|
|
1 |
Rs.99.52 |
|
Euro |
1 |
Rs.80.34 |
INFORMATION DETAILS
|
Information
Gathered by : |
PRT |
|
|
|
|
Analysis Done by
: |
SUB |
|
|
|
|
Report Prepared
by : |
NIT |
SCORE & RATING EXPLANATIONS
|
SCORE FACTORS |
RANGE |
POINTS |
|
HISTORY |
1~10 |
4 |
|
PAID-UP CAPITAL |
1~10 |
3 |
|
OPERATING SCALE |
1~10 |
3 |
|
FINANCIAL CONDITION |
|
|
|
--BUSINESS SCALE |
1~10 |
3 |
|
--PROFITABILIRY |
1~10 |
2 |
|
--LIQUIDITY |
1~10 |
2 |
|
--LEVERAGE |
1~10 |
1 |
|
--RESERVES |
1~10 |
2 |
|
--CREDIT LINES |
1~10 |
1 |
|
--MARGINS |
-5~5 |
-- |
|
DEMERIT POINTS |
|
|
|
--BANK CHARGES |
YES/NO |
YES |
|
--LITIGATION |
YES/NO |
YES |
|
--OTHER ADVERSE INFORMATION |
YES/NO |
YES |
|
MERIT POINTS |
|
|
|
--SOLE DISTRIBUTORSHIP |
YES/NO |
NO |
|
--EXPORT ACTIVITIES |
YES/NO |
NO |
|
--AFFILIATION |
YES/NO |
NO |
|
--LISTED |
YES/NO |
YES |
|
--OTHER MERIT FACTORS |
YES/NO |
YES |
|
DEFAULTER |
|
|
|
--RBI |
YES/NO |
NO |
|
--EPF |
YES/NO |
NO |
|
TOTAL |
|
21 |
This score serves as a reference to assess
SC’s credit risk and to set the amount of credit to be extended. It is
calculated from a composite of weighted scores obtained from each of the major
sections of this report. The assessed factors and their relative weights (as
indicated through %) are as follows:
Financial
condition (40%) Ownership
background (20%) Payment record
(10%)
Credit history
(10%) Market trend (10%) Operational size
(10%)
RATING EXPLANATIONS
|
RATING |
STATUS |
PROPOSED CREDIT LINE |
|
|
>86 |
Aaa |
Possesses an extremely sound financial base with the strongest capability
for timely payment of interest and principal sums |
Unlimited |
|
71-85 |
Aa |
Possesses adequate working capital. No caution needed for credit
transaction. It has above average (strong) capability for payment of interest
and principal sums |
Large |
|
56-70 |
A |
Financial & operational base are regarded healthy. General
unfavourable factors will not cause fatal effect. Satisfactory capability for
payment of interest and principal sums |
Fairly Large |
|
41-55 |
Ba |
Overall operation is considered normal. Capable to meet normal
commitments. |
Satisfactory |
|
26-40 |
B |
Capability to overcome financial difficulties seems comparatively
below average. |
Small |
|
11-25 |
Ca |
Adverse factors are apparent. Repayment of interest and principal sums
in default or expected to be in default upon maturity |
Limited with
full security |
|
<10 |
C |
Absolute credit risk exists. Caution needed to be exercised |
Credit not
recommended |
|
-- |
NB |
New Business |
-- |
This report is issued at your request without any
risk and responsibility on the part of MIRA INFORM PRIVATE LIMITED (MIPL)
or its officials.