MIRA
INFORM REPORT
|
Report Date : |
16.06.2014 |
IDENTIFICATION DETAILS
|
Name : |
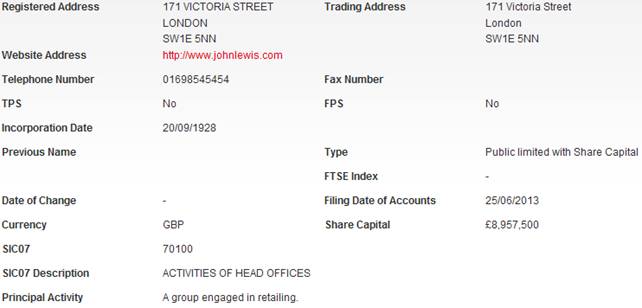
JOHN LEWIS PLC |
|
|
|
|
Registered Office : |
171 Victoria Street, London, SW1E 5NN |
|
|
|
|
Country : |
United Kingdom |
|
|
|
|
Financials (as on) : |
26.01.13 |
|
|
|
|
Date of Incorporation : |
20.09.1928 |
|
|
|
|
Legal Form : |
Public Limited With Share Capital |
|
|
|
|
Line of Business : |
Activities of Head Offices |
|
|
|
|
No. of Employees |
81900 |
RATING & COMMENTS
|
MIRA’s Rating : |
Ba |
|
RATING |
STATUS |
PROPOSED CREDIT LINE |
|
|
41-55 |
Ba |
Overall operation is considered normal. Capable to meet normal
commitments. |
Satisfactory |
|
Status : |
Satisfactory |
|
Payment Behaviour : |
No complaints |
|
Litigation : |
Clear |
NOTES :
Any query related to this report can be made
on e-mail : infodept@mirainform.com
while quoting report number, name and date.
ECGC Country Risk Classification List – March 31, 2014
|
Country Name |
Previous Rating (31.12.2013) |
Current Rating (31.03.2014) |
|
United Kingdom |
A1 |
A1 |
|
Risk Category |
ECGC
Classification |
|
Insignificant |
A1 |
|
Low Risk |
A2 |
|
Moderate Low Risk |
B1 |
|
Moderate Risk |
B2 |
|
Moderate High Risk |
C1 |
|
High Risk |
C2 |
|
Very High Risk |
D |
UNITED KINGDOM ECONOMIC
OVERVIEW
The UK, a leading trading power and financial center, is the third largest economy in Europe after Germany and France. Over the past two decades, the government has greatly reduced public ownership. Agriculture is intensive, highly mechanized, and efficient by European standards, producing about 60% of food needs with less than 2% of the labor force. The UK has large coal, natural gas, and oil resources, but its oil and natural gas reserves are declining and the UK became a net importer of energy in 2005. Services, particularly banking, insurance, and business services, are key drivers of British GDP growth. Manufacturing, meanwhile, has declined in importance but still accounts for about 10% of economic output. After emerging from recession in 1992, Britain's economy enjoyed the longest period of expansion on record during which time growth outpaced most of Western Europe. In 2008, however, the global financial crisis hit the economy particularly hard, due to the importance of its financial sector. Falling home prices, high consumer debt, and the global economic slowdown compounded Britain's economic problems, pushing the economy into recession in the latter half of 2008 and prompting the then BROWN (Labour) government to implement a number of measures to stimulate the economy and stabilize the financial markets; these included nationalizing parts of the banking system, temporarily cutting taxes, suspending public sector borrowing rules, and moving forward public spending on capital projects. Facing burgeoning public deficits and debt levels, in 2010 the CAMERON-led coalition government (between Conservatives and Liberal Democrats) initiated a five-year austerity program, which aimed to lower London's budget deficit from about 11% of GDP in 2010 to nearly 1% by 2015. In November 2011, Chancellor of the Exchequer George OSBORNE announced additional austerity measures through 2017 largely due to the euro-zone debt crisis. The CAMERON government raised the value added tax from 17.5% to 20% in 2011. It has pledged to reduce the corporation tax rate to 21% by 2014. The Bank of England (BoE) implemented an asset purchase program of £375 billion (approximately $605 billion) as of December 2013. During times of economic crisis, the BoE coordinates interest rate moves with the European Central Bank, but Britain remains outside the European Economic and Monetary Union (EMU). In 2012, weak consumer spending and subdued business investment weighed on the economy, however, in 2013 GDP grew 1.4%, accelerating unexpectedly in the second half of the year because of greater consumer spending and a recovering housing market. The budget deficit is falling but remains high at nearly 7% and public debt has continued to increase
|
Source
: CIA |
Company name and address
JOHN LEWIS PLC
DIRECTORS/MANAGEMENT
|
Total Current Directors |
11 |
|
Total Current Secretaries |
1 |
|
Total Previous Directors / Company Secretaries |
21 |
Current Directors
|
Name |
Date of Birth |
02/03/1961 |
|
|
Officers Title |
Mr |
Nationality |
British |
|
Present Appointments |
4 |
Function |
Director |
|
Appointment Date |
30/01/2005 |
|
|
|
Address |
171 Victoria Street, London, SW1E 5NN |
||
|
Other Actions |
|
||
|
Name |
Date of Birth |
25/12/1966 |
|
|
Officers Title |
Mr |
Nationality |
British |
|
Present Appointments |
10 |
Function |
Director |
|
Appointment Date |
24/09/2001 |
|
|
|
Address |
171 Victoria Street, London, SW1E 5NN |
||
|
Other Actions |
|
||
|
Name |
Date of Birth |
11/06/1963 |
|
|
Officers Title |
Mr |
Nationality |
British |
|
Present Appointments |
3 |
Function |
Director |
|
Appointment Date |
30/12/2002 |
|
|
|
Address |
171 Victoria Street, London, SW1E 5NN |
||
|
Other Actions |
|
||
|
Name |
Date of Birth |
25/04/1961 |
|
|
Officers Title |
Ms |
Nationality |
British |
|
Present Appointments |
2 |
Function |
Director |
|
Appointment Date |
30/04/2007 |
|
|
|
Address |
171 Victoria Street, London, SW1E 5NN |
||
|
Other Actions |
|
||
|
Name |
Date of Birth |
17/08/1962 |
|
|
Officers Title |
Mrs |
Nationality |
British |
|
Present Appointments |
16 |
Function |
Director |
|
Appointment Date |
01/06/2012 |
|
|
|
Address |
171 Victoria Street, London, SW1E 5NN |
||
|
Other Actions |
|
||
|
Name |
Date of Birth |
02/03/1965 |
|
|
Officers Title |
Ms |
Nationality |
British |
|
Present Appointments |
1 |
Function |
Director |
|
Appointment Date |
23/01/2013 |
|
|
|
Address |
171 Victoria Street, London, SW1E 5NN |
||
|
Other Actions |
|
||
|
Name |
Date of Birth |
16/05/1971 |
|
|
Officers Title |
Mr |
Nationality |
British |
|
Present Appointments |
1 |
Function |
Director |
|
Appointment Date |
23/01/2013 |
|
|
|
Address |
171 Victoria Street, London, SW1E 5NN |
||
|
Other Actions |
|
||
|
Name |
Date of Birth |
17/04/1963 |
|
|
Officers Title |
Mr |
Nationality |
British |
|
Present Appointments |
1 |
Function |
Director |
|
Appointment Date |
23/01/2013 |
|
|
|
Address |
171 Victoria Street, London, SW1E 5NN |
||
|
Other Actions |
|
||
|
Name |
Date of Birth |
05/12/1977 |
|
|
Officers Title |
Mr |
Nationality |
British |
|
Present Appointments |
1 |
Function |
Director |
|
Appointment Date |
23/01/2013 |
|
|
|
Address |
171 Victoria Street, London, SW1E 5NN |
||
|
Other Actions |
|
||
|
Name |
Date of Birth |
06/11/1973 |
|
|
Officers Title |
Mrs |
Nationality |
French |
|
Present Appointments |
1 |
Function |
Director |
|
Appointment Date |
15/12/2009 |
|
|
|
Address |
171 Victoria Street, London, SW1E 5NN |
||
|
Other Actions |
|
||
|
Name |
Date of Birth |
18/04/1951 |
|
|
Officers Title |
Mr |
Nationality |
British |
|
Present Appointments |
1 |
Function |
Director |
|
Appointment Date |
15/12/2009 |
|
|
|
Address |
171 Victoria Street, London, SW1E 5NN |
||
|
Other Actions |
|
||
Current Company Secretary
|
Name |
Date of Birth |
19/11/1954 |
|
|
Officers Title |
Ms |
Nationality |
British |
|
Present Appointments |
32 |
Function |
Company Secretary |
|
Appointment Date |
28/04/2006 |
|
|
|
Address |
171 Victoria Street, London, SW1E 5NN |
||
Previous Director/Company Secretaries
|
Name |
Current Directorships |
Previous Directorships |
|
0 |
7 |
|
|
7 |
16 |
|
|
0 |
11 |
|
|
4 |
8 |
|
|
0 |
4 |
|
|
1 |
14 |
|
|
0 |
5 |
|
|
0 |
3 |
|
|
0 |
1 |
|
|
3 |
14 |
|
|
11 |
30 |
|
|
1 |
5 |
|
|
0 |
8 |
|
|
1 |
4 |
|
|
0 |
17 |
|
|
0 |
11 |
|
|
2 |
36 |
|
|
2 |
14 |
|
|
18 |
26 |
|
|
0 |
2 |
|
|
0 |
3 |
NEGATIVE INFORMATION
CCJ
|
Total Number of Exact CCJs - |
Total Value of Exact CCJs - |
||
|
Total Number of Possible CCJs - |
Total Value of Possible CCJs - |
||
|
Total Number of Satisfied CCJs - |
Total Value of Satisfied CCJs - |
||
|
Total Number of Writs - |
- |
|
|
Exact CCJ Details
|
Date |
Court |
Amount |
Status |
Case Number |
Date Paid |
|
12/11/2013 |
NORTHAMPTON CCBC |
£124 |
Judgement |
3QZ09458 |
- |
|
07/08/2012 |
SHOREDITCH |
£1,015 |
Judgement |
2IR73248 |
- |
|
02/02/2011 |
NORTHAMPTON CCBC |
£1,919 |
Satisfied |
8XQ60826 |
08/06/2011 |
|
09/06/2009 |
STOCKPORT |
£666 |
Satisfied |
9SK02688 |
04/08/2009 |
|
16/02/2009 |
NORTHAMPTON CCBC |
£1,251 |
Satisfied |
9QT06359 |
27/04/2009 |
Possible CCJ Details
|
Date |
Court |
Amount |
Status |
Case Number |
Date Paid |
Registered CCJ / CJ Details |
|
25/09/2013 |
NORTHAMPTON CCBC |
£1,650 |
Judgement |
3QZ18756 |
- |
JOHN LEWIS PARTNERSHIP, DONCASTLE ROAD, SOUTHERN INDUSTRIAL ESTATE, BRACKNELL, RG12 8YA, RG12 8YA |
|
28/03/2011 |
BEDFORD |
£1,408 |
Judgement |
1BE00460 |
- |
JOHN LEWIS PARTNERSHIP, CENTRAL TRANSPORT, DONCASTLE ROAD, BRACKNELL, RG12 8YB, RG12 8YB |
Writ Details
|
Date |
Court |
Plaintiff |
|
20/12/2011 |
R C J - LONDON QUEENS BENCH |
ICKENHAM TRAVEL GROUP PLC |
Exact CCJ Details
|
Date |
Court |
Amount |
Status |
Case Number |
Date Paid |
|
12/11/2013 |
NORTHAMPTON CCBC |
£124 |
Judgement |
3QZ09458 |
- |
|
07/08/2012 |
SHOREDITCH |
£1,015 |
Judgement |
2IR73248 |
- |
|
02/02/2011 |
NORTHAMPTON CCBC |
£1,919 |
Satisfied |
8XQ60826 |
08/06/2011 |
|
09/06/2009 |
STOCKPORT |
£666 |
Satisfied |
9SK02688 |
04/08/2009 |
|
16/02/2009 |
NORTHAMPTON CCBC |
£1,251 |
Satisfied |
9QT06359 |
27/04/2009 |
|
02/01/2009 |
READING |
£1,078 |
Satisfied |
8RG07455 |
24/03/2009 |
|
12/08/2008 |
AYLESBURY |
£320 |
Satisfied |
8QT78722 |
11/10/2008 |
|
25/07/2008 |
RAWTENSTALL |
£2,268 |
Satisfied |
8RA02984 |
13/10/2008 |
|
17/07/2008 |
NORTHAMPTON CCBC |
£1,273 |
Satisfied |
8XQ55846 |
29/08/2008 |
|
09/07/2008 |
NORTHAMPTON CCBC |
£950 |
Satisfied |
8QT61983 |
17/12/2008 |
Possible CCJs Details
|
Date |
Court |
Amount |
Status |
Case Number |
Date Paid |
Registered CCJ Details |
|
25/09/2013 |
NORTHAMPTON CCBC |
£1,650 |
Judgement |
3QZ18756 |
- |
JOHN LEWIS PARTNERSHIP, DONCASTLE ROAD, SOUTHERN INDUSTRIAL ESTATE, BRACKNELL, RG12 8YA, RG12 8YA |
|
28/03/2011 |
BEDFORD |
£1,408 |
Judgement |
1BE00460 |
- |
JOHN LEWIS PARTNERSHIP, CENTRAL TRANSPORT, DONCASTLE ROAD, BRACKNELL, RG12 8YB, RG12 8YB |
Writ Details
|
Date |
Court |
Plaintiff |
|
20/12/2011 |
R C J - LONDON QUEENS BENCH |
ICKENHAM TRAVEL GROUP PLC |
Mortgage Details
|
Mortgage Type: |
STANDARD SECURITY PRESENTED FOR REGISTRATION IN SCOTLAND ON 12/5/86 |
||
|
Date Charge Created: |
12/05/86 |
|
|
|
Date Charge Registered: |
21/05/86 |
|
|
|
Date Charge Satisfied: |
27/07/87 |
|
|
|
Status: |
SATISFIED |
|
|
|
Person(s) Entitled: |
NORTHERN CO-OPERATIVE SOCIETY LIMITED |
||
|
Amount Secured: |
£4,238.500 AND ALL OTHER MONIES DUE OR TO BECOME DUE FROM THE COMPANY TO THECHARGEE IN TERMS OF THE MISSIVES OF SALE DATED 6,11,12 & 28 FEBRUARY 1986 |
||
|
Details: |
AREA OF GROUND BOUNDED BY GEORGE STREET.JACK STEET & ST ANDREWS STREET ABERDEENWITH BUILDINGS KNOWNAS NORCO HOUSE. |
||
|
Mortgage Type: |
|
||
|
Date Charge Created: |
01/09/34 |
|
|
|
Date Charge Registered: |
01/09/34 |
|
|
|
Date Charge Satisfied: |
- |
|
|
|
Status: |
OUTSTANDING |
|
|
|
Person(s) Entitled: |
|
||
|
Amount Secured: |
NO AMOUNT SECURED |
||
|
Details: |
|
||
|
Mortgage Type: |
|
||
|
Date Charge Created: |
03/07/34 |
|
|
|
Date Charge Registered: |
12/07/34 |
|
|
|
Date Charge Satisfied: |
- |
|
|
|
Status: |
PARTIAL PROPERTY RELEASE |
|
|
|
Person(s) Entitled: |
THE PRUDENTIAL ASSURANCE COMPANY LIMITED |
||
|
Amount Secured: |
£1,050,000 DEBENTURE STOCK AND PREMIUM OF 5% SUPPLEMENTAL TO TRUST DEED DATED 31/1/34 AND A DEEDSUPPLEMENTAL THERETO |
||
|
Details: |
FREEHOLD LAND ON THE NORTH EAST SIDE OFDRAYCOTT AVENUE CHELSEA LONDON. |
||
|
Mortgage Type: |
|
||
|
Date Charge Created: |
03/07/34 |
|
|
|
Date Charge Registered: |
12/07/34 |
|
|
|
Date Charge Satisfied: |
- |
|
|
|
Status: |
PARTIAL PROPERTY RELEASE |
|
|
|
Person(s) Entitled: |
THE PRUDENTIAL ASSURANCE COMPANY LIMITED |
||
|
Amount Secured: |
FOR SECURING £1,050,000 DEBENTURE STOCKAND PREMIUM OF 5% SUPPLEMENTAL TO TRUST DEED DATED 31/1/34AND A DEED SUPPLEMENTAL THERETO |
||
|
Details: |
LAND AND PREMISES AT REAR OF 19,21,23 PALMERSTON RD & NO 7 RICHMOND PLACELAND AND SHOPS NOS 25,27,29,31,33 & 35 PALMERSTON RD & 1 STANLEY LANE. SOUTHSEA PORTSMOUTH LAND AT NORTH SIDE OF STANLEY LANE.SOUTHSEA. |
||
|
Mortgage Type: |
|
||
|
Date Charge Created: |
27/04/34 |
|
|
|
Date Charge Registered: |
07/05/34 |
|
|
|
Date Charge Satisfied: |
- |
|
|
|
Status: |
PARTIAL PROPERTY RELEASE |
|
|
|
Person(s) Entitled: |
THE PRUDENTIAL ASSURANCE COMPANY LIMITED |
||
|
Amount Secured: |
DEBENTURE STOCK AMOUNTING TO £850,000 AND ANY FURTHER STOCK UP TO £400,000 AND A PREMIUM OF £5% |
||
|
Details: |
23,24,25 & 26 SLOANE SQUARE CHELSEA ANDLAND BUILDINGS AT BACK. 1 TO 31 (ODD) &31A SYMONS STREET CHELSEA. 2 TO 28 (EVEN) & 10A KINGS ROAD CHELSEA. 25 TO 31 (ODD) CADOGAN GARDENS CHELSEA. |
||
SHARE & SHARE CAPITAL INFORMATION
Top 20 Shareholders
|
Name |
Currency |
Share Count |
Share Type |
Nominal Value |
|
JOHN LEWIS PARTNERSHIP PLC |
GBP |
6,749,990 |
ORDINARY |
1 |
|
JOHN LEWIS PARTNERSHIP PLC |
GBP |
1,214,387 |
1ST CUMULATIVE PREFERENCE |
1 |
|
JOHN LEWIS PARTNERSHIP PLC |
GBP |
566,654 |
CUMULATIVE PREFERENCE |
1 |
|
W.B. NOMINEES LTD A/C N046713 |
GBP |
100,000 |
1ST CUMULATIVE PREFERENCE |
1 |
|
MR PETER FRANCIS WEARDON & MRS DENE ALLISON WEARDEN |
GBP |
40,900 |
CUMULATIVE PREFERENCE |
1 |
PAYMENT INFORMATION
|
Average Invoice Value |
£774.99 |
|
Invoices available |
18999 |
|
Paid |
17812 |
|
Outstanding |
1187 |
|
Trade Payment Data is information that we collect from selected third party partners who send us information about their whole sales ledger. |
|
|
Within Terms |
0-30 Days |
31-60 Days |
61-90 Days |
91+ Days |
|
Paid |
5978 |
10724 |
619 |
161 |
330 |
|
Outstanding |
246 |
150 |
70 |
54 |
667 |
GROUP STRUCTURE & AFFILIATED COMPANIES
Statistics
|
Group |
18 companies |
|
Linkages |
|
|
Countries |
Summary
|
Holding Company |
JOHN LEWIS PARTNERSHIP PLC |
|
Ownership Status |
Wholly Owned |
|
Ultimate Holding Company |
JOHN LEWIS PARTNERSHIP PLC |
Group structure
|
Company Name |
Registered Number |
Latest Key Financials |
Consol. Accounts |
Turnover |
|
00238937 |
26.01.2013 |
Y |
£8,465,500,000 |
|
|
00481406 |
26.01.2013 |
N |
|
|
|
00233462 |
26.01.2013 |
Y |
£8,465,500,000 |
|
|
02828420 |
26.01.2013 |
N |
|
|
|
02829583 |
26.01.2013 |
N |
|
|
|
03709785 |
26.01.2013 |
N |
|
|
|
07106855 |
26.01.2013 |
N |
|
|
|
00372106 |
26.01.2013 |
N |
|
|
|
07501166 |
26.01.2013 |
N |
|
|
|
07643845 |
26.01.2013 |
N |
£416,000 |
|
|
04328890 |
26.01.2013 |
N |
£812,000 |
|
|
SC370158 |
26.01.2013 |
N |
|
|
|
00223203 |
26.01.2013 |
N |
|
|
|
00240604 |
26.01.2013 |
N |
|
|
|
00285318 |
26.01.2013 |
N |
|
|
|
00303301 |
26.01.2013 |
N |
£40,100,000 |
|
|
00318082 |
26.01.2013 |
N |
£20,414,300 |
|
|
00099405 |
26.01.2013 |
Y |
£5,416,100,000 |
FINANCIAL INFORMATION
Profit & Loss
|
Date Of Accounts |
26/01/13 |
(%) |
28/01/12 |
(%) |
29/01/11 |
(%) |
30/01/10 |
(%) |
31/01/09 |
|
Weeks |
52 |
(%) |
52 |
(%) |
52 |
(%) |
52 |
(%) |
53 |
|
Currency |
GBP |
(%) |
GBP |
(%) |
GBP |
(%) |
GBP |
(%) |
GBP |
|
Consolidated A/cs |
Y |
(%) |
Y |
(%) |
Y |
(%) |
Y |
(%) |
Y |
|
Turnover |
£8,465,500,000 |
9.1% |
£7,758,600,000 |
5.4% |
£7,361,800,000 |
9.3% |
£6,734,600,000 |
7.5% |
£6,267,200,000 |
|
Export |
- |
- |
- |
- |
- |
- |
- |
- |
- |
|
Cost of Sales |
£5,640,100,000 |
9.2% |
£5,166,500,000 |
5.9% |
£4,878,700,000 |
9.4% |
£4,460,400,000 |
6.3% |
£4,195,400,000 |
|
Gross Profit |
£2,825,400,000 |
9% |
£2,592,100,000 |
4.4% |
£2,483,100,000 |
9.2% |
£2,274,200,000 |
9.8% |
£2,071,800,000 |
|
Wages & Salaries |
£1,662,400,000 |
8.9% |
£1,526,000,000 |
3.8% |
£1,470,400,000 |
13.2% |
£1,299,000,000 |
5.4% |
£1,233,000,000 |
|
Directors Emoluments |
£5,610,000 |
5.3% |
£5,330,000 |
54.9% |
£3,440,000 |
12.8% |
£3,050,000 |
5.2% |
£2,900,000 |
|
Operating Profit |
£449,700,000 |
15% |
£391,000,000 |
-8.9% |
£429,300,000 |
27% |
£338,000,000 |
5.2% |
£321,200,000 |
|
Depreciation |
£22,500,000 |
-90.7% |
£241,000,000 |
11.8% |
£215,500,000 |
13.5% |
£189,900,000 |
4.9% |
£181,100,000 |
|
Audit Fees |
£800,000 |
14.3% |
£700,000 |
- |
£700,000 |
- |
£700,000 |
- |
£700,000 |
|
Interest Payments |
£81,000,000 |
14.9% |
£70,500,000 |
4% |
£67,800,000 |
-22.6% |
£87,600,000 |
63.7% |
£53,500,000 |
|
Pre Tax Profit |
£198,000,000 |
5.3% |
£188,100,000 |
8.7% |
£173,100,000 |
11.7% |
£154,900,000 |
-44.9% |
£281,000,000 |
|
Taxation |
-£46,500,000 |
10.4% |
-£51,900,000 |
-13.8% |
-£45,600,000 |
5.6% |
-£48,300,000 |
-1.3% |
-£47,700,000 |
|
Profit After Tax |
£151,500,000 |
11.2% |
£136,200,000 |
6.8% |
£127,500,000 |
19.6% |
£106,600,000 |
-54.3% |
£233,300,000 |
|
Dividends Payable |
£100,000 |
- |
£100,000 |
- |
£100,000 |
- |
£100,000 |
- |
£100,000 |
|
Retained Profit |
£151,400,000 |
11.2% |
£136,100,000 |
6.8% |
£127,400,000 |
19.6% |
£106,500,000 |
-54.3% |
£233,200,000 |
Balance Sheet
|
Date Of Accounts |
26/01/13 |
(%) |
28/01/12 |
(%) |
29/01/11 |
(%) |
30/01/10 |
(%) |
31/01/09 |
|
Tangible Assets |
£3,902,300,000 |
1.4% |
£3,849,700,000 |
5.1% |
£3,664,000,000 |
5.4% |
£3,475,400,000 |
7.2% |
£3,242,900,000 |
|
Intangible Assets |
£213,700,000 |
30.1% |
£164,300,000 |
47.5% |
£111,400,000 |
20.4% |
£92,500,000 |
8.7% |
£85,100,000 |
|
Total Fixed Assets |
£4,116,000,000 |
2.5% |
£4,014,000,000 |
6.3% |
£3,775,400,000 |
5.8% |
£3,567,900,000 |
7.2% |
£3,328,000,000 |
|
Stock |
£514,000,000 |
10.5% |
£465,200,000 |
10.2% |
£422,000,000 |
5.8% |
£399,000,000 |
13.3% |
£352,300,000 |
|
Trade Debtors |
£49,500,000 |
-35.8% |
£77,100,000 |
-1.9% |
£78,600,000 |
19.8% |
£65,600,000 |
43.2% |
£45,800,000 |
|
Cash |
£534,400,000 |
-3% |
£550,800,000 |
7.4% |
£512,700,000 |
-8.4% |
£560,000,000 |
183.4% |
£197,600,000 |
|
Other Debtors |
£142,400,000 |
4.6% |
£136,100,000 |
3% |
£132,100,000 |
29.8% |
£101,800,000 |
9.3% |
£93,100,000 |
|
Miscellaneous Current Assets |
£7,300,000 |
170.4% |
£2,700,000 |
-89.5% |
£25,700,000 |
89% |
£13,600,000 |
-41.9% |
£23,400,000 |
|
Total Current Assets |
£1,247,600,000 |
1.3% |
£1,231,900,000 |
5.2% |
£1,171,100,000 |
2.7% |
£1,140,000,000 |
60.1% |
£712,200,000 |
|
Trade Creditors |
£698,100,000 |
31.7% |
£530,100,000 |
24.9% |
£424,500,000 |
18.5% |
£358,200,000 |
12.3% |
£318,900,000 |
|
Bank Loans & Overdrafts |
£156,300,000 |
-48.3% |
£302,100,000 |
362.6% |
£65,300,000 |
-43.5% |
£115,600,000 |
52.5% |
£75,800,000 |
|
Other Short Term Finance |
£92,800,000 |
20.1% |
£77,300,000 |
-51.4% |
£158,900,000 |
243.9% |
£46,200,000 |
42.2% |
£32,500,000 |
|
Miscellaneous Current Liabilities |
£774,000,000 |
10.1% |
£702,800,000 |
1.7% |
£690,900,000 |
15.7% |
£597,300,000 |
26.6% |
£471,700,000 |
|
Total Current Liabilities |
£1,721,200,000 |
6.8% |
£1,612,300,000 |
20.4% |
£1,339,600,000 |
19.9% |
£1,117,300,000 |
24.3% |
£898,900,000 |
|
Bank Loans & Overdrafts and LTL |
£1,897,500,000 |
-1.5% |
£1,926,800,000 |
20.4% |
£1,599,700,000 |
-20.1% |
£2,002,000,000 |
33.9% |
£1,494,600,000 |
|
Other Long Term Finance |
£35,900,000 |
36% |
£26,400,000 |
-5.7% |
£28,000,000 |
-1.8% |
£28,500,000 |
-2.4% |
£29,200,000 |
|
Total Long Term Liabilities |
£1,741,200,000 |
7.2% |
£1,624,700,000 |
5.9% |
£1,534,400,000 |
-18.7% |
£1,886,400,000 |
33% |
£1,418,800,000 |
Capital &
Reserves
|
Date Of Accounts |
26/01/13 |
(%) |
28/01/12 |
(%) |
29/01/11 |
(%) |
30/01/10 |
(%) |
31/01/09 |
|
Called Up Share Capital |
£6,700,000 |
- |
£6,700,000 |
- |
£6,700,000 |
- |
£6,700,000 |
- |
£6,700,000 |
|
P & L Account Reserve |
£1,888,900,000 |
-5.6% |
£2,000,300,000 |
-3.1% |
£2,064,100,000 |
21.6% |
£1,697,400,000 |
-0.5% |
£1,706,400,000 |
|
Revaluation Reserve |
- |
- |
- |
- |
- |
- |
- |
- |
- |
|
Sundry Reserves |
£5,600,000 |
194.7% |
£1,900,000 |
11.8% |
£1,700,000 |
999.9% |
£100,000 |
-98.9% |
£9,400,000 |
|
Shareholder Funds |
£1,901,200,000 |
-5.4% |
£2,008,900,000 |
-3.1% |
£2,072,500,000 |
21.6% |
£1,704,200,000 |
-1.1% |
£1,722,500,000 |
Other Financial Items
|
Date Of Accounts |
26/01/13 |
(%) |
28/01/12 |
(%) |
29/01/11 |
(%) |
30/01/10 |
(%) |
31/01/09 |
|
Net Worth |
£1,687,500,000 |
-8.5% |
£1,844,600,000 |
-5.9% |
£1,961,100,000 |
21.7% |
£1,611,700,000 |
-1.6% |
£1,637,400,000 |
|
Working Capital |
-£473,600,000 |
-24.5% |
-£380,400,000 |
-125.8% |
-£168,500,000 |
-842.3% |
£22,700,000 |
112.2% |
-£186,700,000 |
|
Total Assets |
£5,363,600,000 |
2.2% |
£5,245,900,000 |
6.1% |
£4,946,500,000 |
5.1% |
£4,707,900,000 |
16.5% |
£4,040,200,000 |
|
Total Liabilities |
£3,462,400,000 |
7% |
£3,237,000,000 |
12.6% |
£2,874,000,000 |
-4.3% |
£3,003,700,000 |
29.6% |
£2,317,700,000 |
|
Net Assets |
£1,901,200,000 |
-5.4% |
£2,008,900,000 |
-3.1% |
£2,072,500,000 |
21.6% |
£1,704,200,000 |
-1.1% |
£1,722,500,000 |
Cash Flow
|
Date Of Accounts |
26/01/13 |
(%) |
28/01/12 |
(%) |
29/01/11 |
(%) |
30/01/10 |
(%) |
31/01/09 |
|
Net Cashflow from Operations |
£267,300,000 |
28.1% |
£208,600,000 |
-51.2% |
£427,100,000 |
-13.2% |
£492,100,000 |
26.3% |
£389,700,000 |
|
Net Cashflow before Financing |
£268,800,000 |
567% |
£40,300,000 |
170% |
-£57,600,000 |
-194.3% |
£61,100,000 |
627.4% |
£8,400,000 |
|
Net Cashflow from Financing |
-£299,100,000 |
-999.9% |
-£300,000 |
-100.5% |
£60,600,000 |
-76.8% |
£261,500,000 |
420.9% |
£50,200,000 |
|
Increase in Cash |
-£30,300,000 |
-175.8% |
£40,000,000 |
999.9% |
£3,000,000 |
-99.1% |
£322,600,000 |
450.5% |
£58,600,000 |
Miscellaneous
|
Date Of Accounts |
26/01/13 |
(%) |
28/01/12 |
(%) |
29/01/11 |
(%) |
30/01/10 |
(%) |
31/01/09 |
|
Contingent Liability |
YES |
- |
YES |
- |
YES |
- |
NO |
- |
YES |
|
Capital Employed |
£3,642,400,000 |
0.2% |
£3,633,600,000 |
0.7% |
£3,606,900,000 |
0.5% |
£3,590,600,000 |
14.3% |
£3,141,300,000 |
|
Number of Employees |
81900 |
4.1% |
78700 |
5.2% |
74800 |
6.9% |
70000 |
1.9% |
68700 |
|
Auditors |
PRICEWATERHOUSECOOPERS LLP |
||||||||
|
Auditor Comments |
The audit report contains no adverse comments |
||||||||
|
Bankers |
THE ROYAL BANK OF SCOTLAND PLC |
||||||||
|
Bank Branch Code |
|
||||||||
Ratios
|
Date Of Accounts |
26/01/13 |
28/01/12 |
29/01/11 |
30/01/10 |
31/01/09 |
|
Pre-tax profit margin % |
2.34 |
2.42 |
2.35 |
2.30 |
4.48 |
|
Current ratio |
0.72 |
0.76 |
0.87 |
1.02 |
0.79 |
|
Sales/Net Working Capital |
-17.87 |
-20.40 |
-43.69 |
296.68 |
-33.57 |
|
Gearing % |
99.80 |
95.90 |
77.20 |
117.50 |
86.80 |
|
Equity in % |
36.90 |
39.50 |
42.90 |
36.90 |
43.60 |
|
Creditor Days |
30.01 |
24.87 |
20.98 |
19.36 |
18.87 |
|
Debtor Days |
2.12 |
3.61 |
3.88 |
3.54 |
2.71 |
|
Liquidity/Acid Test |
0.42 |
0.47 |
0.55 |
0.66 |
0.40 |
|
Return On Capital Employed % |
5.43 |
5.17 |
4.79 |
4.31 |
8.94 |
|
Return On Total Assets Employed % |
3.69 |
3.58 |
3.49 |
3.29 |
6.95 |
|
Current Debt Ratio |
0.90 |
0.80 |
0.64 |
0.65 |
0.52 |
|
Total Debt Ratio |
1.82 |
1.61 |
1.38 |
1.76 |
1.34 |
|
Stock Turnover Ratio % |
6.07 |
5.99 |
5.73 |
5.92 |
5.62 |
|
Return on Net Assets Employed % |
10.41 |
9.36 |
8.35 |
9.08 |
16.31 |
Creditor Details
|
|
Total Number |
Total Value |
|
Trade Creditors |
0 |
- |
|
No Creditor Data |
Trade Debtors / Bad
Debt Detail
|
|
Total Number of Documented Trade |
Total Value of Documented Trade |
|
Trade Debtors |
- |
- |
|
No Debtor Data |
FOREIGN EXCHANGE RATES
N/a
ADDITIONAL INFORMATION
Status History
|
No Status History found. |
Event History
|
Date |
Description |
|
03/09/2013 |
Annual Returns |
|
08/08/2013 |
New Board Member Mr R. Hauff appointed |
|
08/08/2013 |
New Board Member Mrs B. Michel appointed |
|
06/07/2013 |
New Accounts Filed |
|
06/07/2013 |
New Accounts Filed |
|
05/02/2013 |
New Board Member Mr A.J. Young appointed |
|
05/02/2013 |
New Board Member Mr I.A. Fleming appointed |
|
05/02/2013 |
New Board Member Mr G.W. Walton appointed |
|
05/02/2013 |
New Board Member Ms R.C. Osborne appointed |
|
07/08/2012 |
Annual Returns |
|
18/07/2012 |
New Accounts Filed |
|
18/07/2012 |
New Accounts Filed |
|
26/06/2012 |
New Board Member Mrs H.A. Weir appointed |
|
19/06/2012 |
Ms M.L. Cassoni has left the board |
|
19/06/2012 |
New Board Member Mrs H.A. Weir appointed |
Previous Company
Names
|
No Previous Names found |
NOTES & COMMENTS
Commentary
|
Multiple CCJ's recorded against the company. |
|
|
There has been no significant change in the company's credit rating. |
|
|
Sales in the latest trading period increased 9.1% on the previous trading period. |
|
|
Net Worth decreased by 8.5% during the latest trading period. |
|
|
A 2.2% growth in Total Assets occurred during the latest trading period. |
|
|
Pre-tax profits increased by 5.3% compared to the previous trading period. |
|
|
The company saw a decrease in their Cash Balance of 3% during the latest trading period. |
|
|
The audit report contains no adverse comments. |
|
|
The company has undergone recent changes in its directorships. |
|
|
The company is part of a group. |
|
|
The company was established over 85 years ago. |
|
FOREIGN EXCHANGE RATES
|
Currency |
Unit
|
Indian Rupees |
|
US Dollar |
1 |
Rs.59.48 |
|
|
1 |
Rs.100.93 |
|
Euro |
1 |
Rs.80.71 |
INFORMATION DETAILS
|
Analysis Done by
: |
RAS |
|
|
|
|
Report Prepared
by : |
NIS |
RATING EXPLANATIONS
|
RATING |
STATUS |
PROPOSED CREDIT LINE |
|
|
|
>86 |
Aaa |
Possesses an extremely sound financial base with the strongest
capability for timely payment of interest and principal sums |
Unlimited |
|
|
71-85 |
Aa |
Possesses adequate working capital. No caution needed for credit
transaction. It has above average (strong) capability for payment of interest
and principal sums |
Large |
|
|
56-70 |
A |
Financial & operational base are regarded healthy. General
unfavourable factors will not cause fatal effect. Satisfactory capability for
payment of interest and principal sums |
Fairly Large |
|
|
41-55 |
Ba |
Overall
operation is considered normal. Capable to meet normal commitments. |
Satisfactory |
|
|
26-40 |
B |
Capability to overcome financial difficulties seems comparatively
below average. |
Small |
|
|
11-25 |
Ca |
Adverse factors are apparent. Repayment of interest and principal sums
in default or expected to be in default upon maturity |
Limited with
full security |
|
|
<10 |
C |
Absolute credit risk exists. Caution needed to be exercised |
Credit not
recommended |
|
|
-- |
NB |
New Business |
-- |
|
This score serves as a reference to assess
SC’s credit risk and to set the amount of credit to be extended. It is
calculated from a composite of weighted scores obtained from each of the major
sections of this report. The assessed factors and their relative weights (as
indicated through %) are as follows:
Financial
condition (40%) Ownership
background (20%) Payment
record (10%)
Credit history
(10%) Market trend (10%) Operational size
(10%)
This report is issued at your request without any
risk and responsibility on the part of MIRA INFORM PRIVATE LIMITED (MIPL)
or its officials.