MIRA INFORM REPORT
|
Report Date : |
26.06.2014 |
IDENTIFICATION DETAILS
|
Name : |
METKORE ALLOYS AND INDUSTRIES LIMITED |
|
|
|
|
Registered
Office : |
Plot No.18, Sagar Society, Street No.1, Road No.2, Banjara Hills, Hyderabad
– 500034, Andhra Pradesh |
|
|
|
|
Country : |
India |
|
|
|
|
Financials (as
on) : |
31.03.2013 |
|
|
|
|
Date of
Incorporation : |
23.03.2006 |
|
|
|
|
Com. Reg. No.: |
01-049591 |
|
|
|
|
Capital
Investment / Paid-up Capital : |
Rs.227.365 Millions |
|
|
|
|
CIN No.: [Company Identification
No.] |
L27101AP2006PLC049591 |
|
|
|
|
Legal Form : |
A Public Limited Liability company. The company’s Shares are Listed on
the Stock Exchanges. |
|
|
|
|
Line of Business
: |
Manufacturer and Exporter of High Carbon Ferro – Chrome used in
Stainless Steel Industry. |
|
|
|
|
No. of Employees
: |
300 (Approximately) |
RATING & COMMENTS
|
MIRA’s Rating : |
Ba (45) |
|
RATING |
STATUS |
PROPOSED CREDIT LINE |
|
|
41-55 |
Ba |
Overall operation is considered normal. Capable to meet normal
commitments. |
Satisfactory |
|
Maximum Credit Limit : |
USD 4200000 |
|
|
|
|
Status : |
Satisfactory |
|
|
|
|
Payment Behaviour : |
Usually correct |
|
|
|
|
Litigation : |
Clear |
|
|
|
|
Comments : |
Subject is an established company having satisfactory track. Trade relations are fair. Business is active. Payment terms are
reported as usually correct. The company can be considered for business dealings at usual trade
terms and conditions. |
NOTES:
Any query related to this report can be made
on e-mail: infodept@mirainform.com
while quoting report number, name and date.
ECGC Country Risk Classification List – March 31, 2014
|
Country Name |
Previous Rating (31.12.2013) |
Current Rating (31.03.2014) |
|
India |
A1 |
A1 |
|
Risk Category |
ECGC
Classification |
|
Insignificant |
A1 |
|
Low |
A2 |
|
Moderate |
B1 |
|
High |
B2 |
|
Very High |
C1 |
|
Restricted |
C2 |
|
Off-credit |
D |
INDIAN ECONOMIC OVERVIEW
N E W S
The economy grew 4.7 %in 2013/14, marking a
second straight year of sub-5 % growth – the worst slowdown in more than a
quarter of a century. The data was below an official estimate of 4.9 % annual
growth and compared with 4.5 % in the last fiscal year. However, the current
account deficit narrowed sharply to $ 32.4 billion at 1.7 % of gross domestic
product, in 2013/14 from a record high of $ 98.8 billion or 4.7 %, the year
before. A sharp fall in gold imports due to restrictions on overseas purchases
and muted import of capital goods helped shrink the current account deficit.
Online retailer Flipkart has acquired fashion
portal Myntra as it prepares to battle with the rapidly expanding India arm of the
global e-commerce giant Amazon. The company raised $ 210 million from Russian
Investment firm DST Global which has also invested in companies like Facebook,
Twitter and Alibaba Group.
General Motors will start exporting vehicles
from its Talegaon plant near Pune in the second half of 2014. GM was one of the
few global carmakers that was using its India plant only for the domestic
market.
Google has overtaken Apple as the world’s top
brand in terms of value, according to global market research agency Millward
Brown. Google’s brand value shot up 40 % in a year to $ 158.84 billion. The top
10 of the 100 slots were dominated by US companies.
Infosys lost another heavy weight when B G
Srinivas, a board member put in his papers. He is the third CEO-hopeful to quit
after Chairman N R Narayana Murthy’s return to the company – Ashok Vemuri and V
Balakrishnan being the other two. While Vemuri went on to lead IGate,
Balakrishnan joined politics.
Naresh Goyal – promoted Jet Airways posted
biggest quarterly loss – Rs 2153.37 crore – in the three months ended March 31,
mainly because it has been offering discounts to passengers to fill planes.
William S Pinckney – Chairman and CEO of
Amway India was arrested by the Andhra Pradesh Police in connection with a
complaint against the direct selling firm. This is the second time that he has
been taken into custody. A year, ago the Kerala Police had arrested Pinckney
and two company directors on charges of financial irregularities.
China has told its state-owned enterprises to
sever links with American consulting firms after the United States charged five
Chinese military officers wih hacking US companies. China’s action which
targets consultancies like McKinsey & Co. and the Boston Consulting Group,
sterns from fears that the first are providing trade secrets to the US
governments.
India has emerged as a country with some of
the highest unregistered businesses in the world. Indonesia has the maximum
number of shadow businesses, says a study of 68 countries by Imperial College
Business School in London.
Pfizer has abandoned its attempt to buy
AstraZeneca for nearly $ 118 billion after the latter refused an offer of 55
pounds a share.
RBI DEFAULTERS’ LIST STATUS
Subject’s name is not enlisted as a defaulter
in the publicly available RBI Defaulters’ list.
EPF (Employee Provident Fund) DEFAULTERS’ LIST STATUS
Subject’s name is not enlisted as a defaulter
in the publicly available EPF (Employee Provident Fund) Defaulters’ list as of
31-03-2012.
INFORMATION PARTED BY
|
Name : |
Mr. Avadhani |
|
Designation : |
Commercial Manager |
|
Contact No.: |
91-80-40919082 |
|
Date : |
24.06.2014 |
LOCATIONS
|
Registered Office : |
Plot No.18, Sagar Society, Street No.1, Road No.2, Banjara Hills, Hyderabad
– 500034, Andhra Pradesh, India |
|
Tel. No.: |
Not Available |
|
Fax No.: |
Not Available |
|
E-Mail : |
|
|
Website : |
|
|
Location : |
Owned |
|
Locality : |
Commercial |
|
|
|
|
Corporate Office : |
1914, 2nd Floor, C Cross, 25th A Main Road,
Jayanagar, 9th Block East, Bangalore – 560069, Karnataka, India |
|
Tel. No.: |
91-80-+40919082 |
|
|
|
|
Factory : |
Ravivalasa Village, Tekkali Mandal, Srikakulam District – 532212,
Andhra Pradesh, India |
DIRECTORS
As on: 31.03.2013
|
Name : |
Sri Rajiv Saxena |
|
Designation : |
Chairman |
|
|
|
|
Name : |
Smt Sarita Boorugu |
|
Designation : |
Vice Chairperson |
|
|
|
|
Name : |
Sri Prashant Boorugu |
|
Designation : |
Managing Director |
|
|
|
|
Name : |
Sri S Gajendran |
|
Designation : |
Director |
|
|
|
|
Name : |
Sri M V Bhaskara Rao IPS (Retd.) |
|
Designation : |
Director |
|
|
|
|
Name : |
Sri K Mallikarjuna Rao |
|
Designation : |
Director |
|
|
|
|
Name : |
Sri S Venkataraman |
|
Designation : |
Whole time Director (Marketing) |
KEY EXECUTIVES
|
Name : |
Sri Ramaswamy .K |
|
Designation : |
Company Secretary |
MAJOR SHAREHOLDERS / SHAREHOLDING PATTERN
As on: 31.03.2014
|
Category of Shareholder |
Total
No. of Shares |
Total
Shareholding as a % of Total No. of Shares |
|
As
a % of (A+B) |
||
|
(A)
Shareholding of Promoter and Promoter Group |
||
|
|
|
|
|
|
6000000 |
8.52 |
|
|
2902070 |
4.12 |
|
|
8902070 |
12.64 |
|
|
|
|
|
|
43292205 |
61.47 |
|
|
43292205 |
61.47 |
|
Total
shareholding of Promoter and Promoter Group (A) |
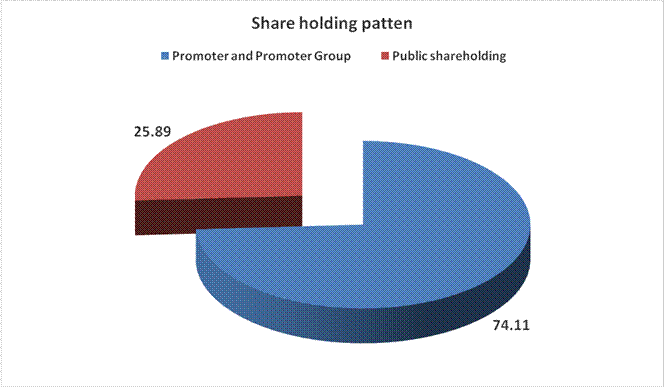
52194275 |
74.11 |
|
(B)
Public Shareholding |
||
|
|
|
|
|
|
2660 |
0.00 |
|
|
1188085 |
1.69 |
|
|
1190745 |
1.69 |
|
|
|
|
|
|
3145092 |
4.47 |
|
|
|
|
|
|
7542303 |
10.71 |
|
|
4924259 |
6.99 |
|
|
1429801 |
2.03 |
|
|
1203193 |
1.71 |
|
|
760 |
0.00 |
|
|
222394 |
0.32 |
|
|
3454 |
0.00 |
|
|
17041455 |
24.20 |
|
Total
Public shareholding (B) |
18232200 |
25.89 |
|
Total
(A)+(B) |
70426475 |
100.00 |
|
(C)
Shares held by Custodians and against which Depository Receipts have been
issued |
0 |
0.00 |
|
|
0 |
0.00 |
|
|
0 |
0.00 |
|
|
0 |
0.00 |
|
Total
(A)+(B)+(C) |
70426475 |
0.00 |
BUSINESS DETAILS
|
Line of Business : |
Manufacturer and Exporter of High Carbon Ferro – Chrome used in
Stainless Steel Industry. |
|
|
|
|
Products : |
|
|
|
|
|
Exports : |
|
|
Products : |
Finished Goods |
|
Countries : |
European Countries |
|
|
|
|
Imports : |
|
|
Products : |
Raw Materials |
|
Countries : |
Gulf Countries |
|
|
|
|
Terms : |
|
|
Selling : |
L/C and Credit |
|
|
|
|
Purchasing : |
L/C and Credit |
GENERAL INFORMATION
|
Customers : |
End Users |
||||||||||||||||||||||||||||||
|
|
|
||||||||||||||||||||||||||||||
|
No. of Employees : |
300 (Approximately) |
||||||||||||||||||||||||||||||
|
|
|
||||||||||||||||||||||||||||||
|
Bankers : |
State Bank of Travancore, Commercial Branch, III Floor,
Vayudhoot Chambers, Mahatma Gandhi Road, Bangalore - 560001, Karnataka,
India |
||||||||||||||||||||||||||||||
|
|
|
||||||||||||||||||||||||||||||
|
Facilities : |
(Rs.
In Millions)
|
||||||||||||||||||||||||||||||
|
|
|
||||||||||||||||||||||||||||||
|
Banking
Relations : |
-- |
||||||||||||||||||||||||||||||
|
|
|
||||||||||||||||||||||||||||||
|
Financial Institute : |
Reliance Capital Limited |
||||||||||||||||||||||||||||||
|
|
|
||||||||||||||||||||||||||||||
|
Auditors : |
|
||||||||||||||||||||||||||||||
|
Name : |
S Venkatadri and Company Chartered Accountants |
||||||||||||||||||||||||||||||
|
Address : |
1408, Babukhan Estate, Basheerbagh, Hyderabad – 500001,
Andhra Pradesh, India |
||||||||||||||||||||||||||||||
|
|
|
||||||||||||||||||||||||||||||
|
Registrar and Share
Transfer Agents |
Karvy Computershare Private limited, Plot # 17-24, Vittal
Rao Nagar, Madhapur, Hyderabad – 500081, Andhra Pradesh, India |
||||||||||||||||||||||||||||||
|
|
|
||||||||||||||||||||||||||||||
|
Ultimate Holding
company : |
Mynah Industries Limited |
CAPITAL STRUCTURE
As on: 31.03.2013
Authorised Capital:
|
No. of Shares |
Type |
Value |
Amount |
|
|
|
|
|
|
191000000 |
Equity Shares |
Rs.2/- each |
Rs.382.000 Millions |
|
8000000 |
Cumulative Redeemable Preference Shares |
Rs.11/- each |
Rs.88.000 Millions |
|
|
|
|
|
|
|
Total |
|
Rs.470.000
Millions |
Issued, Subscribed & Paid-up Capital:
|
No. of Shares |
Type |
Value |
Amount |
|
|
|
|
|
|
70426475 |
Equity Shares |
Rs.2/- each |
Rs.140.853 Millions |
|
7864700 |
Cumulative Redeemable Preference Shares |
Rs.11/- each |
Rs.86.512 Millions |
|
|
|
|
|
|
|
Total |
|
Rs.227.365
Millions |
a) Reconciliation of the
Shares outstanding at the beginning and at the end of the Year are as follows:
|
Particulars |
Equity Shares As on 31.03.2013 |
Preference Shares As on 31.03.2013 |
|
Shares outstanding at the beginning of the year |
61426475 |
7864700 |
|
Shares Issued during the year |
9000000 |
- |
|
Shares redeemed / bought back during the year |
- |
- |
|
Shares outstanding at the end of the year |
70426475 |
7864700 |
(b) Rights attached
to Equity Shares:
The company has only one class of equity shares having a face value of Rs.2/- per share with one vote per each equity share. The company declares and pays dividends in Indian rupees. The dividend proposed by the Board of directors is subject to the approval of the shareholders in the ensuing Annual General Meeting.
The amount of dividend proposed to be distributed for the year ended 31st March 2013, to equity share holders is Rs.0.10 per Share of Rs.2 each (2011-12 Rs.0.10 Per Share of Rs.2each).
In the event of liquidation of the Company, the holders of equity shares will be entitled to receive remaining assets of the company, after distribution of all preferential amounts. The distribution will be in proportionate to the number of equity shares held by the shareholders.
(c) Details of shareholders holding more than 5% of Equity shares in
the company are as follows:
|
Name of Shareholder |
As on 31.03.2013 |
|
|
|
No. of Shares held |
% of Holding |
|
Cronimet Mercon Invest Limited, Dubai |
43292205 |
61.47% |
(d) Details of
Cumulative redeemable Preference Shares:
|
Nature |
Amount |
Date of Issue |
Date of Redemption |
|
8% Cumulative Redeemable Preference Shares of Rs.11/- each |
86.512 |
14.08.2014 |
14.08.2015 |
|
Total |
86.512 |
|
|
FINANCIAL DATA
[All figures are
in Rupees Millions]
ABRIDGED BALANCE
SHEET
|
SOURCES
OF FUNDS |
31.03.2013 |
31.03.2012 |
31.03.2011 |
|
I.
EQUITY AND LIABILITIES |
|
|
|
|
(1)Shareholders' Funds |
|
|
|
|
(a) Share Capital |
227.365 |
209.365 |
209.365 |
|
(b) Reserves & Surplus |
831.307 |
477.222 |
316.967 |
|
(c) Money
received against share warrants |
0.000 |
135.000 |
135.000 |
|
|
|
|
|
|
(2)
Share Application money pending allotment |
0.000 |
0.000 |
0.000 |
|
Total Shareholders’ Funds (1) + (2) |
1058.672 |
821.587 |
661.332 |
|
|
|
|
|
|
(3)
Non-Current Liabilities |
|
|
|
|
(a)
long-term borrowings |
1.839 |
7.137 |
0.000 |
|
(b) Deferred tax
liabilities (Net) |
40.413 |
40.507 |
38.039 |
|
(c)
Other long term liabilities |
0.000 |
0.000 |
0.000 |
|
(d)
long-term provisions |
0.000 |
0.000 |
0.000 |
|
Total
Non-current Liabilities (3) |
42.252 |
47.644 |
38.039 |
|
|
|
|
|
|
(4) Current Liabilities |
|
|
|
|
(a)
Short term borrowings |
299.633 |
299.366 |
365.152 |
|
(b)
Trade payables |
64.008 |
84.430 |
79.565 |
|
(c)
Other current liabilities |
62.490 |
100.825 |
85.051 |
|
(d)
Short-term provisions |
93.614 |
85.084 |
83.883 |
|
Total
Current Liabilities (4) |
519.745 |
569.705 |
613.651 |
|
|
|
|
|
|
TOTAL |
1620.669 |
1438.936 |
1313.022 |
|
|
|
|
|
|
II.
ASSETS |
|
|
|
|
(1) Non-current assets |
|
|
|
|
(a)
Fixed Assets |
|
|
|
|
(i)
Tangible assets |
196.414 |
218.290 |
223.103 |
|
(ii)
Intangible Assets |
0.000 |
0.000 |
0.000 |
|
(iii)
Capital work-in-progress |
93.349 |
71.433 |
31.253 |
|
(iv) Intangible assets under
development |
0.000 |
0.000 |
0.000 |
|
(b)
Non-current Investments |
0.161 |
0.155 |
0.175 |
|
(c)
Deferred tax assets (net) |
0.000 |
0.000 |
0.000 |
|
(d) Long-term Loan and Advances |
304.996 |
178.482 |
256.039 |
|
(e)
Other Non-current assets |
0.000 |
0.000 |
0.000 |
|
Total
Non-Current Assets |
594.920 |
468.360 |
510.570 |
|
|
|
|
|
|
(2) Current assets |
|
|
|
|
(a)
Current investments |
0.000 |
0.000 |
1.534 |
|
(b)
Inventories |
227.432 |
344.921 |
368.983 |
|
(c)
Trade receivables |
379.437 |
333.410 |
260.222 |
|
(d)
Cash and cash equivalents |
25.959 |
17.835 |
12.801 |
|
(e)
Short-term loans and advances |
366.929 |
265.469 |
155.550 |
|
(f)
Other current assets |
25.992 |
8.941 |
3.362 |
|
Total
Current Assets |
1025.749 |
970.576 |
802.452 |
|
|
|
|
|
|
TOTAL |
1620.669 |
1438.936 |
1313.022 |
PROFIT & LOSS
ACCOUNT
|
|
PARTICULARS |
31.03.2013 |
31.03.2012 |
31.03.2011 |
|
|
SALES |
|
|
|
|
|
Revenue from Operations |
2230.191 |
2500.147 |
1739.852 |
|
|
Other Income |
1.136 |
6.643 |
3.801 |
|
|
TOTA |
2231.327 |
2506.790 |
1743.653 |
|
|
|
|
|
|
|
Less |
EXPENSES |
|
|
|
|
|
Cost of Materials
Consumed |
524.048 |
885.491 |
1103.129 |
|
|
Purchase of Traded Goods |
1133.474 |
983.929 |
46.074 |
|
|
(Increase)/Decrease in
Inventories |
15.123 |
(28.947) |
(122.527) |
|
|
Employees benefits
expense |
53.371 |
52.891 |
52.919 |
|
|
Other expenses |
297.900 |
345.911 |
411.475 |
|
|
TOTAL |
2023.916 |
2239.275 |
1491.070 |
|
|
|
|
|
|
|
PROFIT/ (LOSS) BEFORE INTEREST, TAX, DEPRECIATION AND
AMORTISATION |
207.411 |
267.515 |
252.583 |
|
|
|
|
|
|
|
|
Less |
FINANCIAL EXPENSES |
63.956 |
63.539 |
29.726 |
|
|
|
|
|
|
|
|
PROFIT / (LOSS) BEFORE
TAX, DEPRECIATION AND AMORTISATION |
143.455 |
203.976 |
222.857 |
|
|
|
|
|
|
|
Less/ Add |
DEPRECIATION/
AMORTISATION |
25.128 |
26.069 |
22.480 |
|
|
|
|
|
|
|
|
PROFIT/ (LOSS) BEFORE TAX |
118.327 |
177.907 |
200.377 |
|
|
|
|
|
|
|
Less |
TAX |
(0.095) |
2.469 |
66.458 |
|
|
|
|
|
|
|
|
PROFIT/ (LOSS) AFTER TAX |
118.422 |
175.438 |
133.919 |
|
|
|
|
|
|
|
Add |
PREVIOUS YEARS’ BALANCE
BROUGHT FORWARD |
317.983 |
157.728 |
38.992 |
|
|
|
|
|
|
|
Less |
APPROPRIATIONS |
|
|
|
|
|
Preference dividend |
6.921 |
6.921 |
6.921 |
|
|
Corporate Dividend
Tax-Preference |
1.176 |
1.123 |
1.123 |
|
|
Equity Dividend |
7.043 |
6.143 |
6.143 |
|
|
Corporate Dividend
Tax-Equity |
1.197 |
0.996 |
0.996 |
|
|
Balance Carried to the
B/S |
420.068 |
317.983 |
157.728 |
|
|
|
|
|
|
|
|
EARNINGS IN FOREIGN
CURRENCY |
|
|
|
|
|
F.O.B. Value of Exports |
165.415 |
180.932 |
93.135 |
|
|
|
|
|
|
|
|
IMPORTS |
|
|
|
|
|
CIF Value of Imports |
41.950 |
94.423 |
90.494 |
|
|
|
|
|
|
|
|
Earnings / (Loss) Per
Share (Rs.) |
1.51 |
2.24 |
1.71 |
QUARTERLY / SUMMARISED
RESULTS
|
PARTICULARS |
June 2013 |
Sep 2013 |
Dec 2013 |
Mar 2014 |
|
|
Unaudited |
Unaudited |
Unaudited |
Unaudited |
|
Net Sales |
1737.400 |
844.300 |
425.800 |
408.300 |
|
Total Expenditure |
1643.100 |
799.300 |
394.700 |
337.400 |
|
PBIDT (Excl OI) |
94.300 |
45.000 |
31.100 |
70.900 |
|
Other Income |
0.100 |
0.000 |
0.000 |
0.000 |
|
Operating Profit |
94.400 |
45.000 |
31.100 |
70.900 |
|
Interest |
19.900 |
12.700 |
12.400 |
24.500 |
|
PBDT |
74.500 |
32.300 |
18.700 |
46.400 |
|
Depreciation |
5.800 |
5.500 |
5.800 |
8.400 |
|
Profit Before Tax |
68.700 |
26.800 |
12.800 |
38.000 |
|
Profit After Tax |
68.700 |
26.800 |
12.800 |
38.000 |
|
Net Profit |
68.700 |
26.800 |
12.800 |
38.000 |
KEY RATIOS
|
PARTICULARS |
|
31.03.2013 |
31.03.2012 |
31.03.2011 |
|
PAT / Total Income |
(%) |
5.31 |
7.00 |
7.68 |
|
|
|
|
|
|
|
Net Profit Margin (PBT/Sales) |
(%) |
5.31 |
7.12 |
11.52 |
|
|
|
|
|
|
|
Return on Total Assets (PBT/Total Assets} |
(%) |
7.75 |
13.01 |
15.63 |
|
|
|
|
|
|
|
Return on Investment (ROI) (PBT/Networth) |
|
0.11 |
0.22 |
0.30 |
|
|
|
|
|
|
|
Debt Equity Ratio (Total Debt/Networth) |
|
0.28 |
0.37 |
0.55 |
|
|
|
|
|
|
|
Current Ratio (Current Asset/Current Liability) |
|
1.97 |
1.70 |
1.31 |
FINANCIAL ANALYSIS
[All figures are
in Rupees Millions]
DEBT EQUITY RATIO
|
Particular |
31.03.2011 |
31.03.2012 |
31.03.2013 |
|
|
(Rs. In Millions) |
(Rs. In Millions) |
(Rs. In Millions) |
|
Share Capital |
209.365 |
209.365 |
227.365 |
|
Reserves & Surplus |
316.967 |
477.222 |
831.304 |
|
Money received against share warrants |
135.000 |
135.000 |
0.000 |
|
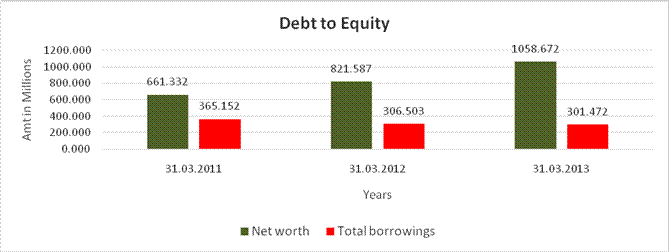
Net worth |
661.332 |
821.587 |
1058.672 |
|
|
|
|
|
|
long-term borrowings |
0.000 |
7.137 |
1.839 |
|
Short term borrowings |
365.152 |
299.366 |
299.633 |
|
Total borrowings |
365.152 |
306.503 |
301.472 |
|
Debt/Equity ratio |
0.552 |
0.373 |
0.285 |
YEAR-ON-YEAR GROWTH
|
Year on Year Growth |
31.03.2011 |
31.03.2012 |
31.03.2013 |
|
|
(Rs. In Millions) |
(Rs. In Millions) |
(Rs. In Millions) |
|
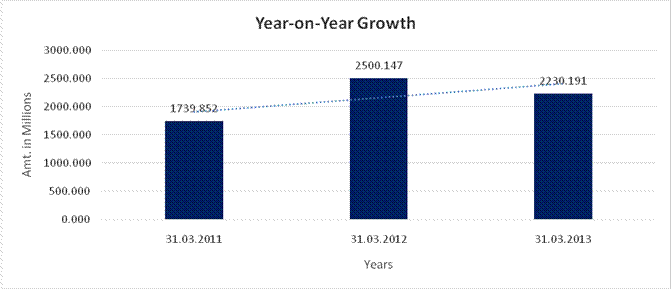
Revenue from Operations |
1739.852 |
2500.147 |
2230.191 |
|
|
|
43.699 |
(10.798) |
NET PROFIT MARGIN
|
Net Profit Margin |
31.03.2011 |
31.03.2012 |
31.03.2013 |
|
|
(Rs. In Millions) |
(Rs. In Millions) |
(Rs. In Millions) |
|
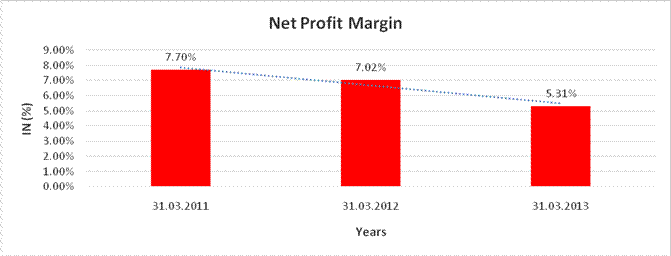
Revenue from Operations |
1739.852 |
2500.147 |
2230.191 |
|
Profit |
133.919 |
175.438 |
118.422 |
|
|
7.70% |
7.02% |
5.31% |
LOCAL AGENCY FURTHER INFORMATION
|
Sr. No. |
Check List by Info
Agents |
Available in Report
(Yes / No) |
|
1] |
Year of Establishment |
Yes |
|
2] |
Locality of the firm |
Yes |
|
3] |
Constitutions of the firm |
Yes |
|
4] |
Premises details |
No |
|
5] |
Type of Business |
Yes |
|
6] |
Line of Business |
Yes |
|
7] |
Promoter's background |
No |
|
8] |
No. of employees |
Yes |
|
9] |
Name of person contacted |
Yes |
|
10] |
Designation of contact person |
Yes |
|
11] |
Turnover of firm for last three years |
Yes |
|
12] |
Profitability for last three years |
Yes |
|
13] |
Reasons for variation <> 20% |
-- |
|
14] |
Estimation for coming financial year |
No |
|
15] |
Capital in the business |
Yes |
|
16] |
Details of sister concerns |
Yes |
|
17] |
Major suppliers |
No |
|
18] |
Major customers |
No |
|
19] |
Payments terms |
Yes |
|
20] |
Export / Import details (if applicable) |
Yes |
|
21] |
Market information |
-- |
|
22] |
Litigations that the firm / promoter involved in |
-- |
|
23] |
Banking Details |
Yes |
|
24] |
Banking facility details |
Yes |
|
25] |
Conduct of the banking account |
-- |
|
26] |
Buyer visit details |
-- |
|
27] |
Financials, if provided |
Yes |
|
28] |
Incorporation details, if applicable |
Yes |
|
29] |
Last accounts filed at ROC |
Yes |
|
30] |
Major Shareholders, if available |
Yes |
|
31] |
Date of Birth of Proprietor/Partner/Director, if available |
No |
|
32] |
PAN of Proprietor/Partner/Director, if available |
No |
|
33] |
Voter ID No of Proprietor/Partner/Director, if available |
No |
|
34] |
External Agency Rating, if available |
No |
REVIEW OF OPERATIONS
AND PERFORMANCE
Demand for Ferro Alloys is driven by steel industry, which consumes about 90 % of Ferro alloys and accordingly the Prospects for Ferro alloys industry is directly linked to the performance of steel industry and its cycles. The emerging Economies like India and China are the prime movers of the demand for steel and in turn for Ferro alloys.
Most Ferro Alloy producers in India are currently passing through a difficult situation due to maximum availability of quality power increase in power cost and declining profitability. The company is no exception to these phenomena. In view of above the Company could achieve a production of 12424 MT of Ferro Alloys products as against 21572 MT during the previous year, a decrease of 42.40%. In order to meet the gap between demand and supply, the company has chosen to outsource Ferro Alloys from other manufacturers. The total income including sales turnover of Ferro Alloys and steel products was Rs.2232.326 Millions during the year as compared to Rs.2506.789 Millions during previous year. The Company has registered a Net Profit after tax of Rs.118.421 Millions against Rs.175.438 Millions during the previous year. As the power situation is improving in the current financial year, the Company is confident of achieving a better performance.
MANAGEMENT DISCUSSION
AND ANALYSIS
INDUSTRY STRUCTURE
The Ferro Alloys products manufactured by the Company is not an FMCG product, Ferro Alloys are used to add characteristics of anticorrosion and deoxidization in Stainless Steel. Hence the prospects of Ferro Alloys Industry is inter twined with the growth of steel industry.
PROSPECTS
The growth prospect of Ferro Alloys Industry is directly proportional to growth of Steel Industry. Infrastructure, Auto and Heavy Industries are the major consumers of Steel. Hence all developing countries are major customers of all types of steel for their growth. The fortunes for Ferro Alloys Industry seem bright and it is expected that demand for Steel shall be doubled by 2015. According to the world Steel forecast, Steel demand in India is expected to grow @ CAGR of 9-10 % and the growth of Ferro Alloys Industry will also be on the similar lines.
AUDITED FINANCIAL RESULTS FOR THE QUARTER AND YEAR ENDED 31ST
MARCH 2014
|
|
|
Quarter Ended |
Year Ended |
|
|
Particulars |
31.03.2014 |
31.12.2013 |
31.03.2014 |
|
|
Audited |
Un-audited |
Audited |
||
|
1 |
Income from operations |
|
|
|
|
|
(a) Net sales/income from operations (Net of
excise duty) |
408.105 |
425.757 |
3415.085 |
|
|
(b) Other operating income |
0.177 |
0.030 |
0.759 |
|
|
Total income |
408.282 |
425.787 |
3415.844 |
|
2 |
Expenses |
|
|
|
|
|
(a) Cost of materials consumed |
183.759 |
144.458 |
631.863 |
|
|
(b) Purchases of stock-in-trade |
204.574 |
160.736 |
2362.860 |
|
|
(c) Changes in inventories of finished
goods, work-in-progress and
stock-in-trade |
(129.032) |
(36.557) |
(357.960) |
|
|
(d) Employee benefits expenses |
15.093 |
13.744 |
53.282 |
|
|
(e) Depreciation and amortization expenses |
8.376 |
5.825 |
25.451 |
|
|
(f) Other expenses |
63.040 |
112.354 |
484.547 |
|
|
Total Expenses |
345.810 |
400.560 |
3200.036 |
|
3 |
Profit from operations before other Income, finance costs and exceptional items |
62.472 |
25.226 |
215.808 |
|
4 |
Other income |
0.000 |
0.000 |
0.000 |
|
5 |
Profit from ordinary activities before finance costs and exceptional items |
62.472 |
25.226 |
215.808 |
|
6 |
Finance costs |
24.466 |
12.383 |
69.493 |
|
7 |
Profit from ordinary activities after finance costs but before exceptional items |
38.007 |
12.844 |
146.314 |
|
8 |
Tax expenses |
|
|
|
|
|
i) Current tax |
|
|
|
|
|
ii) Deferred tax |
|
|
|
|
9 |
Net Profit from ordinary activities after Tax |
38.007 |
12.844 |
146.314 |
|
10 |
Extra ordinary items ( net of expenditure) |
|
|
|
|
11 |
Net Profit |
38.007 |
12.844 |
146.314 |
|
12 |
Paid-up equity share capital (Equity share
of Rs.2/- each) |
|
|
|
|
13 |
Reserves excluding Revaluation Reserves as
per Balance sheet of previous year ending |
|
|
|
|
14 |
Earnings per share before and after extraordinary items (Not Annualized) |
|
|
|
|
|
(a) Basic |
2.03 |
0.15 |
2.03 |
|
|
(b) Diluted |
2.03 |
0.15 |
2.03 |
|
|
|
|
|
|
|
A |
PARTICULARS OF SHAREHOLDING |
|
|
|
|
|
Public shareholding |
|
|
|
|
|
- Number of shares |
18232200 |
18232200 |
18232200 |
|
|
- Percentage of shareholding |
25.89 |
25.89 |
25.89 |
|
|
|
|
|
|
|
2 |
Promoters and Promoter Group Shareholding |
|
|
|
|
|
(a) Pledged / Encumbered |
|
|
|
|
|
- Number of shares |
- |
- |
- |
|
|
- Percentage of shares (as a % of the total Shareholding of promoter and promoter group) |
- |
- |
- |
|
|
- Percentage of shares (as a % of the total Share capital of the company) |
- |
- |
- |
|
|
(b) Non - encumbered |
|
|
|
|
|
- Number of shares |
52194275 |
52194275 |
52194275 |
|
|
- Percentage of shares (as a % of the total Shareholding of promoter and promoter group) |
100.00 |
100.00 |
100.00 |
|
|
- Percentage of shares (as a % of the total share capital of the company) |
74.11 |
74.11 |
74.11 |
|
|
|
|
|
|
AUDITED BALANCE SHEET AS ON 31ST MARCH 2014
|
Sl. No |
Particulars |
|
AS ON 31.03.2014 |
|
I. |
Equity and Liabilities |
|
|
|
|
|
|
|
|
|
1. Shareholders’ Funds |
|
|
|
|
a) Share Capital |
|
227.365 |
|
|
b) Reserves & Surplus |
|
964.463 |
|
|
c) Money received against share warrants |
|
0.000 |
|
|
|
|
1191.828 |
|
|
|
|
|
|
|
2. Non-Current Liabilities |
|
|
|
|
(a) Long Term Borrowings |
|
3.741 |
|
|
(b) Deferred Tax Liability (Net) |
|
35.586 |
|
|
|
|
39.327 |
|
|
|
|
|
|
|
3. Current Liabilities |
|
|
|
|
(a) Short Term Borrowings |
|
289.816 |
|
|
(b) Trade Payables |
|
139.507 |
|
|
(c) Other Current Liabilities |
|
71.804 |
|
|
(d) Short Term Provisions |
|
94.028 |
|
|
|
|
595.155 |
|
|
|
|
|
|
|
TOTAL |
|
1826.310 |
|
|
|
|
|
|
II. |
Assets |
|
|
|
|
1. Non-Current Assets |
|
|
|
|
(a) Fixed Assets |
|
|
|
|
(i) Tangible Assets |
|
190.306 |
|
|
(ii) Intangible Assets |
|
0.000 |
|
|
(iii) Capital Work in Progress |
|
126.093 |
|
|
(b) Non-Current Investments |
|
0.211 |
|
|
(c) Long Term Loans & Advances |
|
277.427 |
|
|
|
|
594.037 |
|
|
|
|
|
|
|
2. Current Assets |
|
|
|
|
(a) Current Investments |
|
0.000 |
|
|
(b) Inventories |
|
656.905 |
|
|
(c)Trade Receivables |
|
353.166 |
|
|
(d) Cash and Cash Equivalents |
|
23.801 |
|
|
(e) Short Term Loans & Advances |
|
182.284 |
|
|
(f) Other Current Assets |
|
16.116 |
|
|
|
|
1232.272 |
|
|
|
|
|
|
|
TOTAL |
|
1826.310 |
|
|
Particulars |
|
|
|
|
|
|
B |
INVESTOR COMPLAINTS |
|
|
|
|
|
|
|
Pending at the beginning of the quarter |
0 |
|
|
Received during the quarter |
9 |
|
|
Disposed of during the quarter |
9 |
|
|
Remaining unresolved at the end of the
quarter |
0 |
|
|
|
|
Notes:
- The above audited financial results were reviewed by the Audit Committee and approved by the Board of Directors at its Meeting held on 29.05.2014.
- The figures of the previous quarters/year have been regrouped and reclassified wherever necessary.
- The company operates in single segment.
- Provision for Income Tax is not made in view of set off available from the ongoing amalgamation pending before the Hon'ble High Court of A.P.
- The Board has recommended Dividend @ 6% on equity shares.
INDEX OF CHARGES
|
S.No. |
Charge ID |
Date of Charge
Creation/Modification |
Charge amount
secured |
Charge Holder |
Address |
Service Request
Number (SRN) |
|
1 |
10319672 |
05/11/2011 |
400,000,000.00 |
STATE BANK OF TRAVANCORE |
COMMERCIAL BRANCH, III FLOOR, VAYUDHOOT CHAMBERS, MAHATMA GANDHI ROAD, BANGALORE - 560001, KARNATAKA, INDIA |
B26058685 |
|
2 |
10226585 |
05/11/2011 * |
750,000,000.00 |
STATE BANK OF TRAVANCORE |
COMMERCIAL BRANCH, III FLOOR, VAYUDHOOT CHAMBERS, MAHATMA GANDHI ROAD, BANGALORE - 560001, KARNATAKA, INDIA |
B25848003 |
* Date of charge modification
FIXED ASSETS
- Plant and
Machinery
- Electrical
Equipment
- Material
Handling Equipment
- Pollution
Control Equipment
- Workshop
Scale Equipment
- Lab Equipment
- Weighing
Scale Equipment
- Fire Fight
Equipment
- 132 KV Sub
Station
- Furniture and
Fixture
- Office
Equipment
- Computer
Equipment
- vehicles
CMT REPORT (Corruption, Money Laundering & Terrorism]
The Public Notice information has been collected from various sources including
but not limited to: The Courts, India Prisons Service, Interpol, etc.
1] INFORMATION ON
DESIGNATED PARTY
No exist designating subject or any of its beneficial owners,
controlling shareholders or senior officers as terrorist or terrorist organization
or whom notice had been received that all financial transactions involving
their assets have been blocked or convicted, found guilty or against whom a
judgement or order had been entered in a proceedings for violating
money-laundering, anti-corruption or bribery or international economic or
anti-terrorism sanction laws or whose assets were seized, blocked, frozen or
ordered forfeited for violation of money laundering or international
anti-terrorism laws.
2] Court Declaration:
No records exist to suggest that subject is
or was the subject of any formal or informal allegations, prosecutions or other
official proceeding for making any prohibited payments or other improper
payments to government officials for engaging in prohibited transactions or with
designated parties.
3] Asset Declaration:
No records exist to suggest that the property or assets of the subject
are derived from criminal conduct or a prohibited transaction.
4] Record on Financial
Crime:
Charges or conviction
registered against subject: None
5] Records on Violation of
Anti-Corruption Laws:
Charges or
investigation registered against subject: None
6] Records on Int’l
Anti-Money Laundering Laws/Standards:
Charges or
investigation registered against subject: None
7] Criminal Records
No
available information exist that suggest that subject or any of its principals
have been formally charged or convicted by a competent governmental authority
for any financial crime or under any formal investigation by a competent government
authority for any violation of anti-corruption laws or international anti-money
laundering laws or standard.
8] Affiliation with
Government:
No record
exists to suggest that any director or indirect owners, controlling
shareholders, director, officer or employee of the company is a government
official or a family member or close business associate of a Government
official.
9] Compensation Package:
Our market
survey revealed that the amount of compensation sought by the subject is fair
and reasonable and comparable to compensation paid to others for similar
services.
10] Press Report:
No press reports / filings exists on
the subject.
CORPORATE GOVERNANCE
MIRA INFORM as part of its Due Diligence do provide comments on
Corporate Governance to identify management and governance. These factors often
have been predictive and in some cases have created vulnerabilities to credit
deterioration.
Our Governance Assessment focuses principally on the interactions
between a company’s management, its Board of Directors, Shareholders and other
financial stakeholders.
CONTRAVENTION
Subject is not known to have contravened any existing local laws,
regulations or policies that prohibit, restrict or otherwise affect the terms and
conditions that could be included in the agreement with the subject.
FOREIGN EXCHANGE RATES
|
Currency |
Unit
|
Indian Rupees |
|
US Dollar |
1 |
Rs.60.28 |
|
UK Pound |
1 |
Rs.102.28 |
|
Euro |
1 |
Rs.82.05 |
INFORMATION DETAILS
|
Information Gathered
by : |
SUB |
|
|
|
|
Analysis Done by
: |
PLK |
|
|
|
|
Report Prepared
by : |
VNK |
SCORE & RATING EXPLANATIONS
|
SCORE FACTORS |
RANGE |
POINTS |
|
HISTORY |
1~10 |
5 |
|
PAID-UP CAPITAL |
1~10 |
5 |
|
OPERATING SCALE |
1~10 |
5 |
|
FINANCIAL CONDITION |
|
|
|
--BUSINESS SCALE |
1~10 |
5 |
|
--PROFITABILIRY |
1~10 |
5 |
|
--LIQUIDITY |
1~10 |
5 |
|
--LEVERAGE |
1~10 |
5 |
|
--RESERVES |
1~10 |
5 |
|
--CREDIT LINES |
1~10 |
5 |
|
--MARGINS |
-5~5 |
-- |
|
DEMERIT POINTS |
|
|
|
--BANK CHARGES |
YES/NO |
YES |
|
--LITIGATION |
YES/NO |
NO |
|
--OTHER ADVERSE INFORMATION |
YES/NO |
NO |
|
MERIT POINTS |
|
|
|
--SOLE DISTRIBUTORSHIP |
YES/NO |
NO |
|
--EXPORT ACTIVITIES |
YES/NO |
YES |
|
--AFFILIATION |
YES/NO |
YES |
|
--LISTED |
YES/NO |
YES |
|
--OTHER MERIT FACTORS |
YES/NO |
YES |
|
DEFAULTER |
|
|
|
--RBI |
YES/NO |
NO |
|
--EPF |
YES/NO |
NO |
|
TOTAL |
|
45 |
This score serves as a reference to assess
SC’s credit risk and to set the amount of credit to be extended. It is calculated
from a composite of weighted scores obtained from each of the major sections of
this report. The assessed factors and their relative weights (as indicated
through %) are as follows:
Financial
condition (40%) Ownership
background (20%) Payment record
(10%)
Credit history
(10%) Market trend (10%) Operational size
(10%)
RATING EXPLANATIONS
|
RATING |
STATUS |
PROPOSED CREDIT LINE |
|
|
>86 |
Aaa |
Possesses an extremely sound
financial base with the strongest capability for timely payment of interest
and principal sums |
Unlimited |
|
71-85 |
Aa |
Possesses adequate
working capital. No caution needed for credit transaction. It has above average
(strong) capability for payment of interest and principal sums |
Large |
|
56-70 |
A |
Financial &
operational base are regarded healthy. General unfavourable factors will not
cause fatal effect. Satisfactory capability for payment of interest and principal
sums |
Fairly
Large |
|
41-55 |
Ba |
Overall operation is
considered normal. Capable to meet normal commitments. |
Satisfactory |
|
26-40 |
B |
Capability to overcome
financial difficulties seems comparatively below average. |
Small |
|
11-25 |
Ca |
Adverse factors are
apparent. Repayment of interest and principal sums in default or expected to
be in default upon maturity |
Limited
with full security |
|
<10 |
C |
Absolute credit risk
exists. Caution needed to be exercised |
Credit
not recommended |
|
-- |
NB |
New
Business |
-- |
This report is issued at your request without any
risk and responsibility on the part of MIRA INFORM PRIVATE LIMITED (MIPL)
or its officials.