MIRA INFORM REPORT
|
Report Date : |
28.06.2014 |
IDENTIFICATION DETAILS
|
Name : |
MMTC LIMITED |
|
|
|
|
Registered
Office : |
Core- 1 Scope Complex 7 Institutional Area, Lodhi Road, New Delhi –
110003, Delhi. |
|
|
|
|
Country : |
India |
|
|
|
|
Financials (as
on) : |
31.03.2013 |
|
|
|
|
Date of
Incorporation : |
26.09.1953 |
|
|
|
|
Com. Reg. No.: |
004033 |
|
|
|
|
Capital
Investment / Paid-up Capital : |
Rs.1000.000 Millions |
|
|
|
|
CIN No.: [Company Identification
No.] |
L51909DL1963GOI004033 |
|
|
|
|
TAN No.: [Tax Deduction &
Collection Account No.] |
DELM09574F, DELM09969B, DELM10208C, DELM13098B |
|
|
|
|
PAN No.: [Permanent Account No.] |
AAACM1433E |
|
|
|
|
Legal Form : |
Public limited liability company. The company’s shares are listed on
the stock Exchanges |
|
|
|
|
Line of Business
: |
Exporter and importer of
Minerals and Metals |
|
|
|
|
No. of Employees
: |
1605 (Approximately) (602 Officers + 1003 staff) |
RATING & COMMENTS
|
MIRA’s Rating : |
Ba (50) |
|
RATING |
STATUS |
PROPOSED CREDIT LINE |
|
|
41-55 |
Ba |
Overall operation is considered normal. Capable to meet normal
commitments. |
Satisfactory |
|
Maximum Credit Limit : |
USD 53000000 |
|
|
|
|
Status : |
Good |
|
|
|
|
Payment Behaviour : |
Regular |
|
|
|
|
Litigation : |
Exist |
|
|
|
|
Comments : |
Subject is a Government of India Company. It is an old and established
company having good track record Company has incurred loss from its operation in the year 2013.
However, rating is strengthen on account of ownership by Government of India
and established track record of trading in diverse commodities. Trade relation reported to be fair. Business is active. Payment terms
are reported to be regular and as per commitment. In view of government support, the company can be considered normal
for business dealing at usual trade terms and conditions. |
NOTES :
Any query related to this report can be made on
e-mail: infodept@mirainform.com
while quoting report number, name and date.
ECGC Country Risk Classification List – March 31, 2014
|
Country Name |
Previous Rating (31.12.2013) |
Current Rating (31.03.2014) |
|
India |
A1 |
A1 |
|
Risk Category |
ECGC
Classification |
|
Insignificant |
A1 |
|
Low |
A2 |
|
Moderate |
B1 |
|
High |
B2 |
|
Very High |
C1 |
|
Restricted |
C2 |
|
Off-credit |
D |
INDIAN ECONOMIC OVERVIEW
N E W S
The economy grew 4.7 %in 2013/14, marking a
second straight year of sub-5 % growth – the worst slowdown in more than a
quarter of a century. The data was below an official estimate of 4.9 % annual
growth and compared with 4.5 % in the last fiscal year. However, the current
account deficit narrowed sharply to $ 32.4 billion at 1.7 % of gross domestic
product, in 2013/14 from a record high of $ 98.8 billion or 4.7 %, the year
before.A sharp fall in gold imports due to restrictions on overseas purchases
and muted import of capital goods helped shrink the current account deficit.
Online retailer Flipkart has acquired fashion
portal Myntra as it prepares to battle with the rapidly expanding India arm of the
global e-commerce giant Amazon. The company raised $ 210 million from Russian
Investment firm DST Global which has also invested in companies like Facebook,
Twitter and Alibaba Group.
General Motors will start exporting vehicles
from its Talegaon plant near Pune in the second half of 2014. GM was one of the
few global carmakers that was using its India plant only for the domestic
market.
Google has overtaken Apple as the world’s top
brand in terms of value, according to global market research agency Millward
Brown. Google’s brand value shot up 40 % in a year to $ 158.84 billion. The top
10 of the 100 slots were dominated by US companies.
Infosys lost another heavy weight when B G
Srinivas, a board member put in his papers. He is the third CEO-hopeful to quit
after Chairman N R Narayana Murthy’s return to the company – Ashok Vemuri and V
Balakrishnan being the other two.While Vemuri went on to lead IGate,
Balakrishnan joined politics.
Naresh Goyal – promoted Jet Airways posted
biggest quarterly loss – Rs 2153.37 crore – in the three months ended March 31,
mainly because it has been offering discounts to passengers to fill planes.
William S Pinckney – Chairman and CEO of
Amway India was arrested by the Andhra Pradesh Police in connection with a
complaint against the direct selling firm. This is the second time that he has
been taken into custody. A year, ago the Kerala Police had arrested Pinckney
and two company directors on charges of financial irregularities.
China has told its state-owned enterprises to
sever links with American consulting firms after the United States charged five
Chinese military officers wih hacking US companies. China’s action which
targets consultancies like McKinsey & Co. and the Boston Consulting Group,
sterns from fears that the first are providing trade secrets to the US
governments.
India has emerged as a country with some of
the highest unregistered businesses in the world. Indonesia has the maximum
number of shadow businesses, says a study of 68 countries by Imperial College
Business School in London.
Pfizer has abandoned its attempt to buy
AstraZeneca for nearly $ 118 billion after the latter refused an offer of 55
pounds a share.
EXTERNAL AGENCY RATING
|
Rating Agency Name |
CARE |
|
Rating |
Long term bank facilities = A+ |
|
Rating Explanation |
Adequate degree of safety and low credit
risk |
|
Date |
10.01.2014 |
|
Rating Agency Name |
CARE |
|
Rating |
Short term bank facilities = A1+ |
|
Rating Explanation |
Very strong degree of safety and higher
credit risk |
|
Date |
10.01.2014 |
RBI DEFAULTERS’ LIST STATUS
Subject’s name is not enlisted as a defaulter
in the publicly available RBI Defaulters’ list.
EPF (Employee Provident Fund) DEFAULTERS’ LIST STATUS
Subject’s name is not enlisted as a defaulter
in the publicly available EPF (Employee Provident Fund) Defaulters’ list as of
31-03-2012.
INFORMATION DENIED
Management non co-operative (011-24362200)
LOCATIONS
|
Registered
Office / Corporate Office : |
Core 1, Scope
Complex, 7 Institutional Area, |
|
Tel. No.: |
Not Available |
|
Fax No.: |
Not Available |
|
E-Mail : |
|
|
Website |
DIRECTORS
AS ON 31.03.2013
|
Name : |
Mr. D S Dhesi w.e.f. 08.10.2012 |
|
Designation : |
Chairman cum Managing Director |
|
|
|
|
Name : |
Mr. Madhusudan Prasad |
|
Designation : |
Government Nominee Director |
|
|
|
|
Name : |
Ms. Anita Agnihotri w.e.f.
22.05.2012 |
|
Designation : |
Government Nominee Director |
|
|
|
|
Name : |
Mr. Ved Prakash |
|
Designation : |
Director (Marketing) |
|
|
|
|
Name : |
Mr. M.G. Gupta |
|
Designation : |
Director (Finance) |
|
|
|
|
Name : |
Mr. Anand Trivedi w.e.f. 03.07.2012 |
|
Designation : |
Director (Marketing) |
|
|
|
|
Name : |
Mr. P.K. Jain w.e.f. 15.05.2013 |
|
Designation : |
Director (Marketing) |
|
|
|
|
Name : |
Mr. Anil Razdan |
|
Designation : |
Independent Director |
|
|
|
|
Name : |
Mr. G.S. Vedi |
|
Designation : |
Independent Director |
|
|
|
|
Name : |
Mr. Arun Balakrishnan |
|
Designation |
Independent Director |
|
|
|
|
Name : |
Mr. Arvind Kalra w.e.f. 01.04.2013 |
|
Designation |
Independent Director |
|
|
|
|
Name : |
Mr. Rana Som w.e.f. 17.04.2013 |
|
Designation |
Independent Director |
|
|
|
|
Name : |
Mr. N. Bala Baskar w.e.f. 22.04.2013 |
|
Designation |
Independent Director |
|
|
|
|
Name : |
Mr. Subas Pani w.e.f. 07.05.2013 |
|
Designation |
Independent Director |
|
|
|
|
Name : |
Mr. S R Tayal w.e.f 09.07.2013 |
|
Designation |
Independent Director |
MAJOR SHAREHOLDERS / SHAREHOLDING PATTERN
AS ON 31.03.2014
|
Category of
Shareholders |
Total No of
Shares |
Total
Shareholding as a % of Total No. of shares |
|
(A) Shareholding of promoter and promoter Group |
|
|
|
(1) Indian |
|
|
|
Central Government / state Governments |
900000000 |
90.00 |
|
Sub total |
900000000 |
90.00 |
|
(2) Foreign |
|
|
|
Total shareholding of promoter and promoter Group (A) |
900000000 |
90.00 |
|
|
|
|
|
(B) Public Shareholding |
|
|
|
(1) Institutions |
|
|
|
Mutual Funds / UTI |
179700 |
0.02 |
|
Financial Institutions / Banks |
16604250 |
1.66 |
|
Insurance Companies |
55715680 |
5.57 |
|
Foreign Institutional Investors |
41000 |
0.00 |
|
Total |
72540630 |
7.25 |
|
|
|
|
|
(2) Non - Institutions |
|
|
|
Bodies Corporate |
7281969 |
0.73 |
|
Individuals |
|
|
|
Individual shareholders holding nominal
share capital up to Rs 1.000 Millions. |
19335938 |
1.93 |
|
Individual Shareholders holding nominal share
capital in excess of Rs. 1.000 Millions. |
406774 |
0.04 |
|
Any Other (Specify) |
434689 |
0.04 |
|
Non Resident Indians |
427122 |
0.04 |
|
Trust and Foundation |
456 |
0.00 |
|
Sub Total |
27459370 |
2.75 |
|
Total Public Shareholding (B) |
100000000 |
10.00 |
|
Total (A) + (B) |
1000000000 |
100.00 |
|
(C) Share held by custodians and against which depository Receipts
have been issued |
|
|
|
(1) Promoter and Promoter Group |
0 |
0 |
|
(2) Public |
0 |
0 |
|
Sub Total |
0 |
0 |
|
Total (A) + (B) + (C) |
1000000000 |
0.00 |
|
|
|
|
BUSINESS DETAILS
|
Line of Business : |
Exporter and importer of
Minerals and Metals |
||||||||
|
|
|
||||||||
|
Products : |
|
PRODUCTION STATUS
AS ON 31.03.2011
|
Particulars |
Unit |
Licensed
Capacity |
Installed
Capacity |
Actual
Production |
|
Silver Medallion |
Nos. |
-- |
-- |
263,077 |
|
Sanchi |
Kgs. |
-- |
-- |
10,416 |
|
Gold Medallion |
Nos. |
-- |
-- |
149,130 |
|
Mica Paper |
MT. |
700 |
600 |
-- |
|
Mica Power |
MT. |
900 |
900 |
-- |
|
IMP phase - I |
MT. |
-- |
45 |
-- |
GENERAL INFORMATION
|
No. of Employees : |
1605 (Approximately) (602 Officers + 1003 staff) |
||||||||||||
|
|
|
||||||||||||
|
Bankers : |
|
||||||||||||
|
|
|
||||||||||||
|
Facilities : |
Notes : The loans have been taken from Banks under cash credit/Packing Credit
accounts/Others and are repayable within one year. The company has not defaulted in repayment of any loan and interest
thereon. |
|
|
|
|
Banking
Relations : |
|
|
|
|
|
Statutory Auditors : |
|
|
Name : |
Jain Kapila Associates Chartered Accountants |
|
Address : |
New Delhi |
|
|
|
|
Branch Auditors: |
|
|
Name : |
D V Sarover and Company |
|
Address: |
Bellary |
|
|
|
|
Name: |
Rajesh K Jhunjhunwala and Company |
|
Address: |
Cuttack |
|
|
|
|
Name : |
Shah and Shah Associates |
|
Address: |
Ahmedabad |
|
|
|
|
Name: |
Sunder Srini and Sridahar |
|
Address: |
Banglore |
|
Name : |
Kailash Chand Jain and Company |
|
Address: |
Mumbai |
|
|
|
|
Name: |
Kulkarni and Bhat |
|
Address: |
Goa |
|
|
|
|
Name: |
Chaturvedi and Company |
|
Address: |
Kolkata |
|
|
|
|
Name: |
C Ramachandram and Company |
|
Address: |
Hyderabad |
|
|
|
|
Name: |
Bhandawat and Company |
|
Address: |
Jaipur |
|
|
|
|
Name : |
Annand And Ponnappan |
|
Address: |
Chennai |
|
|
|
|
Name : |
Jhalani and Company |
|
Address |
New Delhi |
|
|
|
|
Name : |
Basga and Narasimhan |
|
Address: |
Visakhapatnam |
|
|
|
|
Joint Venture |
|
|
|
|
|
Subsidiaries : |
|
|
|
|
|
Associates : |
|
CAPITAL STRUCTURE
As on 31.03.2013
Authorised Capital :
|
No. of Shares |
Type |
Value |
Amount |
|
1000000000 |
Equity Shares |
Rs .1/- each |
Rs.1000.000 Millions |
Issued, Subscribed & Paid-up Capital :
|
No. of Shares |
Type |
Value |
Amount |
|
1000000000 |
Equity Shares |
Rs. 1/- each |
Rs.1000.000 Millions |
Note:
During 2010-11, 50,000,000 shares of the company of Rs.10/- each were divided into 500,000,000 shares of Rs. 1/- each and bonus shares were issued in the ratio of 1:1 by capitalizing a sum of ` 500 million from general reserve. The Company has one class of share capital, comprising ordinary shares of Rs. 1/- each. Subject to the Company’s Articles of Association and applicable law, the Company’s ordinary shares confer on the holder the right to receive notice of and vote at general meetings of the Company, the right to receive any surplus assets on a winding-up of the Company, and an entitlement to receive any dividend declared on ordinary shares. The Company does not have any holding company. Hence no share is held by its holding company or its subsidiaries or associates. No shareholder other than the promoters is holding more than 5% shares of the company. The shareholding of the promoters i.e. President of India as on 31-03-2013 is 993,312,000 shares (P.Y. 993,312,000 shares)
FINANCIAL DATA
[all figures are
in Rupees Millions]
ABRIDGED BALANCE
SHEET
|
SOURCES OF FUNDS |
31.03.2013 |
31.03.2012 |
|
|
|
|
|
I.
EQUITY AND LIABILITIES |
|
|
|
(1)Shareholders'
Funds |
|
|
|
(a) Share Capital |
1,000.000 |
1,000.000 |
|
(b) Reserves &
Surplus |
12,407.780 |
13,214.010 |
|
(c) Money received
against share warrants |
0.000 |
0.000 |
|
|
|
|
|
(2)
Share Application money pending allotment |
0.000 |
0.000 |
|
Total Shareholders’ Funds
(1) + (2) |
13,407.780 |
14,214.010 |
|
|
|
|
|
(3)
Non-Current Liabilities |
|
|
|
(a) long-term borrowings |
0.000 |
0.000 |
|
(b) Deferred tax
liabilities (Net) |
0.000 |
0.000 |
|
(c) Other long term
liabilities |
191.180 |
44.810 |
|
(d) long-term provisions |
1,701.940 |
1,373.720 |
|
Total Non-current
Liabilities (3) |
2,621.120 |
1,418.530 |
|
|
|
|
|
(4)
Current Liabilities |
|
|
|
(a) Short term borrowings |
14,782.910 |
34,298.660 |
|
(b) Trade payables |
26,704.050 |
32,996.070 |
|
(c) Other current
liabilities |
8,994.190 |
18,331.950 |
|
(d) Short-term provisions |
1,198.680 |
2,123.480 |
|
Total Current Liabilities
(4) |
51,679.830 |
87,750.160 |
|
|
|
|
|
TOTAL |
66,980.730 |
1,03,382.700 |
|
|
|
|
|
II.
ASSETS |
|
|
|
(1)
Non-current assets |
|
|
|
(a) Fixed Assets |
|
|
|
(i) Tangible assets |
864.730 |
972.610 |
|
(ii) Intangible Assets |
1.640 |
0.000 |
|
(iii) Capital
work-in-progress |
54.940 |
0.000 |
|
(iv) Intangible assets
under development |
0.000 |
0.000 |
|
(b) Non-current
Investments |
4,697.360 |
4,672.870 |
|
(c) Deferred tax assets
(net) |
1,454.240 |
714.960 |
|
(d) Long-term Loan and Advances |
1,129.810 |
1,095.050 |
|
(e) Other Non-current
assets |
17.430 |
22.910 |
|
Total Non-Current Assets |
8,220.150 |
7,478.400 |
|
|
|
|
|
(2)
Current assets |
|
|
|
(a) Current investments |
150.030 |
0.000 |
|
(b) Inventories |
8,888.240 |
9,244.030 |
|
(c) Trade receivables |
22,240.970 |
27,706.100 |
|
(d) Cash and cash equivalents |
14,600.510 |
28,531.160 |
|
(e) Short-term loans and
advances |
11,141.520 |
20,147.250 |
|
(f) Other current assets |
1,739.310 |
10,275.760 |
|
Total Current Assets |
58,760.580 |
95,904.300 |
|
|
|
|
|
TOTAL |
66,980.730 |
1,03,382.700 |
|
SOURCES OF FUNDS |
|
|
31.03.2011 |
|
|
SHAREHOLDERS
FUNDS |
|
|
|
|
|
1] Share Capital |
|
|
1000.000 |
|
|
2] Share Application Money |
|
|
0.000 |
|
|
3] Reserves & Surplus |
|
|
12797.350 |
|
|
4] (Accumulated Losses) |
|
|
0.000 |
|
|
NETWORTH |
|
|
13797.350 |
|
|
LOAN FUNDS |
|
|
|
|
|
1] Secured Loans |
|
|
50019.920 |
|
|
2] Unsecured Loans |
|
|
10814.750 |
|
|
TOTAL BORROWING |
|
|
60834.670 |
|
|
DEFERRED TAX
LIABILITIES |
|
|
0.000 |
|
|
|
|
|
|
|
|
TOTAL |
|
|
74632.020 |
|
|
|
|
|
|
|
|
APPLICATION OF
FUNDS |
|
|
|
|
|
|
|
|
|
|
|
FIXED ASSETS
[Net Block] |
|
|
1108.510 |
|
|
Capital work-in-progress |
|
|
5.140 |
|
|
|
|
|
|
|
|
INVESTMENT |
|
|
2830.850 |
|
|
DEFERRED TAX
ASSETS |
|
|
335.490 |
|
|
|
|
|
|
|
|
CURRENT ASSETS,
LOANS & ADVANCES |
|
|
|
|
|
|
Inventories |
|
|
6479.730 |
|
|
Sundry Debtors |
|
|
25397.350 |
|
|
Cash & Bank Balances |
|
|
67482.350 |
|
|
Other Current Assets |
|
|
0.000 |
|
|
Loans & Advances |
|
|
23458.280 |
|
Total
Current Assets |
|
|
122817.710 |
|
|
Less :
CURRENT LIABILITIES & PROVISIONS |
|
|
|
|
|
|
Sundry Creditors |
|
|
26509.750 |
|
|
Bills Payable |
|
|
9426.100 |
|
|
Advance Payments from customers |
|
|
7109.750 |
|
|
Interest Accrued But not due on loan |
|
|
113.940 |
|
|
Other Liabilities |
|
|
5195.090 |
|
|
Book Overdraft |
|
|
111.010 |
|
|
Provisions |
|
|
4000.040 |
|
Total
Current Liabilities |
|
|
52465.680 |
|
|
Net Current Assets |
|
|
70352.030 |
|
|
|
|
|
|
|
|
MISCELLANEOUS
EXPENSES |
|
|
0.000 |
|
|
|
|
|
|
|
|
TOTAL |
|
|
74632.020 |
|
PROFIT & LOSS
ACCOUNT
|
|
PARTICULARS |
31.03.2013 |
31.03.2012 |
31.03.2011 |
|
|
|
SALES |
|
|
|
|
|
|
|
Income |
285983.590 |
663248.840 |
3299.700 |
|
|
|
Other Income |
3179.050 |
7270.110 |
5103.750 |
|
|
|
TOTAL (A) |
289162.640 |
670518.950 |
8403.450 |
|
|
|
|
|
|
|
|
Less |
EXPENSES |
|
|
|
|
|
|
|
Cost of material consumed |
2677.610 |
|
|
|
|
|
Purchases of stock-in-trade |
265089.340 |
646171.630 |
|
|
|
|
Changes in inventories of
finished goods, work-in-progress and Stock-in-Trade |
87.760 |
(2776.360) |
|
|
|
|
Employees benefits expense |
2029.210 |
1843.610 |
|
|
|
|
Other expenses |
15671.950 |
12150.810 |
|
|
|
|
TOTAL (B) |
2,85,555.870 |
662873.790 |
2642.380 |
|
|
|
|
|
|
|
|
|
PROFIT
/ (LOSS) BEFORE INTEREST, TAX, DEPRECIATION AND AMORTISATION (A-B) (C) |
3606.770 |
7645.160 |
5761.070 |
|
|
|
|
|
|
|
|
|
Less |
FINANCIAL
EXPENSES (D) |
2194.660 |
5764.250 |
3718.590 |
|
|
|
|
|
|
|
|
|
|
PROFIT
/ (LOSS) BEFORE TAX, DEPRECIATION AND AMORTISATION (C-D) (E) |
1412.110 |
1880.910 |
2042.480 |
|
|
|
|
|
|
|
|
|
Less/ Add |
DEPRECIATION/
AMORTISATION (F) |
119.700 |
120.030 |
124.660 |
|
|
|
|
|
|
|
|
|
|
PROFIT / (LOSS)
BEFORE EXCEPTIONAL AND EXTRAORDINARY ITEMS AND TAX |
1292.410 |
1760.880 |
1917.820 |
|
|
|
|
|
|
|
|
|
Less |
EXCEPTIONAL
ITEMS |
127.150 |
(1.290) |
0.000 |
|
|
|
|
|
|
|
|
|
|
PROFIT BEFORE
EXTRAORDINARY ITEMS AND TAX |
1165.260 |
1762.170 |
1917.820 |
|
|
|
|
|
|
|
|
|
Less |
EXTRAORDINARY
ITEMS |
2443.640 |
1002.050 |
0.000 |
|
|
|
|
|
|
|
|
|
|
PROFIT / (LOSS)
BEFORE TAX |
(1278.380) |
760.120 |
1917.820 |
|
|
|
|
|
|
|
|
|
Less |
TAX |
(572.140) |
52.930 |
701.390 |
|
|
|
|
|
|
|
|
|
|
PROFIT / (LOSS)
AFTER TAX (G-H) |
(706.240) |
707.190 |
1216.430 |
|
|
|
|
|
|
|
|
|
Add |
PREVIOUS YEARS’ BALANCE BROUGHT FORWARD (K) |
7257.190 |
6915.560 |
6119.650 |
|
|
|
|
|
|
|
|
|
|
|
|
|
|
|
|
Less |
APPROPRIATIONS |
|
|
|
|
|
|
Final Dividend |
100.000 |
250.000 |
250.000 |
|
|
|
Dividend tax |
0.000 |
40.560 |
40.550 |
|
|
|
General Reserve |
0.000 |
75.000 |
130.000 |
|
|
|
Sustainable Development Reserve |
2.110 |
0.000 |
0.000 |
|
|
|
Corporate Social Responsibility Reserve |
4.360 |
0.000 |
0.000 |
|
|
|
Total (M) |
106.470 |
365.560 |
420.550 |
|
|
|
Balance Carried to the B/S (J+K+-M) |
6444.480 |
7257.190 |
6915.530 |
|
|
|
|
|
|
|
|
|
|
|
|
|
|
|
|
|
EARNINGS IN
FOREIGN CURRENCY |
|
|
|
|
|
|
|
FOB value of good exported |
29792.320 |
20388.940 |
|
|
|
|
Interest and Dividends |
101.760 |
248.960 |
|
|
|
|
Despatch / Demurrage |
23.620 |
13.870 |
|
|
|
|
Others (specify) |
88.970 |
47.450 |
|
|
|
TOTAL EARNINGS |
30006.670 |
20699.230 |
NA |
|
|
|
|
|
|
|
|
|
|
IMPORTS |
|
|
|
|
|
|
|
Goods-in-Trade |
198972.040 |
603374.400 |
|
|
|
|
Raw Materials |
2684.150 |
5419.950 |
|
|
|
TOTAL IMPORTS |
201656.190 |
608794.350 |
NA |
|
|
|
|
|
|
|
|
|
|
Earnings /
(Loss) Per Share (Rs.) |
(0.71) |
0.71 |
1.22 |
|
KEY RATIOS
|
PARTICULARS |
|
31.03.2013 |
31.03.2012 |
31.03.2011 |
|
PAT / Total Income |
(%) |
(0.24) |
0.11 |
14.48 |
|
|
|
|
|
|
|
Net Profit Margin (PBT/Sales) |
(%) |
(0.45) |
0.11 |
58.12 |
|
|
|
|
|
|
|
Return on Total Assets (PBT/Total Assets} |
(%) |
(2.10) |
0.78 |
1.55 |
|
|
|
|
|
|
|
Return on Investment (ROI) (PBT/Networth) |
|
(0.09) |
0.05 |
0.14 |
|
|
|
|
|
|
|
Debt Equity Ratio (Total Liability/Networth) |
|
4.05 |
6.27 |
8.21 |
|
|
|
|
|
|
|
Current Ratio (Current Asset/Current Liability) |
|
1.14 |
1.09 |
2.34 |
FINANCIAL ANALYSIS
[all figures are
in Rupees Millions]
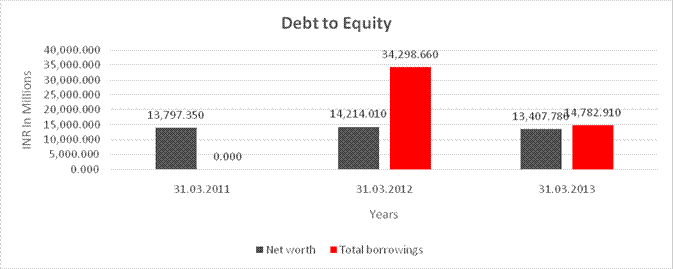
DEBT EQUITY RATIO
|
Particular |
31.03.2012 |
31.03.2013 |
|
|
(Rs. In Millions) |
(Rs. In Millions) |
|
Share Capital |
1,000.000 |
1,000.000 |
|
Reserves & Surplus |
13,214.010 |
12,407.780 |
|
Net worth |
14,214.010 |
13,407.780 |
|
|
|
|
|
long-term borrowings |
0.000 |
0.000 |
|
Short term borrowings |
34,298.660 |
14,782.910 |
|
Total borrowings |
34,298.660 |
14,782.910 |
|
Debt/Equity ratio |
2.413 |
1.103 |
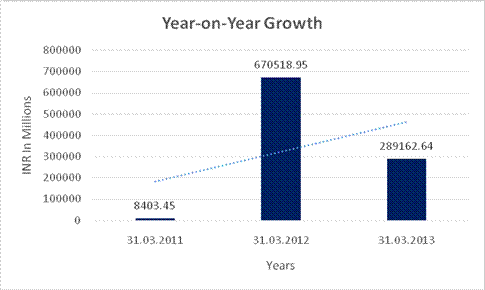
YEAR-ON-YEAR GROWTH
|
Year on Year Growth |
31.03.2011 |
31.03.2012 |
31.03.2013 |
|
|
(Rs. In Millions) |
(Rs. In Millions) |
(Rs. In Millions) |
|
Sales |
8403.450 |
670518.95 |
289162.64 |
|
|
|
7,879.091 |
(56.875) |
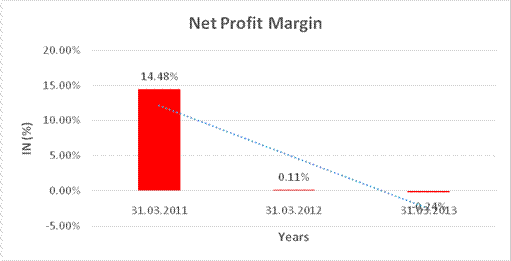
NET PROFIT MARGIN
|
Net Profit Margin |
31.03.2011 |
31.03.2012 |
31.03.2013 |
|
|
(Rs. In Millions) |
(Rs. In Millions) |
(Rs. In Millions) |
|
Sales |
8403.450 |
670518.950 |
289162.640 |
|
Profit |
1216.430 |
707.190 |
(706.240) |
|
|
14.48% |
0.11% |
(0.24%) |
LOCAL AGENCY FURTHER INFORMATION
|
Sr. No. |
Check
List by Info Agents |
Available in Report (Yes / No) |
|
1] |
Year
of Establishment |
Yes |
|
2] |
Locality
of the firm |
Yes |
|
3] |
Constitutions
of the firm |
Yes |
|
4] |
Premises
details |
No |
|
5] |
Type
of Business |
Yes |
|
6] |
Line
of Business |
Yes |
|
7] |
Promoter's
background |
No |
|
8] |
No.
of employees |
Yes |
|
9] |
Name
of person contacted |
No |
|
10] |
Designation
of contact person |
No |
|
11] |
Turnover
of firm for last three years |
Yes |
|
12] |
Profitability
for last three years |
Yes |
|
13] |
Reasons
for variation <> 20% |
-- |
|
14] |
Estimation
for coming financial year |
No |
|
15] |
Capital
in the business |
Yes |
|
16] |
Details
of sister concerns |
Yes |
|
17] |
Major
suppliers |
No |
|
18] |
Major
customers |
No |
|
19] |
Payments
terms |
No |
|
20] |
Export
/ Import details (if applicable) |
No |
|
21] |
Market
information |
-- |
|
22] |
Litigations
that the firm / promoter involved in |
Yes |
|
23] |
Banking
Details |
Yes |
|
24] |
Banking
facility details |
Yes |
|
25] |
Conduct
of the banking account |
-- |
|
26] |
Buyer
visit details |
-- |
|
27] |
Financials,
if provided |
Yes |
|
28] |
Incorporation
details, if applicable |
Yes |
|
29] |
Last
accounts filed at ROC |
Yes |
|
30] |
Major
Shareholders, if available |
Yes |
|
31] |
Date
of Birth of Proprietor/Partner/Director, if available |
No |
|
32] |
PAN
of Proprietor/Partner/Director, if available |
No |
|
33] |
Voter
ID No of Proprietor/Partner/Director, if available |
No |
|
34] |
External
Agency Rating, if available |
Yes |
Litigation Details
:
IN THE HIGH COURT
OF DELHI AT NEW DELHI
W.P.(C) 6327/2011
PUNJAB and SIND
BANK..... Petitioner
Through Mr. Pallav
Saxena and Mr. Kamal
Kishore, Advocates
for PSB
Versus
MMTC LIMITED and
ORS ….. Respondent
Through Mr. Rohit
Puri, Advocate for R1.
Mr. Sandeep Puri,
Advocate for R3
CORAM :
HON’BLE MR.
JUSTICE S. RAVINDRA BHAT
HON’BLE MR. JUSTICE
VIBHU BAKHRU
ORDER
26.05.2014
Adjourned to
03.09.2014 for arguments.
S. RAVINDRA BHAT,
J
VIBHU
BAKHRU,J
1. General Information:
The company is incorporated and domiciled in India, and a Mini- Ratna public sector undertaking under the administrative control of Ministry of Commerce & Industry, Government of India. The registered office of the Company is situated at Core-1, Scope Complex, 7, Institutional Area, Lodi Road, New Delhi-110003, India. The company has 13 regional offices at various places in India and a wholly owned subsidiary MMTC Transnational Pte Limited (MTPL), Singapore.
The principal activities of the Company are export of Minerals and import of Precious Metals, Non-ferrous metals, Fertilizers, Agro Products, coal and hydrocarbon etc.
The company’s trade activities span across various countries in Asia, Europe, Africa, Middle East, Latin America and North America
RESULTS OF OPERATIONS
:
The company, one of the leading trading companies in India, recorded a business turnover of Rs. 284156.200 million during 2012-13 as against the business turnover of Rs. 659291.100 million registered last fiscal. This business turnover includes Exports of Rs.29795.400 million, Imports of Rs. 209544.100 million and domestic trade of Rs. 44816.700 million. The other trade related earnings contributed Rs.1837.900 million. The trading profit earned by the Company stood at Rs. 2997.500 million as against Rs 2766.100 million during last fiscal. The Company has reported Net Loss of Rs.706.200 million during the year due to provisions made in respect of Extraordinary items relating to bullion transactions at Regional Offices Hyderabad and Chennai amounting to Rs.2443.600 million .
AWARDS & RANKINGS
Following Awards and
Rankings were conferred on the Company during 2012-13:
- Most Caring Companies of India Award to MMTC presented by
"The World Congress" recognizing Organisations for contributions
made in the field of CSR.
- Star Performer Award for the year 2011-12 in the product group of
Basic Iron and Steel (Large Enterprise) by EEPC (National Award)
- Top Exporters for the year 2010-11, Silver Trophy, Medium
Enterprise by EEPC India (N.R.)
- TCC Exim Award (II position) in the import category for 2011-12 by
The Tamil Chamber of Commerce, Chennai.
- 11th rank in 2012 on the basis of net sales and 14th rank in terms
of Market
Capitalization by Business India's
Super 100 rankings published in Business India on 23rd Dec.2012.
Subsidiary Company :
The wholly owned subsidiary of the Company - MMTC Transnational Pte. Limited. Singapore(MTPL) was incorporated in October 1994 under the laws of Singapore with a share capital of USD 1 million. During the year 2012-13, MTPL achieved business turnover of USD 600 million. The Profit after tax earned by MTPL during 2012-13 amounted to USD 2.110 million. The networth of MTPL stood at USD 15.450 million as on 31st March 2013. MTPL has so far paid total dividends of US$ 15.040 million as against capital of US$ 1.000 million contributed by the company.
MMTC'S PROMOTED PROJECT-Neelachal Ispat Nigam Ltd. (NINL)
The company has set up Neelachal Ispat Nigam
Limited (NINL) - an iron & steel plant of 1.100 million tonnes capacity, 0.800
million tonne coke oven and by product unit with captive power plant, jointly
with Government of Orissa. The project has been granted Iron ore mining lease
with an estimated reserves of 110.000 million tons. The phase-II of the Project
for production of steel, with Basic Oxygen Furnace, Oxygen Plant and SMS got
commissioned in March 2013 and Steel Billets Production also started. During
the year 2012-13, NINL achieved a sales turnover of Rs.16,256.100 million which
includes export of pig iron worth Rs.2657.000 million, domestic sales of pig
iron valued at Rs 8680.700 million and BF coke valued at Rs.2400.200 million as
against the total turnover of Rs.19391.170 million during 2011-12. With the
commissioning and stabilization of steel making facility and starting of iron
ore mining probably during later part of current year, NINL's performance is
expected to improve. In the first five months of the current financial year we
have finalized contracts for export of 7 vessels of pig iron compared to only 4
vessels exported in FY 2012-13.
Projects/ Joint Ventures
To evolve a new business model for taking
advantage of new opportunities emerging in the free market environment, the company
has promoted a number of joint ventures following the public- private
partnership route. These value multiplier initiatives are briefed hereunder:
- The company
had promoted a Commodity Exchange under the name and style of "Indian
Commodity Exchange Limited" which commenced operations in November
2009. The said exchange has reported a net loss of Rs.102.600 million for
the year 2012-13 as against a net loss of Rs.255.600 million during
2011-12.
- The company
has participated in the equity of a Currency Futures Exchange under the
name and style of "United Stock Exchange of India Limited" The
said Currency Futures Exchange which commenced its operations in September
2010 has reported a profit of Rs.4.600 million for the year 2012-13 as against
a net loss of Rs.47.100 million during 2011-12.
- The company
has joined hands with an international producer as a joint venture partner
for setting up a gold/silver medallion manufacturing unit, which would
also include a gold refinery as an integral part, under the name and style
of "MMTC-Pump India Private Limited". The said medallion
manufacturing unit which commenced commercial production in April 2011 has
reported a net profit of Rs.378.480 million for the year 2012-13 as
against a net loss of Rs.220.500 million during 2011-12.
- For effective
marketing of the finished products from above unit, as well as jewellery
from other sources, the company has set up in partnership with a leading
Indian company, a chain of retail stores at various cities in India for medallions,
jewellery and its homegrown brand of 'SANCHI' silverware. Towards this end
a JV Company was promoted under the
name and style of "MMTC-Gitanjali Private Limited" with 8
retail outlets presently functioning. MMTC-Gitanjali Private Limited has
reported a net profit of Rs.3.520 million for the year 2012-13 as against
Rs.1.200 million during 2011-12.
- The company
had set up a permanent berth with loading facilities for iron ore at
Ennore Port jointly with SICAL and L&T Infrastructure Limited under the
name and style of M/s. SICAL Iron Ore Terminals Limited (SIOTL). Due to
non-availability of iron ore for exports, commercial operations of SIOTL
could not commence. The JV company has been pursuing with Ennore Port
Authorities for permission to modify the facility for handling coal
discharge instead of iron ore so as to meet growing demand for thermal
power plants in Tamil Nadu.
- The company
had participated in development of a deep draught iron ore loading berth
at Paradeep Port (Orissa) jointly with Noble Group Limited. and Gammon
Infrastructure Projects Limited under the name and style of M/s. Blue
Water Iron Ore Terminal Private Limited It could not commence construction
in view of the project being rendered unviable as a result of inordinate
delay in getting mandatory clearances, change in iron ore export trade
scenario, restrictions imposed by State Governments. on mining of iron
ore, refusal of Paradip Port Trust to give concessions, etc. The JV
Company is being wound up.
- Towards
investing in mining exploration the Company has set up a joint venture
company with M/s. TATA Steel Limited. under the name and style of TM
Mining Limited.(TMML) for mining exploration and allied activities had
applied for mineral concession(mining leases) for manganese ore in Odisha.
One of the lease applications has been cleared by the Forest and Mining
Departments while clearance from Revenue Department is awaited. Once
clearance from the Revenue Department is received, the same would be
forwarded to Mines Department of Government of Odisha.
- To facilitate
promotion of two-way trade, the SPV promoted by the Company in association
with IL&FS has been allotted land to set up free trade and warehousing
zones at Haldia and Kandla on lines similar to Special Economic Zones. Action
is being taken to develop these Zones for promotion of trade.
- The company
has been allotted a coal mine in the Jharkhand State having estimated
reserves of about 251.180 million tones classified with proved category.
Prospecting license for the same has since been issued by the concerned
authorities and the pre-feasibility study completed. The
drilling/exploration work in conformity with Government of India norm has
since been completed in April, 2013 and the final Geological Report has
been prepared. The company has signed an MOU with M/S Singareni Collieries
Limited, (A Government of India Enterprise) for Joint mining of coal from
the said coal block
MANAGEMENT DISCUSSION
AND ANALYSIS REPORT 2012-13
Overview of global
trade and developments
The global economic slowdown that began during the end of 2011 has continued throughout 2012-13 and the same trend is still persisting during the current year i.e. 2013-14. The overall economic activities around the globe have slowed down further, growth rates in the developed as well as emerging markets have fallen as they are still continuing their struggle to come out of the depressing economic environment. All the major economies - namely US, EU, China, India & Japan are impacted.
World merchandise trade value surpassed the pre-crisis (2008) level of US $ 16 trillion, reaching US $ 18.26 trillion in 2011 after an interregnum of two years. However, world trade volume decelerated sharply by 2.8 per cent in 2012 as per World Trade Organization (WTO) statistics. As per the January 2013 update of the IMF, world trade volume is projected to grow by 3.8 percent in 2013 which is down 0.7 percentage points compared to its October 2012 update. Import and export volume growth rates of emerging market and developing economies are however projected to be higher than those of advanced economies. Global economic uncertainty including doubts about the ultimate resolution of the crisis in the Euro area, doubts about the pace of fiscal withdrawal in the US, challenges to sustaining growth after the earthquake reconstruction rebound in Japan and trade disruptions with China, though of a passing nature, continue to cast their shadows on the trade growth of emerging and developing economies (EDEs) including India. However, the deceleration in world growth and trade in 2012 and forecast of only a gradual upturn in global growth by international institutions, portend a weakand slow recovery for world trade.
Overview of
developments in India during 2012-13
India's growth rates have also fallen during last year to 5% and growing current account deficit is putting further pressure on the Indian Rupee vis-à-vis US Dollar. INR was at 53.74 on 3rd May 2013 and fell to 56.45 on 3rd June 2013 before touching an all-time low of 61.81 on 6th August 2013. Such a steep fall is expected to have an adverse effect on imports to India. The falling growth rates have been adversely impacted trade sectors, pulling down the demand for commodities and thereby affecting the trade turnover and profitability of trading as well as
manufacturing companies. India's exports, which had surpassed pre-crisis levels within a year in 2010-11 with a record 40.5 per cent growth, continued growing even in 2011-12, but were finally affected by the global slowdown in 2012-13 with exports declining even more at - 4.9 per cent in the first ten months than the -3.5 per cent recorded during the crisis-ridden year of 2009-10 (full year).
MMTC- 2012-13 in
retrospect
Financial Review
The Company achieved a business turnover of Rs.284,156.200 million during 2012-13 as against the business turnover of Rs. 659,291.100 million registered last fiscal. This business turnover includes Exports of Rs. 29,795.400 million, Imports of Rs. 209,544.100 million and domestic trade of Rs. 44,816.700 million. The other trade related earnings contributed Rs.1,837.900 million. The Company earned trading profit of Rs.2,997.500 million as compared to Rs. 2,766.100 million in 2011-12. The profit before tax from ordinary activities is Rs.1,165.300 millions as compared to
Rs.1,762.200 million in 2011-12. However the extra-ordinary episode that occurred in RO-Hyderabad and Chennai on the bullion front to the extent of Rs.2,293.200 millions leaving the company in loss at Rs. 706.200 millions in 2012-13. Thus the earnings per share of face value ofRe.1/- each for the financial year 2012-13 after the said extra-ordinary activity led to a negative figure of Rs. 0.71. The company’s management of financial resources yielded net interest earnings of Rs.601.800 million. There was a corporate tax liability of Rs.257.230 million on the Company during 2012-13. MMTC continues to be a zero long-term debt company.
The company has made an additional provision of Rs. 155.400 million in the accounts for the year ended 31st March 2013 in the books of Regional Office Chennai and Rs. 2,288.200 million in the accounts of RO Hyderabad relating to Bullion transactions.
Business Groupwise
Review for 2012-13
Minerals
The developments like ban on Iron Ore mining and export from Bellary Hospet Sector (Karnataka & Goa) regulation of export from eastern sector, increase in railway freight for exports which is currently over 3 times that of domestic movement of ore, increase in domestic demand of ore and higher export duty etc. have had an impact on the quantum of Indian Iron Ore exports during 2012-13 as compared to other International suppliers e.g. Australia and Brazil. Despite this and the stiff competition at national and international levels, the company continued to maintain its position as a prominent exporter of minerals during the year. The capacity of domestic steel production has also expanded, resulting in lesser availability of Chrome ore, Chrome Concentrate and Manganese ore for exports. With the introduction of 30% ad valorem export duty on chrome ore and chrome concentrate the exports of these items has declined in Financial Year 2012-13.
In spite of above constraints, Minerals group of the company contributed a turnover of Rs.15,652.700 million during the year 2012-13, which includes exports valued at Rs.13891.400 million, imports amounting to Rs.26.800 million and domestic trade of Rs.1,734.500 million. The export made by the group includes Iron Ore valued at Rs.9,885.300 million, Chrome Ore/ Concentrate valued at Rs.3780.900 million and Manganese Ore valued at Rs.225.1 million. The group imported Manganese ore valued at Rs.21.400 million and Chrome Concentrate valued at Rs.5.400 million. The domestic trade of this group includes Iron Ore valued at Rs.1,635.700 million, Dolomite valued at Rs.69.400 million & Limestone valued at Rs.29.400 million.
Long Term Agreements with Japanese Steel Mills and Pohang Iron & Steel Company, South Korea for supply of iron ore have been finalized for a period of three years from FY 2012-13 to FY 2014-15 and the supplies under the Long Term Contract commenced from 1st July, 2012.
Precious Metals, Gems
& Jewellery
The company enjoys the position of market leader in the Indian bullion trade, having flexibility to operate from various centers spread all over the country offering novel product services, besides maintaining enduring relationship. Despite high volatility in prices of bullion as well as Indian rupee US dollar exchange rates, Precious Metals Group of the Company contributed a turnover of Rs.1,36,751.600 million during 2012-13. This performance was realized through diversified activities, which include bullion import of gold and silver at Rs. 1,31,372.800 million.
The precious metals group of the company is continuously working on improving service to customers and now has 6.71% share of India’s gold trade during 2012-13. The Precious Metals group is focusing on improving sales of value-added products, viz. Jewellery, medallions and silverware. The company's joint venture MPIPL started operation and sold gold worth Rs.1,25,950 million. and silver worth Rs.2,330 million. The company consciously imported lower quantity of gold due to the CAD concerns of Government of India. The company will start to gain once MPIPL comes into full production and would be marketing substantial portion of MPIPL's production both domestically and internationally. In the current fiscal, the company has vigorously started marketing MPIPL's production. The company has also operationalised Assaying & Hallmarking centers at Delhi, Ahmedabad, Kolkata, and Jaipur. While the demand of bullion is expected to remain low in 2013-14 due to volatile gold & silver prices, exchange rate, also government's new policies to curb gold import by various means and the continuing economic crisis in Euro zone. The company has to innovate by selling value added products and service in the bullion sector.
Concentration on marketing of MPIPL produced bullion will ease out MMTC's bullion import crunch and will contribute a good amount in turnover.
Metals and Industrial
Raw Material
The Metals group of the Company contributed Rs. 14,840.400 million to MMTC’s turnover during 2012-13. The contribution of the group comprised of export of Pig iron worth Rs. 2,893.400 millions produced by NINL – a MMTC promoted Iron & steel plant, imports of Non-Ferrous Metals worth Rs 1,976.000 million & Industrial Raw Materials worth Rs.166.300 millions and domestic sales of Rs.9,804.700 millions including sale of pig iron and slag produced at NINL worth Rs. 9,106.600 millions.
While Indigenous producers dominate the domestic market of copper, zinc, aluminum etc., the International Markets for NFM continue to be influenced by less demand due to global financial turmoil, especially the sovereign debt related issues in the European Union and slowdown in major economies of the world, adversely affected NFM business. The other factors, which haveadversely affected NFM business during 2012-13 are MMTC's policy of strict safeguards, like taking compulsory forward cover while extending LIBOR based secured credit and detailed documentary requirements for KYC norms, which, most of the customers are not willing to part
with. Apart from meeting the requirements of regular customers, who buy on spot basis, efforts are being made, wherever possible, to enter into MOUs with relatively bigger customers for meeting their NFM requirements on long term basis. Ro have competitive edge, efforts are also being made to tie-up for long-term sourcing from suppliers/producers, and also to explore possibility of making material available off-the-shelf by selling NFM items from FTWS.
Agro Products
The Agro products group of the company achieved a record turnover of Rs. 41,296.400 millions during 2012-13, which includes exports of wheat valuing Rs.11,478.100 million and import of edible oils worth Rs.13,656.300 millions, besides domestic trading including trade on the SPOT Commodity Exchange of Agro products valuing Rs.16,041.100 millions.
During the year MMTC successfully exported wheat to buyers in South Korea, Bangladesh, Philippines, Africa etc. Supplies of Edible Oil were also organized at request of State Governments for distribution through PDS.
The agro trade primarily depends on Govt. policies and vagaries of monsoon. At times when the surplus agro products are available in the country, export opportunities emerge while during the period of shortages, the agro products need to be imported to maintain price stability in the domestic market. With the likely introduction of Food Security Bill, MMTC is fully geared to discharge its obligations for import of food as and when directed by Government. The Agro Group of the company has also devised plans and strategies to meet the challenges in the Agro trade. The group contributes substantially to the profitability of the Company in addition to discharging its obligations as per Government directives.
Fertilizers and
Chemicals
The Fertilizer and Chemicals group contributed a turnover of Rs.19,147.900 million. The group's performance during 2012-13 included third country trading of Urea, DAP & MOP worth Rs.1532.500 million, Import of Urea valued at Rs. 11,438.100 million, Muriate of Potash at Rs. 5,599.500 million, Sulphur worth Rs. 233.500 million & technical grade urea worth Rs 266.200 million besides domestic trading of Ammonium Sulphate produced at NINL – the MMTC promoted Iron & Steel plant - valued at Rs. 78.100 million.
During the year the company was lauded for organizing huge imports of ureawithin the time line stipulated by the government. This was achieved by the group by judiciously leveraging and synergizing MMTC’s expertise in bulk handling with domain knowledge, hands-on experience, expertise in logistics management and skills to predict emerging trends in the global market of fertilizers besides excellent relationship and networking both with the suppliers and customers across the globe and delivery of service to all stake holders
Despite the continuing effort of the Government of India to enhance production of fertilizers domestically with a view to achieve self sufficiency in food grains, India has to still import huge quantities of both finished and raw fertilizers. This is despite the fact that production of urea has improved domestically. Production of several fertilizers in the country is dependent on the cost and availability of several raw materials like Ammonia, Rock Phosphate, Phosphoric Acid etc. This apart, India is dependent totally on foreign suppliers for its requirement of MOP.
Department of Fertilizer had announced Nutrient Based Subsidy policy with a view to bring more and more complex fertilizers under the subsidy regime and thereby make the soil more fertile. More use of complex fertilizers offers opportunity for the company. However, the fertilizer sector in general is still dependent on the Government policy, whereas agriculture largely depends on monsoon even today.
Coal &
Hydrocarbons
The Coal & Hydrocarbons group contributed a turnover of Rs.56,368.200 million to the turnover recorded by the company. The turnover contributed by the group included import of steam coal valued at Rs.36,665.400 million and Coking Coal valued at Rs. 8,022.600 million besides domestic trading of LAM Coke worth Rs.2,613.100 million, Steam Coal worth Rs.8,233.600 million, Crude Tarworth Rs 808.600 million and Solar oil at Rs 21.700 million. The group continues to improve itsthriving coal business by expanding its sourcing network, cost effective shipping and appropriate delivery structure to the major power utilities in India including NTPC, DVC, TANGEDCO, MAHAGENCO, APGENCO, NSPCL, APCPL. MMTC has been sourcing imported coal mainly from Indonesia and to some extent from South Africa and Australia and catered to various Central and State Utilities and Private Players in India. MMTC has started its coal operations from various emergent ports in India in order to achieve logistics viability and to be a cost effective supplier during the year. With the result, MMTC has increased its immense presence in Coal segment throughout the Country. After consolidating the position in the Power Sector, MMTC has poised to tap the emerging opportunities by foraying in a larger way into the sectors such as cement and sponge iron units.
With domestic production unable to meet the rapidly growing demand of non coking coal for power sector, steel, fertilizer and other heavy industries, the existence of big supply gap induces the country to depend upon sizable imports. Further the increase in demand of steam coal is likely to increase considerably in future with many new coal fired generation plants being underway and shall open up new opportunities for this segment of the company. The coal & hydrocarbon group of the company shall be tapping these emerging opportunities to import
and serve the increased demand of coal & coke to power, steel, fertilizer, chemical, cement & sponge Iron units in future. The group also plans to aggressive follow up with suppliers for allocating more coking coal and intends to add LTA suppliers for wider supply base.
Mica
As reported in earlier years, the changed market requirement and technological developments in Mica processing technologies globally led to activities at Mica Division coming to a halt since 2002-03. Measures are being taken to dispose of obsolete Plant & Machinery located at Mica Division establishment at Abrakhnagar, Kodarma District, Jharkhand. Others
The other products contributed Rs.99.000 million to the turnover of the Company, which included domestic trade worth Rs.99.000 million, sale of power amounting to Rs. 94.000 million, generated at the 15 MW wind power farms commissioned in March 2007 in Karnataka. During the year 2013-14, the company shall continue availing opportunities emerging in new markets/ products for generating additional business revenues for the Company.
Cautionary Statement
Statements in the Management Discussions and Analysis describing the Company's projections, estimates, and expectations may be "forward looking statements" within the meaning of applicable laws and regulations. Actual results could differ materially from those expressed or implied. Important factors that could make a difference to the Company's operations include economic conditions affecting demand/supply and price conditions in the domestic and overseas markets in which the Company operates changes in Government regulations/policies, tax laws, other statutes and other incidental factors
UNSECURED LOANS:
|
Particular |
31.03.2013 (Rs. in Millions) |
31.03.2012 (Rs. in Millions) |
|
Short Term
Borrowing |
9074.140 |
8833.120 |
|
Total |
9074.140 |
8833.120 |
Note :
The loans have not been guaranteed by any of the director or others.
INDEX CHARGES:
|
S. No. |
Charge ID |
Date of Charge Creation/Modification |
Charge amount secured |
Charge Holder |
Address |
Service Request Number (SRN) |
|
1 |
10393791 |
17/12/2012 |
2,500,000,000.00 |
AXIS BANK LIMITED |
2nd Floor, Statesman
House, 148, Barakhamba Road, |
B64809569 |
|
2 |
10258043 |
13/12/2010 |
2,250,000,000.00 |
STANDARD CHARTERED BANK |
NARAIN MANZIL BRANCH, 23, BARAKHAMBA ROAD, NEW DELHI, Delhi - 110001, INDIA |
B02097053 |
|
3 |
10116574 |
08/02/2011 * |
3,000,000,000.00 |
AXIS BANK |
148, BARAKHAMBA
ROAD, NEW DELHI, Delhi - 110001, |
B05591987 |
|
4 |
80014085 |
18/11/2009 * |
7,000,000,000.00 |
IDBI BANK LTD |
SURYA KIRAN BUILDING 11TH FLOOR, 19, KASTURBA GANDHI MARG, NEW DELHI, Delhi - 110001, INDIA |
A74219940 |
|
5 |
80054192 |
23/08/2012 * |
3,000,000,000.00 |
ICICI BANK LIMITED |
ICICI BANK TOWERS,BHISHMA PITAMAH MARG, PRAGATI VIHAR, Lodhi Road, NEW DELHI, Delhi - 110003, INDIA |
B57114605 |
|
6 |
80008644 |
30/07/2012 * |
2,000,000,000.00 |
UNION BANK OF INDIA |
OVERSEAS BRANCH, 26/28-D CONNAUGHT PLACE, NEW DELHI, Delhi - 110001, INDIA |
B56406507 |
|
7 |
90042588 |
07/09/2012 * |
2,300,000,000.00 |
BANK OF MAHARASHTRA |
B-29, CONNAUGHT
PLACE,, NEW DELHI, Delhi - 110001, |
B58091695 |
|
8 |
80016470 |
12/07/2012 * |
500,000,000.00 |
INDIAN OVERSEAS BANK |
F-47, MALHOTRA BUILDING, JANPATH, NEW DELHI, Delhi - 110001, INDIA |
B44254043 |
|
9 |
90041820 |
17/06/2009 * |
9,500,000,000.00 |
STATE BANK OF HYDERABAD |
CORE #6, SCOPE COMPLEX, 7, INSTITUTIONAL AREA, LODHI ROAD, NEW DELHI, Delhi - 110003, INDIA |
A64772197 |
|
10 |
90041867 |
04/08/2012 * |
200,000,000.00 |
PUNJAB NATIONAL BANK |
INTERNATIONAL BANKING BRANCH, BARAKHAMBA ROAD, NEW DELHI, Delhi - 110001, INDIA |
B56295421 |
PART I
Statement of Standalone and Audited Financial Results for the Quarter and
Year ended on 31.03.2014
|
|
Particulars |
Standalone |
||
|
|
|
Quarter Ended |
Year Ended |
|
|
|
|
31.03.2014 |
31.12.2013 |
31.03.2014 |
|
|
|
(Audited) |
(Unaudited) |
(Audited) |
|
1 |
Income From
Operations |
|
|
|
|
|
(a) Net sales / income
from operations (Net of excise duty) |
41489.100 |
47759.700 |
250744.900 |
|
|
(b)Other
Operating income |
385.400 |
84.900 |
(1950.200) |
|
|
Total Income
from operation |
41874.500 |
47844.600 |
252695.100 |
|
|
|
|
|
|
|
2 |
Expenses |
|
|
|
|
|
(a) Cost of
Material consumed |
645.200 |
105.800 |
1613.100 |
|
|
(b) Purchases of
stock-in-trade |
31415.300 |
44199.900 |
221713.800 |
|
|
(c) Changes in
Inventories of finished goods, Work-in-progress and stock-in-trade |
5698.100 |
(684.300) |
5727.700 |
|
|
(d) Employee
benefits expense |
418.100 |
523.200 |
1895.000 |
|
|
(e) Depreciation
and amortization expenses |
38.800 |
28.100 |
124.200 |
|
|
(f) Other
Expenses |
3233.700 |
3335.800 |
20695.200 |
|
|
Total expenses |
41449.200 |
47508.600 |
251769.000 |
|
|
|
|
|
|
|
3 |
Profit / (Loss)
from operations before other income, finance costs and exceptional items
(1-2) |
425.300 |
336.000 |
926.100 |
|
|
|
|
|
|
|
4 |
Other income |
1009.400 |
430.000 |
2223.400 |
|
|
|
|
|
|
|
5 |
Profit / (Loss)
From Ordinary activities before finance costs and exceptional items (5-6) |
1434.700 |
766.000 |
3149.500 |
|
6 |
Finance Costs |
110.400 |
151.400 |
669.900 |
|
|
|
|
|
|
|
7 |
Profit / (Loss) From ordinary activities after finance
cost but before exceptional items (5-6) |
1324.300 |
614.600 |
2479.600 |
|
8 |
Exceptional
items |
201.500 |
47.900 |
230.600 |
|
|
|
|
|
|
|
9 |
Profit / (Loss)
From ordinary activities before tax (7-8) |
1122.800 |
566.700 |
2249.000 |
|
|
|
|
|
|
|
10 |
Tax expense |
291.700 |
191.700 |
673.500 |
|
|
|
|
|
|
|
11 |
Net Profit /
(Loss) from ordinary activities after tax (9-10) |
831.100 |
375.000 |
1575.500 |
|
|
|
|
|
|
|
12 |
Extraordinary
items (net of tax expense) |
503.800 |
462.100 |
1389.100 |
|
|
|
|
|
|
|
13 |
Net Profit / Loss for the period (11-12) |
327.300 |
(87.100) |
186.400 |
|
|
|
|
|
|
|
14 |
Shares of Profit
/ (loss) of associates |
-- |
-- |
-- |
|
|
|
|
|
|
|
15 |
Minority
interest |
-- |
-- |
-- |
|
|
|
|
|
|
|
16 |
Net Profit /
(Loss) after taxes, minority interest and share of profit / (loss) of associates (13+14+15) |
327.300 |
(87.100) |
186.400 |
|
|
|
|
|
|
|
17 |
Paid-up equity
share Capital (Face value of
the share Rs. 1/- ) |
1000.000 |
1000.000 |
1000.000 |
|
|
|
|
|
|
|
18 |
Reserve
excluding revaluation Reserves as per balance sheet of previous accounting
year |
-- |
-- |
12418.700 |
|
|
|
|
|
|
|
19 i |
Earnings per share
(before extraordinary items) (of Rs. 1/-each) (not annualized): |
|
|
|
|
|
(a) Basic |
8.300 |
3.800 |
15.800 |
|
|
(b) Diluted |
8.300 |
3.800 |
15.800 |
|
|
|
|
|
|
|
19 ii |
Earnings per share
(after extraordinary items) (of Rs. 1/- each) (not annualized): |
|
|
|
|
|
(a) Basic |
3.300 |
(0.900) |
1.900 |
|
|
(b) Diluted |
3.300 |
(0.900) |
1.900 |
|
|
See accompanying
note to the financial results |
|
|
|
PART II
Information for the Quarter and Year ended on 31.03.2014
|
|
Particular |
Standalone |
||
|
|
|
Quarter Ended |
Year Ended |
|
|
|
|
31.03.2014 |
31.12.2013 |
31.03.2014 |
|
|
|
(Audited) |
(Unaudited) |
(Audited) |
|
A |
PARTICULARS, OF SHAREHOLDING |
|
|
|
|
1 |
Public Shareholding |
|
|
|
|
|
-Number Of shares |
100000000 |
100000000 |
100000000 |
|
|
-Percentage of shareholding |
10 |
10 |
10 |
|
|
|
|
|
|
|
2 |
Promoters and Promoter Group Shareholding |
|
|
|
|
|
a) Pledged / Encumbered |
|
|
|
|
|
-Number Of shares |
|
|
|
|
|
-Percentage of share (as a % of the total
shareholding of promoter and promoter group) |
|
|
|
|
|
-Percentage of share (as a % of the total share
capital of the company) |
|
|
|
|
|
b) Non - ancumbered |
|
|
|
|
|
-Number Of shares |
900000000 |
900000000 |
900000000 |
|
|
Percentage of share (as a % of the total
shareholding of promoter and promoter group) |
100.000 |
100.000 |
100.000 |
|
|
-Percentage of share (as a % of the total
share capital of the company) |
90 |
90 |
90 |
|
|
Particulars |
3 Months ended
31.03.2014 |
|
B |
INVESTOR COMPLAINTS |
|
|
|
Pending at the beginning of the quarter |
NIL |
|
|
Received during the quarter |
1 |
|
|
Disposed of during the quarter |
- |
|
|
Remaining unresolved at the end of the
quarter |
1 |
PART III
Segmentwise Revenue, Results and capital Employed
|
|
Particular |
Standalone |
||
|
|
|
Quarter Ended |
Year Ended |
|
|
|
|
31.03.2014 |
31.12.2013 |
31.03.2014 |
|
|
|
(Audited) |
(Unaudited) |
(Audited) |
|
|
Segment Revenue |
|
|
|
|
|
a) Precious Metals |
125787.700 |
14095.300 |
91731.400 |
|
|
b) Metals |
4284.300 |
3079.100 |
15191.100 |
|
|
c) Minerals |
6877.000 |
4753.800 |
23204.500 |
|
|
d) Coal and Hydrocarbon |
8160.900 |
9694.600 |
55963.500 |
|
|
e) Agro Products |
6116.700 |
4117.100 |
24696.800 |
|
|
f) Fertilizers |
3453.700 |
12004.700 |
39871.900 |
|
|
g) General Trade / Others |
17.200 |
15.100 |
87.100 |
|
|
TOTAL |
41490.500 |
47759.700 |
250746.300 |
|
|
|
|
|
|
|
|
Less. Inter Segment revenue |
NIL |
NIL |
NIL |
|
|
|
|
|
|
|
|
Net Sales |
41490.500 |
47759.97 |
250746.300 |
|
|
|
|
|
|
|
|
Segment Results |
|
|
|
|
|
Profit/(Loss) before tax and interest from each segment |
|
|
|
|
|
a) Precious Metals |
480.600 |
660.100 |
1297.300 |
|
|
b) Metals |
137.600 |
87.500 |
437.800 |
|
|
c) Minerals and Ores |
187.700 |
139.900 |
657.700 |
|
|
d) Hydrocarbon |
84.400 |
93.600 |
510.200 |
|
|
e) Agro Products |
104.900 |
46.800 |
366.700 |
|
|
f) Fertilizers |
36.100 |
29.500 |
109.500 |
|
|
g) Others |
12.800 |
14.800 |
76.600 |
|
|
TOTAL |
1044.100 |
1072.220 |
3455.800 |
|
|
|
|
|
|
|
|
Less: i) Interest (Net) |
(584.800) |
(235.400) |
(1112.600) |
|
|
ii) Other un-allocable expenditure net off unallocable income |
506.100 |
740.900 |
2319.400 |
|
|
Profit from ordinary activities before tax |
1122.800 |
566.700 |
2249.000 |
|
|
|
|
|
|
|
|
Capital Employed |
7842.200 |
5871.500 |
7842.200 |
|
|
|
|
|
|
|
|
a) Precious Metals |
2362.600 |
1761.500 |
2352.600 |
|
|
b) Metals |
1176.300 |
880.700 |
1176.300 |
|
|
c) Minerals and Ores |
78.400 |
58.700 |
78.400 |
|
|
d) Hydrocarbon |
1568.400 |
1174.300 |
1566.400 |
|
|
e) Agro products |
2352.700 |
1761.500 |
2352.700 |
|
|
f) Fertilizers |
- |
- |
- |
|
|
g) Others |
313.800 |
234.800 |
313.800 |
Standalone statement of Assets and Liabilities
|
Particular |
Standalone |
|
|
(Audited) |
|
|
As at |
|
|
31.03.2014 |
|
A EQUITY AND LIABILITIES |
|
|
1 Shareholders’ funds |
|
|
Share capital |
1000.000 |
|
Reserve and surplus |
12418.700 |
|
Sub-total – Shareholders’ fund |
13418.700 |
|
|
|
|
2 Non – current liabilities |
|
|
Long-term borrowings |
0.000 |
|
Other long – term liabilities |
99.500 |
|
Long term provision |
1824.900 |
|
Sub-total – Non-current liabilities |
1924.400 |
|
|
|
|
3 Current liabilities |
|
|
Short-term borrowing |
4129.400 |
|
Trade payables |
14574.800 |
|
Other current liabilities |
11732.700 |
|
Short-term provision |
1190.100 |
|
Sub-total – Current liabilities |
31627.000 |
|
TOTAL – EQUITY AND LIABILITIES |
46970.100 |
|
|
|
|
B ASSETS |
|
|
1 Non – current assets |
|
|
Fixed assets |
817.700 |
|
Goodwill on consolidation |
0.000 |
|
Non-current investments |
4456.600 |
|
Deferred tax assets (net) |
2261.600 |
|
Long-term loans and advances |
768.100 |
|
Other non-current assets |
14.600 |
|
Sub-total – Non current assets |
8318.600 |
|
|
|
|
2 Current assets |
|
|
Current investment |
560.000 |
|
Inventories |
3083.600 |
|
Trade receivables |
17341.200 |
|
Cash and Cash equivalents |
4726.700 |
|
Short-term loans and advances |
6871.200 |
|
Other current assets |
6068.800 |
|
Sub-total – Current assets |
38651.500 |
|
TOTAL - ASSETS |
46970.100 |
FIXED ASSETS:
- Land freehold
- Land
Leasehold
- Building
- Drainage
- Plant and
Equipment
- Furniture and
Fixture
- Vehicles
- Office
Equipment
- Railway Wagon
Rakes
- Railway loop
Line at BNHT
- Warehouse
- Computer /
Data Processors
CMT REPORT (Corruption, Money Laundering & Terrorism]
The Public Notice information has been collected from various sources
including but not limited to: The Courts,
1] INFORMATION ON
DESIGNATED PARTY
No exist designating subject or any of its beneficial owners, controlling
shareholders or senior officers as terrorist or terrorist organization or whom
notice had been received that all financial transactions involving their assets
have been blocked or convicted, found guilty or against whom a judgement or
order had been entered in a proceedings for violating money-laundering,
anti-corruption or bribery or international economic or anti-terrorism sanction
laws or whose assets were seized, blocked, frozen or ordered forfeited for
violation of money laundering or international anti-terrorism laws.
2] Court Declaration :
No exist to suggest that subject is or was
the subject of any formal or informal allegations, prosecutions or other
official proceeding for making any prohibited payments or other improper
payments to government officials for engaging in prohibited transactions or
with designated parties.
3] Asset Declaration :
No records exist to suggest that the property or assets of the subject
are derived from criminal conduct or a prohibited transaction.
4] Record on Financial
Crime :
Charges or conviction
registered against subject: None
5] Records on Violation of
Anti-Corruption Laws :
Charges or
investigation registered against subject: None
6] Records on Int’l
Anti-Money Laundering Laws/Standards :
Charges or
investigation registered against subject: None
7] Criminal Records
No
available information exist that suggest that subject or any of its principals
have been formally charged or convicted by a competent governmental authority
for any financial crime or under any formal investigation by a competent
government authority for any violation of anti-corruption laws or international
anti-money laundering laws or standard.
8] Affiliation with
Government :
No record
exists to suggest that any director or indirect owners, controlling
shareholders, director, officer or employee of the company is a government
official or a family member or close business associate of a Government
official.
9] Compensation Package :
Our market
survey revealed that the amount of compensation sought by the subject is fair
and reasonable and comparable to compensation paid to others for similar
services.
10] Press Report :
No press reports / filings exists on
the subject.
CORPORATE GOVERNANCE
MIRA INFORM as part of its Due Diligence do provide comments on
Corporate Governance to identify management and governance. These factors often
have been predictive and in some cases have created vulnerabilities to credit
deterioration.
Our Governance Assessment focuses principally on the interactions
between a company’s management, its Board of Directors, Shareholders and other
financial stakeholders.
CONTRAVENTION
Subject is not known to have contravened any existing local laws,
regulations or policies that prohibit, restrict or otherwise affect the terms
and conditions that could be included in the agreement with the subject.
FOREIGN EXCHANGE RATES
|
Currency |
Unit
|
Indian Rupees |
|
US Dollar |
1 |
Rs. 60.10 |
|
|
1 |
Rs. 102.32 |
|
Euro |
1 |
Rs. 81.75 |
INFORMATION DETAILS
|
Information
Gathered by : |
NYA |
|
|
|
|
Analysis Done by
: |
SUM |
|
|
|
|
Report Prepared
by : |
TRU |
SCORE & RATING EXPLANATIONS
|
SCORE FACTORS |
RANGE |
POINTS |
|
HISTORY |
1~10 |
6 |
|
PAID-UP CAPITAL |
1~10 |
6 |
|
OPERATING SCALE |
1~10 |
6 |
|
FINANCIAL CONDITION |
|
|
|
--BUSINESS SCALE |
1~10 |
5 |
|
--PROFITABILIRY |
1~10 |
4 |
|
--LIQUIDITY |
1~10 |
6 |
|
--LEVERAGE |
1~10 |
6 |
|
--RESERVES |
1~10 |
6 |
|
--CREDIT LINES |
1~10 |
5 |
|
--MARGINS |
-5~5 |
|
|
DEMERIT POINTS |
|
|
|
--BANK CHARGES |
YES/NO |
YES |
|
--LITIGATION |
YES/NO |
YES |
|
--OTHER ADVERSE INFORMATION |
YES/NO |
NO |
|
MERIT POINTS |
|
|
|
--SOLE DISTRIBUTORSHIP |
YES/NO |
NO |
|
--EXPORT ACTIVITIES |
YES/NO |
YES |
|
--AFFILIATION |
YES/NO |
YES |
|
--LISTED |
YES/NO |
YES |
|
--OTHER MERIT FACTORS |
YES/NO |
YES |
|
--RBI |
YES/NO |
NO |
|
--EPF |
YES/NO |
NO |
|
TOTAL |
|
50 |
This score serves as a reference to assess SC’s
credit risk and to set the amount of credit to be extended. It is calculated
from a composite of weighted scores obtained from each of the major sections of
this report. The assessed factors and their relative weights (as indicated
through %) are as follows:
Financial
condition (40%) Ownership
background (20%) Payment
record (10%)
Credit history
(10%) Market trend (10%) Operational size
(10%)
RATING EXPLANATIONS
|
RATING |
STATUS |
PROPOSED CREDIT LINE |
|
|
>86 |
Aaa |
Possesses an extremely sound financial base with the strongest
capability for timely payment of interest and principal sums |
Unlimited |
|
71-85 |
Aa |
Possesses adequate working capital. No caution needed for credit
transaction. It has above average (strong) capability for payment of interest
and principal sums |
Large |
|
56-70 |
A |
Financial & operational base are regarded healthy. General
unfavourable factors will not cause fatal effect. Satisfactory capability for
payment of interest and principal sums |
Fairly Large |
|
41-55 |
Ba |
Overall operation is considered normal. Capable to meet normal
commitments. |
Satisfactory |
|
26-40 |
B |
Capability to overcome financial difficulties seems comparatively below
average. |
Small |
|
11-25 |
Ca |
Adverse factors are apparent. Repayment of interest and principal sums
in default or expected to be in default upon maturity |
Limited with
full security |
|
<10 |
C |
Absolute credit risk exists. Caution needed to be exercised |
Credit not
recommended |
|
-- |
NB |
New Business |
-- |
This report is issued at your request without any
risk and responsibility on the part of MIRA INFORM PRIVATE LIMITED (MIPL) or
its officials.