MIRA
INFORM REPORT
|
Report Date : |
07.03.2014 |
IDENTIFICATION DETAILS
|
Name : |
HUNE RENTAL SL |
|
|
|
|
Registered Office : |
C/ Haya, 4 1 Planta, |
|
|
|
|
Country : |
|
|
|
|
|
Financials (as on) : |
2012 |
|
|
|
|
Date of Incorporation : |
19.06.2006 |
|
|
|
|
Legal Form : |
Private Company |
|
|
|
|
Line of Business : |
Engaged in renting and leasing of construction and civil engineering
machinery and equipment |
|
|
|
|
No. of Employees |
520 (2014) |
RATING & COMMENTS
|
MIRA’s Rating : |
Ca |
|
RATING |
STATUS |
PROPOSED CREDIT LINE |
|
|
11-25 |
Ca |
Adverse factors are apparent. Repayment of interest and principal sums
in default or expected to be in default upon maturity |
Limited with
full security |
|
Maximum Credit Limit : |
Euro 15.000 |
|
|
|
|
Status : |
Moderate |
|
|
|
|
Payment Behaviour : |
Slow |
|
|
|
|
Litigation : |
--- |
NOTES :
Any query related to this report can be made
on e-mail : infodept@mirainform.com
while quoting report number, name and date.
ECGC Country Risk Classification List – december 01, 2013
|
Country Name |
Previous Rating (30.09.2013) |
Current Rating (01.12.2013) |
|
Spain |
A2 |
A2 |
|
Risk Category |
ECGC
Classification |
|
Insignificant |
A1 |
|
Low |
A2 |
|
Moderate |
B1 |
|
High |
B2 |
|
Very High |
C1 |
|
Restricted |
C2 |
|
Off-credit |
D |
Spain ECONOMIC OVERVIEW
After almost 15
years of above average GDP growth, the Spanish economy began to slow in late
2007 and entered into a recession in the second quarter of 2008. GDP contracted
by 3.7% in 2009, ending a 16-year growth trend, and by another 0.3% in 2010;
GDP expanded 0.4% in 2011, before contracting 1.4% in 2012. The economy has
once again fallen into recession as deleveraging in the private sector, fiscal
consolidation, and continued high unemployment weigh on domestic demand and investment,
even as exports have shown signs of resiliency. The unemployment rate rose from
a low of about 8% in 2007 to 26.0% in 2012. The economic downturn has also hurt
Spain's public finances. The government budget deficit peaked at 11.2% of GDP
in 2010 and the process to reduce this imbalance has been slow despite the
central government's efforts to raise new tax revenue and cut spending. Spain
reduced its budget deficit to 9.4% of GDP in 2011, and roughly 7.4% of GDP in
2012, above the 6.3% target negotiated between Spain and the EU. Although
Spain''s large budget deficit and poor economic growth prospects remain a
source of concern for foreign investors, the government''s ongoing efforts to
cut spending and introduce flexibility into the labor markets are intended to
assuage these concerns. The government is also taking steps to shore up the
banking system, namely by using up to $130 billion in EU funds to recapitalize
struggling banks exposed to the collapsed domestic construction and real estate
sectors.
|
Source
: CIA |
EXECUTIVE SUMMARY
|
Name: |
HUNE
RENTAL SL |
|
NIF
/ Fiscal code: |
B84736354 |
|
Status: |
ACTIVE |
|
Incorporation
Date: |
19/06/2006 |
|
Register
Data |
Register
Section 8 Sheet 410367 |
|
Last
Publication in BORME: |
19/02/2014
[Appointments] |
|
Last
Published Account Deposit: |
2011 |
|
Share
Capital: |
6.936.089 |
|
|
|
|
Localization: |
C/
HAYA, 4 1 PLANTA. - MADRID - 28044 - MADRID |
|
Telephone
- Fax - Email - Website: |
Ph.:.
902108686 |
|
Number
of Branches |
4 |
|
|
|
|
Activity: |
|
|
NACE: |
7732
- Renting and leasing of construction and civil engineering machinery and
equipment |
|
Registered
Trademarks: |
|
|
Audited
/ Opinion: |
Si
/ |
|
Tenders
and Awards: |
0
for a total cost of 0 |
|
Subsidies: |
0
for a total cost of 0 |
|
Quality
Certificate: |
No |
|
|
Poor credit rating. Its
capacity to repay its financial obligations is uncertain. High probability of
failure to meet some of its obligations. High sensitivity to financial
environment changes. |
|
Maximum
recommended commercial credit: |
Euro 15.000 |
|
|
|
|
Currency in the report is in Euro |
|
|
Defaults,
Legal Claims and Insolvency Proceedings : |
||||
|
|
|
Number |
Amount
(€) |
Most
Recent Entry |
|
Insolvency
Proceedings, Bankruptcy and Suspension of Payments |
|
Unpublished |
--- |
--- |
|
Defaults
on debt with Financial Institutions and Large Companies |
|
None |
--- |
--- |
|
Judicial
Claims (Notices, Executive Proceedings, Attachments, Auctions, Bad Debt) |
|
1 |
0 |
--- |
|
Proceedings
heard by the Civil Court |
|
Unpublished |
0 |
--- |
|
Proceedings
heard by the Labour Court |
|
Unpublished |
0 |
--- |
Partners
|
LUIS
ANGEL SALAS MANRIQUE |
2.39
% |
|
|
MASTHEAD
PORTFOLIO SOCIEDAD LIMITADA |
43
% |
|
|
RAFAEL
DUYOS ALVAREZARENAS |
2.17
% |
|
|
RAMON
SANTAMARIA TRILLO |
2.17
% |
|
|
SORFINSA,
S.A. |
49.89
% |
|
|
Shares: |
2 |
|
|
Other
Links: |
8 |
|
|
No.
of Active Corporate Bodies: |
|
|
|
Ratios |
2012 |
2011 |
Change |
|
|
Guarantees: |
|
|
Properties
Registered: |
Company
NO, Administrator NO |
|
Financing
/ Guarantee Sources : |
Sources
YES, Guarantees YES |
|
|
|
INVESTIGATION
SUMMARY
|
|
|
The
subject is a leader company in its activity and its evolution is conditioned by
the current situation of the market. Due to the accumulation of losses in the
latest years, there is an important debt situation. It has not guarantees
with its creditors. |
|
|
Identification
|
|
|
Social
Denomination: |
HUNE RENTAL SL |
|
NIF
/ Fiscal code: |
B84736354 |
|
Corporate
Status: |
ACTIVE |
|
Start
of activity: |
2006 |
|
Registered
Office: |
C/ HAYA, 4 1 PLANTA. |
|
Locality: |
MADRID |
|
Province: |
MADRID |
|
Postal
Code: |
28044 |
|
Telephone: |
902108686 |
|
Branch Offices |
|||||
|
|
|
||||
|
Address |
Postal Code |
City |
Province |
|
|
|
Zenc, 10 |
08755 |
CASTELLBISBAL |
BARCELONA |
|
|
|
Sabadell (Pol. Ind. Sot
dels Pradals), 24 |
08500 |
VIC |
BARCELONA |
|
|
|
Av. Palmeras (Pol. Ind. La
Sendilla), S/N |
28350 |
CIEMPOZUELOS |
MADRID |
|
|
|
Av. Comarques del País
Valencià, 99 BL.2 |
46930 |
QUART DE POBLET |
VALENCIA |
|
|
Activity
|
NACE: |
7732 |
|
CNAE
Obtaining Source: |
7732 |
|
Additional
Information: |
The subject is engaged in leasing of machinery and lifting platform without driver. It also has prefabricated units for project’s, installations, sanitary and generators with high, medium and low power. It works for companies in different sectors such as construction, industry, energy, services, maintenance of installations and infrastructures... The subject has machinery with more than 23 thousands of units, of which 10 thousands are big machines. Its trade area is all Spain, Portugal and France and it has 8 areas which include more than 35 branches where the subject gives service to their customer. The subject also has a big fleet with more than 250 vehicles distributed in all the branches and a team formed by more than 400 technicians. |
|
Additional
Address: |
Registered office and central offices, rented by the company, are located in C/ HAYA, 4, 1ª PLANTA, 28014-MADRID. |
|
Import
/ export: |
YES IMPORT / YES EXPORT |
|
Future
Perspective: |
Face recession |
|
Industry
situation: |
Decline |
Number of Employees
|
|
Year |
No. of employees |
Established |
Incidentals |
|
|
|
2014 |
520 |
|
|
|
Chronological Summary
|
|
Year |
Act |
|
|
|
2006 |
Appointments/ Re-elections
(2) Cessations/ Resignations/ Reversals (1) Change of Social Denomination (1)
Change of Social Purpose (1) Change of Social address (1) Company Formation
(1) Declaration of Sole Propietorship (2) Increase of Capital (1) Loss of the
sole propietorship condition (1) Other Concepts/ Events (1) Statutory
Modifications (2) |
|
|
|
2007 |
Accounts deposit (ejer.
2006) Appointments/ Re-elections (7) Cessations/ Resignations/ Reversals (1)
Increase of Capital (3) Statutory Modifications (1) |
|
|
|
2008 |
Accounts deposit (ejer.
2006 consolidated, 2007 consolidated, 2007) Appointments/ Re-elections (9)
Cessations/ Resignations/ Reversals (4) Change of Social Denomination (1)
Change of Social address (1) Increase of Capital (2) Other Concepts/ Events (1)
Statutory Modifications (1) |
|
|
|
2009 |
Accounts deposit (ejer.
2008) Appointments/ Re-elections (1) Cessations/ Resignations/ Reversals (2)
Statutory Modifications (1) |
|
|
|
2010 |
Accounts deposit (ejer. 2008
consolidated) Appointments/ Re-elections (2) Cessations/ Resignations/
Reversals (2) Loss of the sole propietorship condition (1) Statutory
Modifications (1) |
|
|
|
2011 |
Accounts deposit (ejer. 2010
consolidated, 2009, 2010) Appointments/ Re-elections (7) Cessations/
Resignations/ Reversals (3) Change of Social Purpose (1) Other Concepts/
Events (1) Take-over Merger (4) |
|
|
|
2012 |
Accounts deposit (ejer. 2011)
Appointments/ Re-elections (5) Cessations/ Resignations/ Reversals (5) |
|
|
|
2013 |
Accounts deposit (ejer.
2009 consolidated, 2011 consolidated, 2012 consolidated) Appointments/
Re-elections (3) Capital Reduction (1) |
|
|
|
2014 |
Appointments/ Re-elections
(1) Cessations/ Resignations/ Reversals (1) |
|
Main Historic Changes |
|||
|
|
|
|
|
|
Concept |
Publication |
Act |
Date |
|
Corporate Purpose Changes: |
LA GESTION Y EXPLOTACION DE
MAQUINARIA INDUSTRIAL, INCLUYENDO LA CESIÓN DE USO A TERCEROS Y SU
COMPRAVENTA |
Corporate Purpose Change |
05/10/2006 |
|
|
EL ASESORAMIENTO EN
MATERIA ECONOMICA, CONTABLE Y FINANCIERA |
Company Formation |
11/07/2006 |
Breakdown of Owners'
Equity
|
|
|
Registered
Capital: |
6.936.089 |
|
Paid
up capital: |
6.936.089 |
Updated Evolution of the Subscribed and Paid-in Capital |
|||||
|
|
|
|
|
|
|
|
|
|||||
|
|
|
|
|
|
|
|
Publishing Date |
Registration Type |
Capital Subscribed |
Paid up capital |
Underwritten result |
Disbursed Result |
|
28/06/2006 |
Company Formation |
3.600 |
3.600 |
3.600 |
3.600 |
|
22/09/2006 |
Increase of Capital |
4.977.650 |
4.977.650 |
4.981.250 |
4.981.250 |
|
28/06/2007 |
Increase of Capital |
249.824 |
249.824 |
5.231.074 |
5.231.074 |
|
28/06/2007 |
Increase of Capital |
238.603 |
238.603 |
5.469.677 |
5.469.677 |
|
13/07/2007 |
Increase of Capital |
961.624 |
961.624 |
6.431.301 |
6.431.301 |
|
28/01/2008 |
Increase of Capital |
395.958 |
395.958 |
6.827.259 |
6.827.259 |
|
28/01/2008 |
Increase of Capital |
695.614 |
695.614 |
7.522.873 |
7.522.873 |
|
04/01/2013 |
Capital Reduction |
-586.784 |
-586.784 |
6.936.089 |
6.936.089 |

Active Social Bodies
|
Post published |
Social Body's Name |
Appointment Date |
Other Positions in this
Company |
|
PRESIDENT |
ADMINISTRACION PROFESIONAL
INDEPENDIENTE SL |
12/02/2014 |
2 |
|
MEMBER OF THE BOARD |
SALAS MANRIQUE LUIS-ANGEL |
12/02/2014 |
1 |
|
|
MASTHEAD PORTFOLIO SL |
20/07/2010 |
1 |
|
|
ADMINISTRACION PROFESIONAL
INDEPENDIENTE SL |
20/07/2010 |
2 |
|
JOINT ATTORNEY |
LLEONART FAUS MARIA TERESA |
14/02/2013 |
1 |
|
|
MIRA FERNANDEZ MARIA |
14/02/2013 |
1 |
|
|
SANTAMARIA RAMON |
07/06/2011 |
1 |
|
|
HUERTAS ORDOÑEZ JOSE
ANTONIO |
07/06/2011 |
1 |
|
|
BANZO ROMERO SERGIO |
07/06/2011 |
1 |
|
|
DUYOS ALVAREZ ARENAS
RAFAEL |
07/06/2011 |
1 |
|
|
GRECO SANABRIA SERGIO |
07/06/2011 |
1 |
|
|
GARCIA CAPELO MANUEL |
07/06/2011 |
1 |
|
PROXY |
SALAS MANRIQUE LUIS ANGEL |
14/10/2013 |
2 |
|
|
MARTIN TANARRO JUAN
IGNACIO |
17/08/2012 |
1 |
|
|
RODRIGUEZ MUÑOZ FRANCISCO |
17/08/2012 |
2 |
|
|
PEINADO VALLEJO BEATRIZ |
10/05/2012 |
5 |
|
|
VILLATE ESPIGA MIGUEL
ANGEL |
20/07/2010 |
2 |
|
|
PARRONDO PEREZ FERNANDO |
31/01/2008 |
1 |
|
NON CONSELLOR SECRETARY |
BILBAO MANCISIDOR IÑIGO |
20/07/2010 |
1 |
|
NON CONSELLOR ASSISTANT
SECRETARY |
SIRODEY LIÑARES JORGE |
12/02/2014 |
1 |
|
REPRESENTATIVE |
FERNANDEZ DE SANTAELLA DE
HEREDIA FERNANDO MARIA |
16/10/2012 |
1 |
|
|
VILLATE ESPIGA MIGUEL
ANGEL |
20/07/2010 |
2 |
|
ACCOUNTS' AUDITOR / HOLDER |
KPMG AUDITORES SL |
11/10/2013 |
8 |
|
CONSOLIDATED ACCOUNTS'
AUDITOR |
KPMG AUDITORES SL |
11/10/2013 |
8 |
Historical Social Bodies
|
Social Body's Name |
Post published |
End Date |
Other Positions in this
Company |
|
ADVENT RENTAL HOLDINGS SCA |
SINGLE PARTNER |
04/11/2010 |
1 |
|
ANTON LAZARO PEDRO |
JOINT ATTORNEY/COMBINED
PROXY |
04/02/2011 |
1 |
|
AZNAR SANTOS SANTIAGO |
PROXY |
20/07/2010 |
1 |
|
BORREGO GUTIERREZ JESUS |
JOINT ATTORNEY |
03/12/2011 |
1 |
|
CAMILLERI TERRER LUIS |
PRESIDENT |
09/12/2009 |
11 |
|
|
MEMBER OF THE EXECUTIVE
COMM. |
09/12/2009 |
|
|
|
VICE CHAIRMAN |
03/12/2008 |
|
|
|
PROXY |
25/06/2007 |
|
|
|
MEMBER OF THE BOARD |
04/02/2008 |
|
|
|
PROXY |
26/02/2008 |
|
|
|
COMBINED PROXY |
22/12/2008 |
|
|
|
MEMBER OF THE BOARD |
09/12/2009 |
|
|
|
PRESIDENT OF THE EXECUTIVE
COMM. |
09/12/2009 |
|
|
|
COMBINED PROXY |
04/02/2011 |
|
|
|
PROXY |
04/02/2011 |
|
|
CARVAJAL Y URQUIJO JAIME |
MEMBER OF THE BOARD |
09/12/2009 |
1 |
|
CASTRO VILLANUEVA ESTHER |
JOINT ATTORNEY |
02/01/2012 |
1 |
|
CEBAMANOS JARRETA EMILIO |
MEMBER OF THE BOARD |
12/02/2014 |
3 |
|
|
REPRESENTATIVE |
03/12/2008 |
|
|
|
PRESIDENT |
12/02/2014 |
|
|
DE ENTRAMBASAGUAS MONSELL
JOAQUIN |
JOINT ATTORNEY/COMBINED
PROXY |
29/08/2008 |
1 |
|
DEL CAMPO RODRIGUEZ MIGUEL |
MEMBER OF THE BOARD |
03/12/2008 |
1 |
|
DIAZ LAVIADA MARTURET JUAN |
PROXY |
04/02/2011 |
3 |
|
|
MEMBER OF THE BOARD |
09/12/2009 |
|
|
|
PROXY |
25/06/2007 |
|
|
DIONIS TRENOR JUAN |
MEMBER OF THE BOARD |
04/02/2008 |
5 |
|
|
MEMBER OF THE BOARD |
09/12/2009 |
|
|
|
CHIEF EXECUTIVE OFFICER |
09/12/2009 |
|
|
|
MEMBER OF THE EXECUTIVE
COMM. |
09/12/2009 |
|
|
|
SINGLE ADMINISTRATOR |
20/07/2010 |
|
|
EIGEL CHRISTIAN HOEDL |
PROXY |
04/02/2011 |
2 |
|
|
NON CONSELLOR SECRETARY |
17/01/2008 |
|
|
ESCUDERO CUESTA DAVID |
NON CONSELLOR ASSISTANT
SECRETARY |
25/06/2007 |
1 |
|
GIMENEZ SANCHEZ AUDITORES
SL |
ACCOUNTS' AUDITOR / HOLDER |
30/11/2010 |
1 |
|
KPMG AUDITORES SL |
ACCOUNTS' AUDITOR / HOLDER |
30/11/2010 |
8 |
|
|
CONSOLIDATED ACCOUNTS'
AUDITOR |
30/11/2010 |
|
|
|
ACCOUNTS' AUDITOR / HOLDER |
25/06/2008 |
|
|
|
CONSOLIDATED ACCOUNTS' AUDITOR |
25/06/2008 |
|
|
|
CONSOLIDATED ACCOUNTS'
AUDITOR |
11/10/2013 |
|
|
|
ACCOUNTS' AUDITOR / HOLDER |
11/10/2013 |
|
|
LATORRE & ASOCIADOS
CONSULTORIA S.L |
SINGLE PARTNER |
22/09/2006 |
1 |
|
LATORRE ATANCE ALEJANDRO |
JOINT MANAGER |
22/09/2006 |
1 |
|
LECHON ALFONSO FERNANDO |
JOINT ATTORNEY |
27/11/2012 |
1 |
|
LOVELUS PRINCIPE SL |
MEMBER OF THE BOARD |
03/12/2008 |
2 |
|
|
PRESIDENT |
03/12/2008 |
|
|
MANTECA PRIETO PAOLA |
PROXY |
17/08/2012 |
1 |
|
MARTIN SERRANO FRANCISCO |
JOINT ATTORNEY |
31/10/2012 |
1 |
|
NAVARRO MARTINEZ PEDRO
ANGEL |
REPRESENTATIVE |
03/12/2008 |
1 |
|
PARDO BLASCO ENRIQUE |
JOINT ATTORNEY |
03/12/2011 |
1 |
|
PAZ VALBUENA JAVIER |
NON CONSELLOR ASSISTANT
SECRETARY |
17/01/2008 |
1 |
|
PEINADO VALLEJO BEATRIZ |
NON CONSELLOR SECRETARY |
09/12/2009 |
5 |
|
|
JOINT ATTORNEY |
10/05/2012 |
|
|
|
NON CONSELLOR SECRETARY |
04/02/2008 |
|
|
|
SECRETARY |
09/12/2009 |
|
|
PERELLI BOTELLO JORGE |
MEMBER OF THE BOARD |
17/01/2008 |
2 |
|
|
PROXY |
17/01/2008 |
|
|
PUIG FABREGA GASPAR |
MEMBER OF THE BOARD |
08/01/2009 |
1 |
|
RODRIGUEZ CARMONA GONZALEZ
ALEJANDRO |
REPRESENTATIVE |
16/10/2012 |
1 |
|
RODRIGUEZ MUÑOZ FRANCISCO |
JOINT ATTORNEY |
17/08/2012 |
2 |
|
RUBIO MARTINEZ DE LECEA
MANUEL |
NON CONSELLOR ASSISTANT
SECRETARY |
23/05/2011 |
1 |
|
SALAS MANRIQUE LUIS ANGEL |
PROXY |
14/10/2013 |
2 |
|
SANTIAGO PEREZ ANTONIO |
JOINT MANAGER |
22/09/2006 |
1 |
|
SOTO MEDINA CARLOS MARIA |
PROXY |
04/02/2011 |
11 |
|
|
COMBINED PROXY |
04/02/2011 |
|
|
|
PROXY |
26/02/2008 |
|
|
|
PROXY |
25/06/2007 |
|
|
|
MEMBER OF THE BOARD |
17/01/2008 |
|
|
|
MEMBER OF THE EXECUTIVE
COMM. |
03/12/2008 |
|
|
|
VICE SECRETARY |
03/12/2008 |
|
|
|
COMBINED PROXY |
22/12/2008 |
|
|
|
MEMBER OF THE EXECUTIVE
COMM. |
09/12/2009 |
|
|
|
VICE CHAIRMAN |
09/12/2009 |
|
|
|
MEMBER OF THE BOARD |
09/12/2009 |
|
|
TORRES MICHELENA PEDRO |
MEMBER OF THE BOARD |
03/12/2008 |
1 |
|
TORRES MICHELENA PEDRO
VICENTE |
PROXY |
31/10/2012 |
1 |
|
TROPOSFERA SL |
MEMBER OF THE BOARD |
03/12/2008 |
1 |
Executive board
|
Post |
NIF |
Name |
|
GENERAL MANAGER |
|
LUIS ANGEL SALAS MANRIQUE |
Defaults, Legal Claims and Insolvency Proceedings
Section enabling assessment
of the degree of compliance of the company queried with its payment obligations.
It provides information on the existence and nature of all stages of Insolvency
and Legal Proceedings published with reference to the Company in the country's
various Official Bulletins and national newspapers, as well Defaults Registered
in the main national credit bureaus (ASNEF Industrial and RAI ).
>
Summary
Chronological summary
|
|
|
Number
of Publications |
Amount
(_) |
Start
date |
End
date |
|
Insolvency
Proceedings, Bankruptcy and Suspension of Payments |
|
Unpublished |
--- |
--- |
--- |
|
Request/Declaration |
|
0 |
--- |
date |
|
|
Proceedings |
|
--- |
--- |
|
--- |
|
Resolution |
|
--- |
--- |
|
--- |
|
Defaults
on debt with Financial Institutions and Large Companies |
Bank and Commercial Delinquency |
None |
0 |
|
|
|
Status:
Friendly |
|
--- |
|
|
|
|
Status:
Pre-Litigation |
|
--- |
|
|
|
|
Status:
Litigation |
|
--- |
|
|
|
|
Status:
Non-performing |
|
--- |
|
|
|
|
Status:
insolvency proceedings, bankruptcy and suspension of payments |
|
--- |
|
|
|
|
Other
status |
|
--- |
|
|
|
|
Legal
and Administrative Proceedings |
|
1 |
--- |
29/01/2013 |
29/01/2013 |
|
Notices
of defaults and enforcement |
|
1 |
--- |
|
--- |
|
Seizures |
|
--- |
--- |
|
--- |
|
Auctions |
|
--- |
--- |
|
--- |
|
Declarations
of insolvency and bad debt |
|
--- |
--- |
|
--- |
|
Proceedings
heard by the Civil Court |
|
Unpublished |
--- |
|
|
|
Proceedings
heard by the Labour Court |
|
Unpublished |
--- |
|
|
Details
> Basis for rating
|
Positive Factors |
Adverse Factors |
|
|
Presents significant legal proceedings. Debts resulting from non-payment to Public Administrations or from lawsuits filed by individuals before the Courts of the different jurisdictions have been published in the Official Gazettes. However, given the nature of these legal proceedings and volume of this company's turnover, they are not considered serious. It has no operating income return. The Company has no return on the investments necessary for its main activity with respect to its assets. Insufficient long-term solvency. As the Real Assets of the company do not exceed its total debts, it does not offer, in principle, real property guarantee for settlement of its long-term obligations to third parties. The Company's show losses in the development of its ordinary activities in 2012 and in 2011. During 2012 the company renewed its customer portfolio 2.59 times. This reflects an approximate average payment collection term of 150 días days. Average payment term to suppliers is longer than average payment term from customers. This means that the company pays to suppliers later than it receives payment from its customers. This benefits the company from a financial perspective, as it may increase its income; whereas it is risky for suppliers, who are, therefore, financing the company. |
Probability of default
> Probabilidad Estimada
de Impago para los próximos 12 meses: 17.2 %
> Latest Rating Changes :
|
Sector
in which comparison is carried out : 773 Renting
and leasing of other machinery, equipment and tangible goods |
|
|
Relative
Position:
|
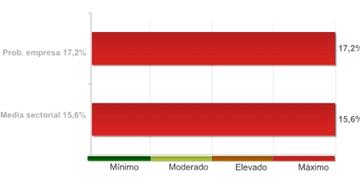
The
company's comparative analysis with the rest of the companies that comprise the
sector, shows the company holds a worse position with regard to the probability
of non-compliance.
The
97% of the companies of the sector HUNE RENTAL SL belongs to shows a lower
probability of non-compliance.
The
probability of the company's non-compliance with its payment obligations within
deadlines estimated by our qualifications models is 17.18%.
In the event they fail to comply with the payment, the seriousness of the loss will depend on factors such as the promptness of the commencement of the charging management, the existence of executive documents which match the credit or the existence of guarantees and free debt assets under the name of the debtor. Therefore, the probability of non-compliance should not be solely interpreted as the total loss of the owed amount.
Result of query submitted to the R.A.I. (Spanish Bad Debt Register) on
LEGAL
CLAIMS
|
Summary of Judicial Claims |
|
|
|
|
|
|
|
|
||
|
|
|
No se han publicado |
|
|
|
|
No se han publicado |
|
|
|
|
||
|
|
|
No se han publicado |
|
|
|
|
No se han publicado |
|
|
|
|
No se han publicado |
|
|
|
|
|
|
|
|
|
||
|
|
|
No se han publicado |
|
|
|
|
No se han publicado |
|
|
|
|
||
|
|
|
No se han publicado |
|
|
Incidences
Detailed |
|
Incidences
with the Local Administration |
|
|
|
|
|
Last
Published Stage: |
SEIZURE |
|
|
Record
Number: |
2012321698 |
|
|
Amount
of the incidence: |
0,00
E |
|
|
Requested
by: |
ADMINISTRACION
LOCAL |
|
|
Published
domicile: |
(DESCONOCIDA) |
|
|
Source: |
BOLETIN
DE NAVARRA Nº35, 2013 PAGINA 2076 |
|
Link List
|
ABSORBS TO: |
2 Entities |
|
HAS IN ITS ADMINISTRATION
BOARD TO: |
2 Entities |
|
IS RELATED WITH: |
4 Entities |
|
PARTICIPATES IN: |
2 Entities |
|
SHAREHOLDERS: |
5 Entities |
> Shareholders
|
Relationship |
Entity |
Province |
Shareholding stake |
|
SHAREHOLDERS |
LUIS ANGEL SALAS MANRIQUE |
|
2.39 |
|
|
MASTHEAD PORTFOLIO
SOCIEDAD LIMITADA |
VIZCAYA |
43 |
|
|
RAFAEL DUYOS ALVAREZARENAS |
|
2.17 |
|
|
RAMON SANTAMARIA TRILLO |
|
2.17 |
|
|
SORFINSA, S.A. |
|
49.89 |
|
PARTICIPATES IN |
HUNE ALUGUER LDA
(PORTUGAL) |
|
100 |
|
|
HUNE LOCATION SARL
(FRANCIA) |
|
100 |
> Other relationships
|
Relationship |
Entity |
Province |
Shareholding stake |
|
IS RELATED WITH |
| | |
|
|
|
|
HUNE LOCATION FRANCE SARL |
|
|
|
|
HUNE RENTAL FINANCE SARL |
|
|
|
|
PLATEFORMES ELEVATRICES
UMESA |
|
|
|
|
ADMINISTRACION PROFESIONAL
INDEPENDIENTE S.L. |
GUIPUZCOA |
|
|
ABSORBS TO |
HUNE PLATAFORMAS S.A |
BARCELONA |
|
|
|
HUNE MAQUINARIA S.L |
MADRID |
|
|
HAS IN ITS ADMINISTRATION
BOARD TO |
ADMINISTRACION PROFESIONAL
INDEPENDIENTE S.L. |
GUIPUZCOA |
|
|
|
MASTHEAD PORTFOLIO
SOCIEDAD LIMITADA |
VIZCAYA |
|
|
Turnover |
|
|
Total
Sales 2013 |
53.100.000,00 |
|
Financial Accounts and Balance Sheets |
Financial Years Presented
|
Ejercicio |
Tipo
de Cuentas Anuales |
Fecha
Presentacion |
|
2012 |
Consolidadas |
July
2013 |
|
2012 |
Normales |
No
publicado en BORME |
|
2011 |
Consolidadas |
May
2013 |
|
2011 |
Normales |
December
2012 |
|
2010 |
Consolidadas |
July
2011 |
|
2010 |
Normales |
May
2011 |
|
2009 |
Consolidadas |
May
2013 |
|
2009 |
Normales |
January
2011 |
|
2008 |
Consolidadas |
January
2010 |
|
2008 |
Normales |
November
2009 |
|
2007 |
Consolidadas |
November
2008 |
|
2007 |
Normales |
September
2008 |
|
2006 |
Consolidadas |
September
2008 |
|
2006 |
Normales |
November
2007 |
|
2006 |
Normales |
September
2008 |
The
data in the report regarding the last Company Accounts submitted by the company
is taken from the TRADE REGISTER serving the region in which the company's
address is located 31/12/2012
> Balance en formato
Normal de acuerdo al Nuevo Plan General Contable 2007
Information corresponding to the fiscal year
2012 2011 2010 2009 2008 is taken from information
submitted to the TRADE REGISTER. Data corresponding to fiscal years before
2012 2011 2010 2009 2008 has been compiled based on
the equivalence criteria stipulated in Act JUS/206/2009.
|
|
ORIGINAL |
ORIGINAL |
ORIGINAL |
ORIGINAL |
ORIGINAL |
|
|
Assets |
2012 |
2011 |
2010 |
2009 |
2008 |
|
|
A)
NON-CURRENT ASSETS: 11000 |
222.522.000,00 |
308.528.000,00 |
222.875.000,00 |
207.189.079,00 |
217.281.000,00 |
|
|
I. Intangible fixed assets : 11100 |
84.174.000,00 |
128.759.000,00 |
346.000,00 |
207.154,00 |
214.000,00 |
|
|
1. Development: 11110 |
0,00 |
0,00 |
0,00 |
0,00 |
0,00 |
|
|
2. Concessions: 11120 |
0,00 |
0,00 |
0,00 |
0,00 |
0,00 |
|
|
3. Patents, licencing, trade marks and
similar: 11130 |
9.000,00 |
11.000,00 |
14.000,00 |
25.691,00 |
33.000,00 |
|
|
4. Goodwill: 11140 |
83.827.000,00 |
127.963.000,00 |
0,00 |
0,00 |
0,00 |
|
|
5. IT applications: 11150 |
338.000,00 |
785.000,00 |
332.000,00 |
181.463,00 |
181.000,00 |
|
|
6. Investigation: 11160 |
0,00 |
0,00 |
0,00 |
0,00 |
0,00 |
|
|
7. Other intangible fixed assets:
11170 |
0,00 |
0,00 |
0,00 |
0,00 |
0,00 |
|
|
II. Tangible fixed assets : 11200 |
127.984.000,00 |
167.335.000,00 |
21.000,00 |
4.285,00 |
12.000,00 |
|
|
1. Land and buildings: 11210 |
5.000,00 |
14.000,00 |
0,00 |
0,00 |
0,00 |
|
|
2. Technical installations and other
tangible fixed assets: 11220 |
127.976.000,00 |
167.318.000,00 |
21.000,00 |
4.285,00 |
12.000,00 |
|
|
3. Tangible asset in progress and
advances: 11230 |
3.000,00 |
3.000,00 |
0,00 |
0,00 |
0,00 |
|
|
III. Real estate investment: 11300 |
0,00 |
0,00 |
0,00 |
0,00 |
0,00 |
|
|
1. Land: 11310 |
0,00 |
0,00 |
0,00 |
0,00 |
0,00 |
|
|
2. Buildings: 11320 |
0,00 |
0,00 |
0,00 |
0,00 |
0,00 |
|
|
IV. Long-term investments in Group companies and associates :
11400 |
705.000,00 |
115.000,00 |
222.189.000,00 |
203.643.074,00 |
216.031.000,00 |
|
|
1. Equity instruments: 11410 |
705.000,00 |
115.000,00 |
8.167.000,00 |
8.152.286,00 |
20.236.000,00 |
|
|
2. Credits to businesses: 11420 |
0,00 |
0,00 |
214.022.000,00 |
195.490.788,00 |
195.795.000,00 |
|
|
3. Debt securities: 11430 |
0,00 |
0,00 |
0,00 |
0,00 |
0,00 |
|
|
4. Derivatives : 11440 |
0,00 |
0,00 |
0,00 |
0,00 |
0,00 |
|
|
5. Other financial assets : 11450 |
0,00 |
0,00 |
0,00 |
0,00 |
0,00 |
|
|
6. Other investments: 11460 |
0,00 |
0,00 |
0,00 |
0,00 |
0,00 |
|
|
V. Long-term financial investments: 11500 |
2.269.000,00 |
2.592.000,00 |
305.000,00 |
796.365,00 |
906.000,00 |
|
|
1. Equity instruments: 11510 |
0,00 |
0,00 |
0,00 |
0,00 |
0,00 |
|
|
2. Credits to third parties : 11520 |
0,00 |
300.000,00 |
259.000,00 |
785.100,00 |
895.000,00 |
|
|
3. Debt securities: 11530 |
0,00 |
0,00 |
0,00 |
0,00 |
0,00 |
|
|
4. Derivatives : 11540 |
0,00 |
0,00 |
0,00 |
0,00 |
0,00 |
|
|
5. Other financial assets : 11550 |
2.269.000,00 |
2.292.000,00 |
46.000,00 |
11.265,00 |
11.000,00 |
|
|
6. Other investments: 11560 |
0,00 |
0,00 |
0,00 |
0,00 |
0,00 |
|
|
VI. Assets for deferred tax : 11600 |
7.390.000,00 |
9.727.000,00 |
14.000,00 |
2.538.202,00 |
118.000,00 |
|
|
VII. Non-current trade debts : 11700 |
0,00 |
0,00 |
0,00 |
0,00 |
0,00 |
|
|
B)
CURRENT ASSETS: 12000 |
38.899.000,00 |
50.229.000,00 |
1.566.000,00 |
17.304.370,00 |
19.824.000,00 |
|
|
I. Non-current assets held for sale : 12100 |
0,00 |
0,00 |
0,00 |
0,00 |
0,00 |
|
|
II. Stocks: 12200 |
2.361.000,00 |
3.103.000,00 |
0,00 |
1.764,00 |
0,00 |
|
|
1. Commercial: 12210 |
0,00 |
0,00 |
0,00 |
0,00 |
0,00 |
|
|
2. Primary material and other supplies:
12220 |
2.361.000,00 |
3.103.000,00 |
0,00 |
0,00 |
0,00 |
|
|
3. Work in progress: 12230 |
0,00 |
0,00 |
0,00 |
0,00 |
0,00 |
|
|
a) Of long-term
production cycle : 12231 |
0,00 |
0,00 |
0,00 |
0,00 |
0,00 |
|
|
b) Of short-term
production cycle : 12232 |
0,00 |
0,00 |
0,00 |
0,00 |
0,00 |
|
|
4. Finished goods: 12240 |
0,00 |
0,00 |
0,00 |
0,00 |
0,00 |
|
|
a) Of long-term
production cycle : 12241 |
0,00 |
0,00 |
0,00 |
0,00 |
0,00 |
|
|
b) Of short-term production
cycle : 12242 |
0,00 |
0,00 |
0,00 |
0,00 |
0,00 |
|
|
5. By-products, residues and recycled
materials: 12250 |
0,00 |
0,00 |
0,00 |
0,00 |
0,00 |
|
|
6. Advances to suppliers: 12260 |
0,00 |
0,00 |
0,00 |
1.764,00 |
0,00 |
|
|
III. Trade debtors and others receivable accounts: 12300 |
27.680.000,00 |
36.708.000,00 |
882.000,00 |
5.428.553,00 |
6.756.000,00 |
|
|
1. Trade debtors / accounts receivable:
12310 |
27.325.000,00 |
36.234.000,00 |
159.000,00 |
144.275,00 |
0,00 |
|
|
a) Long-term
receivables from sales and services supplied : 12311 |
0,00 |
0,00 |
0,00 |
0,00 |
0,00 |
|
|
b) Customers for sales
and provisions of services : 12312 |
27.325.000,00 |
36.234.000,00 |
159.000,00 |
144.275,00 |
0,00 |
|
|
2. Customers, Group companies and
associates : 12320 |
257.000,00 |
356.000,00 |
703.000,00 |
5.271.613,00 |
6.680.000,00 |
|
|
3. Other accounts receivable: 12330 |
38.000,00 |
63.000,00 |
10.000,00 |
0,00 |
76.000,00 |
|
|
4. Personnel: 12340 |
0,00 |
2.000,00 |
8.000,00 |
12.665,00 |
0,00 |
|
|
5. Assets for deferred tax: 12350 |
0,00 |
0,00 |
0,00 |
0,00 |
0,00 |
|
|
6. Other debtors, including tax and social
security: 12360 |
60.000,00 |
53.000,00 |
2.000,00 |
0,00 |
0,00 |
|
|
7. Called up share capital: 12370 |
0,00 |
0,00 |
0,00 |
0,00 |
0,00 |
|
|
IV. Short-term investments in Group companies and associates:
12400 |
879.000,00 |
847.000,00 |
0,00 |
11.099.451,00 |
44.000,00 |
|
|
1. Equity instruments: 12410 |
0,00 |
0,00 |
0,00 |
0,00 |
0,00 |
|
|
2. Credits to businesses: 12420 |
879.000,00 |
847.000,00 |
0,00 |
0,00 |
0,00 |
|
|
3. Debt securities: 12430 |
0,00 |
0,00 |
0,00 |
0,00 |
0,00 |
|
|
4. Derivatives : 12440 |
0,00 |
0,00 |
0,00 |
0,00 |
0,00 |
|
|
5. Other financial assets : 12450 |
0,00 |
0,00 |
0,00 |
11.099.451,00 |
44.000,00 |
|
|
6. Other investments: 12460 |
0,00 |
0,00 |
0,00 |
0,00 |
0,00 |
|
|
V. Short-term financial investments : 12500 |
2.081.000,00 |
3.876.000,00 |
0,00 |
0,00 |
0,00 |
|
|
1. Equity instruments: 12510 |
13.000,00 |
11.000,00 |
0,00 |
0,00 |
0,00 |
|
|
2. Credits to businesses: 12520 |
0,00 |
0,00 |
0,00 |
0,00 |
0,00 |
|
|
3. Debt securities: 12530 |
0,00 |
0,00 |
0,00 |
0,00 |
0,00 |
|
|
4. Derivatives : 12540 |
0,00 |
0,00 |
0,00 |
0,00 |
0,00 |
|
|
5. Other financial assets : 12550 |
2.068.000,00 |
3.865.000,00 |
0,00 |
0,00 |
0,00 |
|
|
6. Other investments: 12560 |
0,00 |
0,00 |
0,00 |
0,00 |
0,00 |
|
|
VI. Short-term accruals: 12600 |
417.000,00 |
481.000,00 |
31.000,00 |
14.380,00 |
6.000,00 |
|
|
VII. Cash and other equivalent liquid assets : 12700 |
5.481.000,00 |
5.214.000,00 |
653.000,00 |
760.222,00 |
13.018.000,00 |
|
|
1. Treasury: 12710 |
5.481.000,00 |
5.214.000,00 |
653.000,00 |
760.222,00 |
13.018.000,00 |
|
|
2. Other equivalent liquid assets:
12720 |
0,00 |
0,00 |
0,00 |
0,00 |
0,00 |
|
|
TOTAL
ASSETS (A + B) : 10000 |
261.421.000,00 |
358.757.000,00 |
224.441.000,00 |
224.493.449,00 |
237.105.000,00 |
|
|
|
ORIGINAL |
ORIGINAL |
ORIGINAL |
ORIGINAL |
ORIGINAL |
|
|
Liabilities
and Net Worth |
2012 |
2011 |
2010 |
2009 |
2008 |
|
|
A)
NET WORTH: 20000 |
-153.714.000,00 |
-75.372.000,00 |
24.592.000,00 |
-142.002.264,00 |
-104.877.000,00 |
|
|
A-1) Shareholders' equity: 21000 |
-153.714.000,00 |
-75.372.000,00 |
24.592.000,00 |
-142.002.264,00 |
-104.877.000,00 |
|
|
I. Capital: 21100 |
6.936.000,00 |
7.523.000,00 |
7.523.000,00 |
7.522.873,00 |
7.523.000,00 |
|
|
1. Registered capital : 21110 |
6.936.000,00 |
7.523.000,00 |
7.523.000,00 |
7.522.873,00 |
7.523.000,00 |
|
|
2. (Uncalled capital): 21120 |
0,00 |
0,00 |
0,00 |
0,00 |
0,00 |
|
|
II. Share premium: 21200 |
50.868.000,00 |
50.868.000,00 |
50.868.000,00 |
50.867.979,00 |
50.868.000,00 |
|
|
III. Reserves: 21300 |
-42.425.000,00 |
-42.256.000,00 |
-191.000,00 |
0,00 |
0,00 |
|
|
1. Legal y estatutarias: 21310 |
1.505.000,00 |
1.505.000,00 |
0,00 |
0,00 |
0,00 |
|
|
2. Other reserves: 21320 |
-43.930.000,00 |
-43.761.000,00 |
-191.000,00 |
0,00 |
0,00 |
|
|
IV. (Common stock equity): 21400 |
0,00 |
-456.000,00 |
-456.000,00 |
0,00 |
0,00 |
|
|
V. Results from previous periods: 21500 |
-91.051.000,00 |
-35.113.000,00 |
-200.207.000,00 |
-163.263.684,00 |
-40.295.000,00 |
|
|
1. Brought forward: 21510 |
0,00 |
0,00 |
0,00 |
0,00 |
0,00 |
|
|
2. (Negative results from previous
periods): 21520 |
-91.051.000,00 |
-35.113.000,00 |
-200.207.000,00 |
-163.263.684,00 |
-40.295.000,00 |
|
|
VI. Other shareholders' contributions: 21600 |
0,00 |
0,00 |
0,00 |
0,00 |
0,00 |
|
|
VII. Result of the period: 21700 |
-78.042.000,00 |
-55.938.000,00 |
167.055.000,00 |
-37.129.432,00 |
-122.973.000,00 |
|
|
VIII. (Interim dividend): 21800 |
0,00 |
0,00 |
0,00 |
0,00 |
0,00 |
|
|
IX. Other net worth instruments: 21900 |
0,00 |
0,00 |
0,00 |
0,00 |
0,00 |
|
|
A-2) Adjustments due to changes in value: 22000 |
0,00 |
0,00 |
0,00 |
0,00 |
0,00 |
|
|
I. Financial assets held for sale: 22100 |
0,00 |
0,00 |
0,00 |
0,00 |
0,00 |
|
|
II. Hedge operations: 22200 |
0,00 |
0,00 |
0,00 |
0,00 |
0,00 |
|
|
III. Linked non-current assets and liabilities held for sale :
22300 |
0,00 |
0,00 |
0,00 |
0,00 |
0,00 |
|
|
IV. Exchange rate difference: 22400 |
0,00 |
0,00 |
0,00 |
0,00 |
0,00 |
|
|
V. Other: 22500 |
0,00 |
0,00 |
0,00 |
0,00 |
0,00 |
|
|
A-3) Received subsidies, donations and legacies: 23000 |
0,00 |
0,00 |
0,00 |
0,00 |
0,00 |
|
|
B)
NON-CURRENT LIABILITIES: 31000 |
387.718.000,00 |
388.820.000,00 |
193.083.000,00 |
154.501.998,00 |
332.072.000,00 |
|
|
I. Long-term provisions: 31100 |
962.000,00 |
800.000,00 |
0,00 |
0,00 |
0,00 |
|
|
1. Long-term employee benefits liability:
31110 |
0,00 |
0,00 |
0,00 |
0,00 |
0,00 |
|
|
2. Environmental actions: 31120 |
0,00 |
0,00 |
0,00 |
0,00 |
0,00 |
|
|
3. Restructuring provisions: 31130 |
0,00 |
0,00 |
0,00 |
0,00 |
0,00 |
|
|
4. Other provisions: 31140 |
962.000,00 |
800.000,00 |
0,00 |
0,00 |
0,00 |
|
|
II Long-term creditors: 31200 |
386.756.000,00 |
388.020.000,00 |
147.159.000,00 |
154.469.948,00 |
196.245.000,00 |
|
|
1. Liabilities and other securities:
31210 |
0,00 |
0,00 |
0,00 |
0,00 |
0,00 |
|
|
2. Amounts owed to credit institutions:
31220 |
323.172.000,00 |
310.919.000,00 |
143.986.000,00 |
149.528.930,00 |
192.365.000,00 |
|
|
3. Creditors from financial leasing:
31230 |
63.584.000,00 |
75.024.000,00 |
0,00 |
0,00 |
0,00 |
|
|
4. Derivatives : 31240 |
0,00 |
2.077.000,00 |
2.973.000,00 |
4.941.018,00 |
3.880.000,00 |
|
|
5. Other financial liabilities :
31250 |
0,00 |
0,00 |
200.000,00 |
0,00 |
0,00 |
|
|
III. Long-term debts with Group companies and associates:
31300 |
0,00 |
0,00 |
45.924.000,00 |
0,00 |
135.763.000,00 |
|
|
IV. Liabilities for deferred tax: 31400 |
0,00 |
0,00 |
0,00 |
32.050,00 |
64.000,00 |
|
|
V. Long-term accruals: 31500 |
0,00 |
0,00 |
0,00 |
0,00 |
0,00 |
|
|
VI. Non-current trade creditors : 31600 |
0,00 |
0,00 |
0,00 |
0,00 |
0,00 |
|
|
VII. Special long-term debts : 31700 |
0,00 |
0,00 |
0,00 |
0,00 |
0,00 |
|
|
C)
CURRENT LIABILITIES : 32000 |
27.417.000,00 |
45.309.000,00 |
6.766.000,00 |
211.993.715,00 |
9.910.000,00 |
|
|
I. Liabilities linked to non-current assets held for sale:
32100 |
0,00 |
0,00 |
0,00 |
0,00 |
0,00 |
|
|
II. Short-term provisions: 32200 |
0,00 |
0,00 |
0,00 |
0,00 |
0,00 |
|
|
III. Short-term creditors : 32300 |
16.015.000,00 |
29.054.000,00 |
5.357.000,00 |
209.195.430,00 |
5.663.000,00 |
|
|
1. Liabilities and other securities:
32310 |
0,00 |
0,00 |
0,00 |
0,00 |
0,00 |
|
|
2. Amounts owed to credit institutions:
32320 |
7.364.000,00 |
13.673.000,00 |
4.000.000,00 |
208.712.469,00 |
0,00 |
|
|
3. Creditors from financial leasing:
32330 |
8.133.000,00 |
12.963.000,00 |
0,00 |
482.961,00 |
0,00 |
|
|
4. Derivatives : 32340 |
309.000,00 |
1.691.000,00 |
1.157.000,00 |
0,00 |
0,00 |
|
|
5. Other financial liabilities :
32350 |
209.000,00 |
727.000,00 |
200.000,00 |
0,00 |
5.663.000,00 |
|
|
IV. Short-term debts with Group companies and associates:
32400 |
0,00 |
0,00 |
200.000,00 |
0,00 |
478.000,00 |
|
|
V. Trade creditors and other accounts payable: 32500 |
11.402.000,00 |
16.255.000,00 |
1.209.000,00 |
2.798.285,00 |
3.769.000,00 |
|
|
1. Suppliers: 32510 |
9.763.000,00 |
12.235.000,00 |
370.000,00 |
691.161,00 |
1.624.000,00 |
|
|
a) Long-term debts :
32511 |
0,00 |
0,00 |
0,00 |
0,00 |
0,00 |
|
|
b) Short-term debts :
32512 |
9.763.000,00 |
12.235.000,00 |
370.000,00 |
691.161,00 |
1.624.000,00 |
|
|
2. Suppliers, Group companies and
associates: 32520 |
13.000,00 |
0,00 |
77.000,00 |
1.736.872,00 |
1.310.000,00 |
|
|
3. Other creditors: 32530 |
22.000,00 |
41.000,00 |
22.000,00 |
36.097,00 |
0,00 |
|
|
4. Personnel (remuneration due):
32540 |
682.000,00 |
993.000,00 |
130.000,00 |
124.982,00 |
453.000,00 |
|
|
5. Liabilities for current tax:
32550 |
0,00 |
0,00 |
0,00 |
43.441,00 |
0,00 |
|
|
6. Otras deudas con las Administraciones
Públicas. : 32560 |
922.000,00 |
2.986.000,00 |
610.000,00 |
165.732,00 |
382.000,00 |
|
|
7. Advances from clients: 32570 |
0,00 |
0,00 |
0,00 |
0,00 |
0,00 |
|
|
VI. Short-term accruals: 32600 |
0,00 |
0,00 |
0,00 |
0,00 |
0,00 |
|
|
VII. Special short-term debts : 32700 |
0,00 |
0,00 |
0,00 |
0,00 |
0,00 |
|
|
TOTAL
NET WORTH AND LIABILITIES (A + B + C) : 30000 |
261.421.000,00 |
358.757.000,00 |
224.441.000,00 |
224.493.449,00 |
237.105.000,00 |
|
|
|
ORIGINAL |
ORIGINAL |
ORIGINAL |
ORIGINAL |
ORIGINAL |
|
|
Profit
and Loss |
2012 |
2011 |
2010 |
2009 |
2008 |
|
|
1.
Net turnover: 40100 |
53.358.000,00 |
67.433.000,00 |
0,00 |
581.138,00 |
0,00 |
|
|
a) Sales: 40110 |
0,00 |
0,00 |
0,00 |
0,00 |
0,00 |
|
|
b) Rendering of services: 40120 |
53.358.000,00 |
67.433.000,00 |
0,00 |
581.138,00 |
0,00 |
|
|
2.
Changes in stocks of finished goods and work in progress: 40200 |
0,00 |
0,00 |
0,00 |
0,00 |
0,00 |
|
|
3.
Works carried out by the company for its assets: 40300 |
325.000,00 |
0,00 |
0,00 |
0,00 |
0,00 |
|
|
4.
Supplies : 40400 |
-11.628.000,00 |
-13.770.000,00 |
0,00 |
0,00 |
0,00 |
|
|
a) Stock consumption: 40410 |
0,00 |
0,00 |
0,00 |
0,00 |
0,00 |
|
|
b) Consumption of raw materials and miscellaneous consumable
ones: 40420 |
-10.627.000,00 |
-12.917.000,00 |
0,00 |
0,00 |
0,00 |
|
|
c) Works carried out by other companies: 40430 |
-666.000,00 |
-853.000,00 |
0,00 |
0,00 |
0,00 |
|
|
d) Impairment of stock, primary material and other supplies:
40440 |
-335.000,00 |
0,00 |
0,00 |
0,00 |
0,00 |
|
|
5.
Other operating income: 40500 |
18.122.000,00 |
20.556.000,00 |
6.590.000,00 |
5.959.435,00 |
8.596.000,00 |
|
|
a) Auxiliary income and other from current management:
40510 |
18.122.000,00 |
20.556.000,00 |
6.590.000,00 |
5.959.435,00 |
8.596.000,00 |
|
|
b) Operation subsidies included in the Period's
result: 40520 |
0,00 |
0,00 |
0,00 |
0,00 |
0,00 |
|
|
6.
Personnel costs: 40600 |
-24.632.000,00 |
-30.700.000,00 |
-4.758.000,00 |
-2.555.912,00 |
-2.966.000,00 |
|
|
a) Wages, salaries et al.: 40610 |
-18.990.000,00 |
-23.628.000,00 |
-3.886.000,00 |
-2.161.976,00 |
-2.315.000,00 |
|
|
b) Social security costs: 40620 |
-5.047.000,00 |
-6.256.000,00 |
-742.000,00 |
-393.936,00 |
-198.000,00 |
|
|
c) Provisions : 40630 |
-595.000,00 |
-816.000,00 |
-130.000,00 |
0,00 |
-453.000,00 |
|
|
7.
Other operating costs: 40700 |
-27.234.000,00 |
-37.618.000,00 |
-2.300.000,00 |
-3.223.387,00 |
-5.071.000,00 |
|
|
a) External services: 40710 |
-23.261.000,00 |
-31.514.000,00 |
-2.294.000,00 |
-3.218.339,00 |
-5.071.000,00 |
|
|
b) Taxes: 40720 |
-387.000,00 |
-668.000,00 |
-6.000,00 |
-5.048,00 |
0,00 |
|
|
c) Losses, impairments and variation in provisions from trade
operations : 40730 |
-3.586.000,00 |
-5.436.000,00 |
0,00 |
0,00 |
0,00 |
|
|
d) Other current management expenditure : 40740 |
0,00 |
0,00 |
0,00 |
0,00 |
0,00 |
|
|
8.
Amortisation of fixed assets: 40800 |
-24.136.000,00 |
-27.180.000,00 |
-223.000,00 |
-122.846,00 |
-81.000,00 |
|
|
9.
Allocation of subsidies of non-financial fixed assets and other: 40900 |
0,00 |
0,00 |
0,00 |
0,00 |
0,00 |
|
|
10.
Excess provisions : 41000 |
0,00 |
0,00 |
0,00 |
0,00 |
0,00 |
|
|
11.
Impairment and result of transfers of fixed assets: 41100 |
-49.010.000,00 |
-18.354.000,00 |
0,00 |
0,00 |
0,00 |
|
|
a) Impairment and losses : 41110 |
-44.136.000,00 |
-17.992.000,00 |
0,00 |
0,00 |
0,00 |
|
|
b) Results for transfers and other : 41120 |
-4.874.000,00 |
-362.000,00 |
0,00 |
0,00 |
0,00 |
|
|
12.
Negative difference in combined businesses: 41200 |
0,00 |
0,00 |
0,00 |
0,00 |
0,00 |
|
|
13.
Other results : 41300 |
-577.000,00 |
-2.026.000,00 |
323.000,00 |
0,00 |
-2.000,00 |
|
|
A.1)
OPERATING INCOME (1 + 2 + 3 + 4 + 5 + 6 + 7 + 8 + 9 + 10 + 11 + 12 + 13) :
49100 |
-65.412.000,00 |
-41.659.000,00 |
-368.000,00 |
638.428,00 |
476.000,00 |
|
|
14.
Financial income : 41400 |
66.000,00 |
67.000,00 |
7.677.000,00 |
7.525.784,00 |
12.547.000,00 |
|
|
a) Of shares in equity instruments : 41410 |
0,00 |
0,00 |
0,00 |
0,00 |
12.547.000,00 |
|
|
a 1) In Group companies and associates:
41411 |
0,00 |
0,00 |
0,00 |
0,00 |
12.397.000,00 |
|
|
a 2) In third parties: 41412 |
0,00 |
0,00 |
0,00 |
0,00 |
150.000,00 |
|
|
b) From negotiable securities and other financial instruments :
41420 |
0,00 |
67.000,00 |
7.677.000,00 |
7.525.784,00 |
0,00 |
|
|
b 1) From Group companies and associates :
41421 |
0,00 |
0,00 |
7.617.000,00 |
7.493.773,00 |
0,00 |
|
|
b 2) From third parties : 41422 |
0,00 |
67.000,00 |
60.000,00 |
32.011,00 |
0,00 |
|
|
c) Allocation of financial subsidies, donations and legacies :
41430 |
66.000,00 |
0,00 |
0,00 |
0,00 |
0,00 |
|
|
15.
Financial expenditure: 41500 |
-11.028.000,00 |
-13.168.000,00 |
-15.747.000,00 |
-26.896.539,00 |
-30.029.000,00 |
|
|
a) Amounts owed to Group companies and associates : 41510 |
0,00 |
0,00 |
-6.106.000,00 |
-2.378.465,00 |
-12.577.000,00 |
|
|
b) For debts with third parties : 41520 |
-11.028.000,00 |
-13.168.000,00 |
-9.641.000,00 |
-24.518.074,00 |
-17.452.000,00 |
|
|
c) Stock renewal : 41530 |
0,00 |
0,00 |
0,00 |
0,00 |
0,00 |
|
|
16.
Changes in fair value of financial instruments : 41600 |
669.000,00 |
1.554.000,00 |
937.000,00 |
-967.434,00 |
-4.101.000,00 |
|
|
a) Trading book and other : 41610 |
669.000,00 |
1.554.000,00 |
937.000,00 |
-967.434,00 |
-4.101.000,00 |
|
|
b) Allocation of financial assets held for sale to the result
for the period: 41620 |
0,00 |
0,00 |
0,00 |
0,00 |
0,00 |
|
|
17.
Exchange rate differences : 41700 |
0,00 |
0,00 |
0,00 |
0,00 |
0,00 |
|
|
18.
Impairment and result for transfers of financial instruments: 41800 |
0,00 |
0,00 |
222.527.000,00 |
-19.882.000,00 |
-101.839.000,00 |
|
|
a) Impairment and losses : 41810 |
0,00 |
0,00 |
0,00 |
-19.882.000,00 |
0,00 |
|
|
b) Results for transfers and other : 41820 |
0,00 |
0,00 |
222.527.000,00 |
0,00 |
-101.839.000,00 |
|
|
19.
Other financial income and expenditure: 42100 |
0,00 |
0,00 |
0,00 |
0,00 |
0,00 |
|
|
a) Incorporation of financial expenditure to assets:
42110 |
0,00 |
0,00 |
0,00 |
0,00 |
0,00 |
|
|
b) Financial income from arrangement with creditors:
42120 |
0,00 |
0,00 |
0,00 |
0,00 |
0,00 |
|
|
c) Other income and expenditure: 42130 |
0,00 |
0,00 |
0,00 |
0,00 |
0,00 |
|
|
A.2)
FINANCIAL REVENUE (14+15+16+17+18+19) : 49200 |
-10.293.000,00 |
-11.547.000,00 |
215.394.000,00 |
-40.220.189,00 |
-123.422.000,00 |
|
|
A.3)
NET RESULT BEFORE TAXES (A.1+A.2) : 49300 |
-75.705.000,00 |
-53.206.000,00 |
215.026.000,00 |
-39.581.761,00 |
-122.946.000,00 |
|
|
20.
Income taxes: 41900 |
-2.337.000,00 |
-2.732.000,00 |
-47.971.000,00 |
2.452.330,00 |
-27.000,00 |
|
|
A.4)
PROFIT AFTER TAXES (A.3+20) : 49400 |
-78.042.000,00 |
-55.938.000,00 |
167.055.000,00 |
-37.129.432,00 |
-122.973.000,00 |
|
|
21.
Result of the year coming from interrupted operations : 42000 |
0,00 |
0,00 |
0,00 |
0,00 |
0,00 |
|
|
A.5)
RESULT OF THE PERIOD (A.4+21) : 49500 |
-78.042.000,00 |
-55.938.000,00 |
167.055.000,00 |
-37.129.432,00 |
-122.973.000,00 |
|
>
Normal Balance Sheet under the rules of the 1990 General Accounting Plan
(repealed since 1st January of 2008)
Information
corresponding to the fiscal year
2012 2011 2010 2009 2008 has been compiled based on
the equivalence criteria stipulated in Act JUS/206/2009. Where the provisions
of the Act did not establish relevant equivalence criteria.
|
|
EQUIVALENCIA |
EQUIVALENCIA |
EQUIVALENCIA |
EQUIVALENCIA |
EQUIVALENCIA |
|
|
ASSETS |
2012 |
2011 |
2010 |
2009 |
2008 |
|
|
A)
SHAREHOLDERS (PARTNERS) BY UNCALLED SUSCRIBED CAPITAL: |
0,00 |
0,00 |
0,00 |
0,00 |
0,00 |
|
|
B)
FIXED ASSETS: |
215.132.000,00 |
299.257.000,00 |
223.317.000,00 |
204.650.877,00 |
217.163.000,00 |
|
|
I. Formation expenses: |
0,00 |
0,00 |
0,00 |
0,00 |
0,00 |
|
|
II. Intangible fixed assets: |
84.174.000,00 |
128.759.000,00 |
346.000,00 |
207.154,00 |
214.000,00 |
|
|
1. Research and development costs: |
0,00 |
0,00 |
0,00 |
0,00 |
0,00 |
|
|
2. Concessions, patents, licences,
trademarks et al.: |
9.000,00 |
11.000,00 |
14.000,00 |
25.691,00 |
33.000,00 |
|
|
3. Goodwill: |
83.827.000,00 |
127.963.000,00 |
0,00 |
0,00 |
0,00 |
|
|
4. Key money paid for premises: |
0,00 |
0,00 |
0,00 |
0,00 |
0,00 |
|
|
5. Software: |
338.000,00 |
785.000,00 |
332.000,00 |
181.463,00 |
181.000,00 |
|
|
6. Assets under capital leases: |
0,00 |
0,00 |
0,00 |
0,00 |
0,00 |
|
|
7. Payments on account: |
0,00 |
0,00 |
0,00 |
0,00 |
0,00 |
|
|
8. Provisions: |
0,00 |
0,00 |
0,00 |
0,00 |
0,00 |
|
|
9. Accumulated depreciation: |
0,00 |
0,00 |
0,00 |
0,00 |
0,00 |
|
|
III. Tangible fixed assets: |
127.984.000,00 |
167.335.000,00 |
21.000,00 |
4.285,00 |
12.000,00 |
|
|
1. Land and construction: |
5.000,00 |
14.000,00 |
0,00 |
0,00 |
0,00 |
|
|
2. Technical installations and machinery:
|
127.976.000,00 |
167.318.000,00 |
21.000,00 |
4.285,00 |
12.000,00 |
|
|
3. Other installations, tools and
furniture: |
0,00 |
0,00 |
0,00 |
0,00 |
0,00 |
|
|
4. Payments on account and tangible fixed
assets under construction: |
3.000,00 |
3.000,00 |
0,00 |
0,00 |
0,00 |
|
|
5. Other tangible assets: |
0,00 |
0,00 |
0,00 |
0,00 |
0,00 |
|
|
6. Provisions: |
0,00 |
0,00 |
0,00 |
0,00 |
0,00 |
|
|
7. Accumulated depreciation: |
0,00 |
0,00 |
0,00 |
0,00 |
0,00 |
|
|
IV. Financial investments: |
2.974.000,00 |
2.707.000,00 |
222.494.000,00 |
204.439.438,00 |
216.937.000,00 |
|
|
1. Equity investments in group companies:
|
705.000,00 |
115.000,00 |
8.167.000,00 |
8.152.286,00 |
20.236.000,00 |
|
|
2. Receivables from group companies:
|
0,00 |
0,00 |
214.022.000,00 |
195.490.788,00 |
195.795.000,00 |
|
|
3. Equity investment in associated
companies: |
0,00 |
0,00 |
0,00 |
0,00 |
0,00 |
|
|
4. Credits to associated companies: |
0,00 |
0,00 |
0,00 |
0,00 |
0,00 |
|
|
5. Long-term securities portfolio: |
0,00 |
0,00 |
0,00 |
0,00 |
0,00 |
|
|
6. Other receivables: |
0,00 |
300.000,00 |
259.000,00 |
785.100,00 |
895.000,00 |
|
|
7. Long term guarantees and deposits:
|
2.269.000,00 |
2.292.000,00 |
46.000,00 |
11.265,00 |
11.000,00 |
|
|
8. Provisions: |
0,00 |
0,00 |
0,00 |
0,00 |
0,00 |
|
|
9. Long-term receivables from public
bodies: |
0,00 |
0,00 |
0,00 |
0,00 |
0,00 |
|
|
V. Own shares: |
0,00 |
456.000,00 |
456.000,00 |
0,00 |
0,00 |
|
|
VI. Long-term trade receivables: |
0,00 |
0,00 |
0,00 |
0,00 |
0,00 |
|
|
C)
Deferred expenses: |
0,00 |
0,00 |
0,00 |
0,00 |
0,00 |
|
|
D)
CURRENT ASSETS: |
46.289.000,00 |
59.956.000,00 |
1.580.000,00 |
19.842.572,00 |
19.942.000,00 |
|
|
I. Called-up share capital (not paid): |
0,00 |
0,00 |
0,00 |
0,00 |
0,00 |
|
|
II. Stocks: |
2.361.000,00 |
3.103.000,00 |
0,00 |
1.764,00 |
0,00 |
|
|
1. Goods for resale: |
0,00 |
0,00 |
0,00 |
0,00 |
0,00 |
|
|
2. Raw materials and other consumables:
|
2.361.000,00 |
3.103.000,00 |
0,00 |
0,00 |
0,00 |
|
|
3. Goods in process and semifinished ones:
|
0,00 |
0,00 |
0,00 |
0,00 |
0,00 |
|
|
4. Finished products: |
0,00 |
0,00 |
0,00 |
0,00 |
0,00 |
|
|
5. Byproducts, scrap and recovered
materials: |
0,00 |
0,00 |
0,00 |
0,00 |
0,00 |
|
|
6. Payments on account: |
0,00 |
0,00 |
0,00 |
1.764,00 |
0,00 |
|
|
7. Provisions: |
0,00 |
0,00 |
0,00 |
0,00 |
0,00 |
|
|
III. Debtors: |
35.070.000,00 |
46.435.000,00 |
896.000,00 |
7.966.754,00 |
6.874.000,00 |
|
|
1. Trade debtors / accounts receivable:
|
27.325.000,00 |
36.234.000,00 |
159.000,00 |
144.275,00 |
0,00 |
|
|
2. Accounts receivable, Group companies:
|
257.000,00 |
356.000,00 |
703.000,00 |
5.271.613,00 |
6.680.000,00 |
|
|
3. Accounts receivable, associated
companies: |
0,00 |
0,00 |
0,00 |
0,00 |
0,00 |
|
|
4. Other debtors: |
38.000,00 |
63.000,00 |
10.000,00 |
0,00 |
76.000,00 |
|
|
5. Staff: |
0,00 |
2.000,00 |
8.000,00 |
12.665,00 |
0,00 |
|
|
6. Public bodies: |
7.450.000,00 |
9.780.000,00 |
16.000,00 |
2.538.202,00 |
118.000,00 |
|
|
7. Provisions: |
0,00 |
0,00 |
0,00 |
0,00 |
0,00 |
|
|
IV. Short-term investments: |
2.960.000,00 |
4.723.000,00 |
0,00 |
11.099.451,00 |
44.000,00 |
|
|
1. Equity investments in group companies:
|
0,00 |
0,00 |
0,00 |
0,00 |
0,00 |
|
|
2. Receivables from group companies:
|
879.000,00 |
847.000,00 |
0,00 |
0,00 |
0,00 |
|
|
3. Equity investment in associated
companies: |
0,00 |
0,00 |
0,00 |
0,00 |
0,00 |
|
|
4. Credits to associated companies: |
0,00 |
0,00 |
0,00 |
0,00 |
0,00 |
|
|
5. Short term securities portfolio: |
13.000,00 |
11.000,00 |
0,00 |
0,00 |
0,00 |
|
|
6. Other receivables: |
0,00 |
0,00 |
0,00 |
11.099.451,00 |
44.000,00 |
|
|
7. Shor term guarantees and deposits:
|
2.068.000,00 |
3.865.000,00 |
0,00 |
0,00 |
0,00 |
|
|
8. Provisions: |
0,00 |
0,00 |
0,00 |
0,00 |
0,00 |
|
|
V. Short-term treasury shares: |
0,00 |
0,00 |
0,00 |
0,00 |
0,00 |
|
|
VI. Cash at bank and in hand: |
5.481.000,00 |
5.214.000,00 |
653.000,00 |
760.222,00 |
13.018.000,00 |
|
|
VII. Prepayments and accrued income: |
417.000,00 |
481.000,00 |
31.000,00 |
14.380,00 |
6.000,00 |
|
|
GENERAL
TOTAL (A + B + C + D): |
261.421.000,00 |
359.213.000,00 |
224.897.000,00 |
224.493.449,00 |
237.105.000,00 |
|
MERCANTILE
REGISTRY.
|
|
EQUIVALENCIA |
EQUIVALENCIA |
EQUIVALENCIA |
EQUIVALENCIA |
EQUIVALENCIA |
|
|
LIABILITIES |
2012 |
2011 |
2010 |
2009 |
2008 |
|
|
A)
EQUITY: |
-153.405.000,00 |
-71.148.000,00 |
29.178.000,00 |
-137.061.246,00 |
-100.997.000,00 |
|
|
I. Subscribed capital: |
6.936.000,00 |
7.523.000,00 |
7.523.000,00 |
7.522.873,00 |
7.523.000,00 |
|
|
II. Share premium: |
50.868.000,00 |
50.868.000,00 |
50.868.000,00 |
50.867.979,00 |
50.868.000,00 |
|
|
III. Revaluation reserves: |
0,00 |
0,00 |
0,00 |
0,00 |
0,00 |
|
|
IV. Reserves: |
-42.116.000,00 |
-38.488.000,00 |
3.939.000,00 |
4.941.018,00 |
3.880.000,00 |
|
|
1. Legal reserve: |
1.505.000,00 |
1.505.000,00 |
0,00 |
0,00 |
0,00 |
|
|
2. Reserves for own shares: |
0,00 |
0,00 |
0,00 |
0,00 |
0,00 |
|
|
3. Reserves for shares of the controlling
company: |
0,00 |
0,00 |
0,00 |
0,00 |
0,00 |
|
|
4. Statutory reserves: |
0,00 |
0,00 |
0,00 |
0,00 |
0,00 |
|
|
5. Miscellaneous reserves: |
-43.621.000,00 |
-39.993.000,00 |
3.939.000,00 |
4.941.018,00 |
3.880.000,00 |
|
|
Differences due to capital adjustement to
euros: |
0,00 |
0,00 |
0,00 |
0,00 |
0,00 |
|
|
V. Profit or loss brought forward: |
-91.051.000,00 |
-35.113.000,00 |
-200.207.000,00 |
-163.263.684,00 |
-40.295.000,00 |
|
|
1. Retained earnings: |
0,00 |
0,00 |
0,00 |
0,00 |
0,00 |
|
|
2. Prior year losses: |
-91.051.000,00 |
-35.113.000,00 |
-200.207.000,00 |
-163.263.684,00 |
-40.295.000,00 |
|
|
3. Partners' contributions so as to
compensate losses: |
0,00 |
0,00 |
0,00 |
0,00 |
0,00 |
|
|
VI. Profit or loss for the financial year: |
-78.042.000,00 |
-55.938.000,00 |
167.055.000,00 |
-37.129.432,00 |
-122.973.000,00 |
|
|
VII. Interim dividend paid: |
0,00 |
0,00 |
0,00 |
0,00 |
0,00 |
|
|
VIII. Own shares for capital reduction: |
0,00 |
0,00 |
0,00 |
0,00 |
0,00 |
|
|
B)
Deferred income: |
0,00 |
0,00 |
0,00 |
0,00 |
0,00 |
|
|
1. Capital grants: |
0,00 |
0,00 |
0,00 |
0,00 |
0,00 |
|
|
2. Unrealised exchange gains: |
0,00 |
0,00 |
0,00 |
0,00 |
0,00 |
|
|
3. Other deferred income: |
0,00 |
0,00 |
0,00 |
0,00 |
0,00 |
|
|
4. Public revenues to distribute in
several financial years: |
0,00 |
0,00 |
0,00 |
0,00 |
0,00 |
|
|
C)
PROVISIONS FOR LIABILITIES AND CHARGES: |
962.000,00 |
800.000,00 |
0,00 |
0,00 |
0,00 |
|
|
1. Provisions for pension fund and other
similar obligations: |
0,00 |
0,00 |
0,00 |
0,00 |
0,00 |
|
|
2. Provisions for taxes: |
0,00 |
0,00 |
0,00 |
0,00 |
0,00 |
|
|
3. Other provisions: |
962.000,00 |
800.000,00 |
0,00 |
0,00 |
0,00 |
|
|
4. Reversion fund: |
0,00 |
0,00 |
0,00 |
0,00 |
0,00 |
|
|
D)
LONG TERM LIABILITIES: |
386.756.000,00 |
385.943.000,00 |
190.110.000,00 |
149.560.980,00 |
328.192.000,00 |
|
|
I. Issued debentures and other marketable securities: |
0,00 |
0,00 |
0,00 |
0,00 |
0,00 |
|
|
1. Non-convertible debentures: |
0,00 |
0,00 |
0,00 |
0,00 |
0,00 |
|
|
2. Convertible debentures: |
0,00 |
0,00 |
0,00 |
0,00 |
0,00 |
|
|
3. Other debt securities: |
0,00 |
0,00 |
0,00 |
0,00 |
0,00 |
|
|
II. Amounts owed to credit institutions: |
386.756.000,00 |
385.943.000,00 |
143.986.000,00 |
149.528.930,00 |
192.365.000,00 |
|
|
1. Loans and other liabilities: |
323.172.000,00 |
310.919.000,00 |
143.986.000,00 |
149.528.930,00 |
192.365.000,00 |
|
|
2. Long-term liabilities from capital
leases: |
63.584.000,00 |
75.024.000,00 |
0,00 |
0,00 |
0,00 |
|
|
III. Debts with companies of the group and affiliated ones:
|
0,00 |
0,00 |
45.924.000,00 |
0,00 |
135.763.000,00 |
|
|
1. Amounts owed to group companies: |
0,00 |
0,00 |
45.924.000,00 |
0,00 |
135.763.000,00 |
|
|
2. Amounts owed to associated companies:
|
0,00 |
0,00 |
0,00 |
0,00 |
0,00 |
|
|
IV. Other creditors: |
0,00 |
0,00 |
200.000,00 |
32.050,00 |
64.000,00 |
|
|
1. Long-term bills of exchange payable:
|
0,00 |
0,00 |
0,00 |
0,00 |
0,00 |
|
|
2. Other creditors: |
0,00 |
0,00 |
200.000,00 |
0,00 |
0,00 |
|
|
3. Long term guarantees and deposits
received: |
0,00 |
0,00 |
0,00 |
0,00 |
0,00 |
|
|
4. Long term payables to public bodies:
|
0,00 |
0,00 |
0,00 |
32.050,00 |
64.000,00 |
|
|
V. Unpaid portion of equity investment: |
0,00 |
0,00 |
0,00 |
0,00 |
0,00 |
|
|
1. Group companies: |
0,00 |
0,00 |
0,00 |
0,00 |
0,00 |
|
|
2. Associated companies: |
0,00 |
0,00 |
0,00 |
0,00 |
0,00 |
|
|
3. Third parties: |
0,00 |
0,00 |
0,00 |
0,00 |
0,00 |
|
|
VI. Long term trade creditors: |
0,00 |
0,00 |
0,00 |
0,00 |
0,00 |
|
|
E)
SHORT TERM CREDITORS: |
27.108.000,00 |
43.618.000,00 |
5.609.000,00 |
211.993.715,00 |
9.910.000,00 |
|
|
I. Issued debentures and other marketable securities: |
0,00 |
0,00 |
0,00 |
0,00 |
0,00 |
|
|
1. Non-convertible debentures: |
0,00 |
0,00 |
0,00 |
0,00 |
0,00 |
|
|
2. Convertible debentures: |
0,00 |
0,00 |
0,00 |
0,00 |
0,00 |
|
|
3. Other debt securities: |
0,00 |
0,00 |
0,00 |
0,00 |
0,00 |
|
|
4. Accrued interest on debentures and
other debt securities: |
0,00 |
0,00 |
0,00 |
0,00 |
0,00 |
|
|
II. Amounts owed to credit institutions: |
15.497.000,00 |
26.636.000,00 |
4.000.000,00 |
209.195.430,00 |
0,00 |
|
|
1. Loans and other liabilities: |
7.364.000,00 |
13.673.000,00 |
4.000.000,00 |
208.712.469,00 |
0,00 |
|
|
2. Accrued interest on liabilities with
credit institutions: |
0,00 |
0,00 |
0,00 |
0,00 |
0,00 |
|
|
3. Short-term liabilities from capital
leases: |
8.133.000,00 |
12.963.000,00 |
0,00 |
482.961,00 |
0,00 |
|
|
III. Short-term amounts owed to group and associated companies:
|
13.000,00 |
0,00 |
277.000,00 |
1.736.872,00 |
1.788.000,00 |
|
|
1. Amounts owed to group companies: |
13.000,00 |
0,00 |
277.000,00 |
1.736.872,00 |
1.788.000,00 |
|
|
2. Amounts owed to associated companies:
|
0,00 |
0,00 |
0,00 |
0,00 |
0,00 |
|
|
IV. Trade creditors: |
9.785.000,00 |
12.276.000,00 |
392.000,00 |
727.259,00 |
1.624.000,00 |
|
|
1. Advanced payments from customers:
|
0,00 |
0,00 |
0,00 |
0,00 |
0,00 |
|
|
2. Amounts owed for purchases of goods or
services: |
9.785.000,00 |
12.276.000,00 |
392.000,00 |
727.259,00 |
1.624.000,00 |
|
|
3. Debts represented by notes payable:
|
0,00 |
0,00 |
0,00 |
0,00 |
0,00 |
|
|
V. Other creditors: |
1.813.000,00 |
4.706.000,00 |
940.000,00 |
334.154,00 |
6.498.000,00 |
|
|
1. Public bodies: |
922.000,00 |
2.986.000,00 |
610.000,00 |
209.173,00 |
382.000,00 |
|
|
2. Bills of exchange payable: |
0,00 |
0,00 |
0,00 |
0,00 |
0,00 |
|
|
3. Miscellaneous debts: |
209.000,00 |
727.000,00 |
200.000,00 |
0,00 |
5.663.000,00 |
|
|
4. Wages and salaries payable: |
682.000,00 |
993.000,00 |
130.000,00 |
124.982,00 |
453.000,00 |
|
|
5. Guarantees and deposits received at
short term: |
0,00 |
0,00 |
0,00 |
0,00 |
0,00 |
|
|
VI. Provisions: |
0,00 |
0,00 |
0,00 |
0,00 |
0,00 |
|
|
VII. Prepayments and accrued income: |
0,00 |
0,00 |
0,00 |
0,00 |
0,00 |
|
|
F)
SHORT-TERM PROVISIONS FOR LIABILITIES AND CHARGES: |
0,00 |
0,00 |
0,00 |
0,00 |
0,00 |
|
|
GENERAL
TOTAL (A + B + C + D + E + F): |
261.421.000,00 |
359.213.000,00 |
224.897.000,00 |
224.493.449,00 |
237.105.000,00 |
|
MERCANTILE
REGISTRY.
|
|
EQUIVALENCIA |
EQUIVALENCIA |
EQUIVALENCIA |
EQUIVALENCIA |
EQUIVALENCIA |
|
|
DEBIT |
2012 |
2011 |
2010 |
2009 |
2008 |
|
|
A)
CHARGES (A.1 to A.15): |
150.582.000,00 |
145.548.000,00 |
70.999.000,00 |
51.195.789,00 |
144.116.000,00 |
|
|
A.1. Stock reduction of both manufactured
goods and the ones in process: |
0,00 |
0,00 |
0,00 |
0,00 |
0,00 |
|
|
A.2. Supplies: |
11.293.000,00 |
13.770.000,00 |
0,00 |
0,00 |
0,00 |
|
|
a) Stock consumption:
|
0,00 |
0,00 |
0,00 |
0,00 |
0,00 |
|
|
b) Consumption of raw
materials and miscellaneous consumable ones: |
10.627.000,00 |
12.917.000,00 |
0,00 |
0,00 |
0,00 |
|
|
c) Miscellaneous
external expenditure: |
666.000,00 |
853.000,00 |
0,00 |
0,00 |
0,00 |
|
|
A.3. Staff costs: |
24.632.000,00 |
30.700.000,00 |
4.758.000,00 |
2.555.912,00 |
2.966.000,00 |
|
|
a) Wages, salaries et
al.: |
19.585.000,00 |
24.444.000,00 |
4.016.000,00 |
2.161.976,00 |
2.768.000,00 |
|
|
b) Social security
costs: |
5.047.000,00 |
6.256.000,00 |
742.000,00 |
393.936,00 |
198.000,00 |
|
|
A.4. Depreciation expense: |
24.136.000,00 |
27.180.000,00 |
223.000,00 |
122.846,00 |
81.000,00 |
|
|
A.5. Variation of trade provisions and
losses of unrecovered receivables: |
3.921.000,00 |
5.436.000,00 |
0,00 |
0,00 |
0,00 |
|
|
a) Stock provision
variation: |
335.000,00 |
0,00 |
0,00 |
0,00 |
0,00 |
|
|
b) Variation in
provision and bad debt losses: |
0,00 |
0,00 |
0,00 |
0,00 |
0,00 |
|
|
c) Variation of other
trade provisions: |
3.586.000,00 |
5.436.000,00 |
0,00 |
0,00 |
0,00 |
|
|
A.6. Other operating charges: |
23.648.000,00 |
32.182.000,00 |
2.300.000,00 |
3.223.387,00 |
5.071.000,00 |
|
|
a) External services:
|
23.261.000,00 |
31.514.000,00 |
2.294.000,00 |
3.218.339,00 |
5.071.000,00 |
|
|
b) Taxes: |
387.000,00 |
668.000,00 |
6.000,00 |
5.048,00 |
0,00 |
|
|
c) Other operating
expenses: |
0,00 |
0,00 |
0,00 |
0,00 |
0,00 |
|
|
d) Allocation to
revision fund: |
0,00 |
0,00 |
0,00 |
0,00 |
0,00 |
|
|
A.I. OPERATING BENEFITS
(B.1+B.2+B.3+B.4-A.1-A.2-A.3-A.4-A.5-A.6): |
0,00 |
0,00 |
0,00 |
638.428,00 |
478.000,00 |
|
|
A.7. Financial and similar charges: |
11.028.000,00 |
13.168.000,00 |
15.747.000,00 |
46.008.895,00 |
131.868.000,00 |
|
|
a) Due to liabilities
with companies of the group: |
0,00 |
0,00 |
0,00 |
0,00 |
0,00 |
|
|
b) Due to liabilities
with associated companies: |
0,00 |
0,00 |
6.106.000,00 |
2.378.465,00 |
12.577.000,00 |
|
|
c) Due to other
debts.: |
11.028.000,00 |
13.168.000,00 |
9.641.000,00 |
24.518.074,00 |
17.452.000,00 |
|
|
d) Losses from
financial investments: |
0,00 |
0,00 |
0,00 |
19.112.356,00 |
101.839.000,00 |
|
|
A.8. Changes in financial investment provisions:
|
0,00 |
0,00 |
0,00 |
1.737.078,00 |
4.101.000,00 |
|
|
A.9. Exchange losses: |
0,00 |
0,00 |
0,00 |
0,00 |
0,00 |
|
|
A.II. NET FINANCIAL INCOME (B.5+B.6+B.7+B.8-A.7-A.8-A.9):
|
0,00 |
0,00 |
215.394.000,00 |
0,00 |
0,00 |
|
|
A.III. PROFIT FROM ORDINARY ACTIVITIES (A.I+A.II-B.I-B.II):
|
0,00 |
0,00 |
214.703.000,00 |
0,00 |
0,00 |
|
|
A.10. Changes in provisions for
intangible, tangible and securities portfolio: |
44.136.000,00 |
17.992.000,00 |
0,00 |
0,00 |
0,00 |
|
|
A.11. Losses from tangible and intangible
fixed assets and securities portfolio: |
4.874.000,00 |
362.000,00 |
0,00 |
0,00 |
0,00 |
|
|
A.12. Losses from transactions with own
shares and debentures: |
0,00 |
0,00 |
0,00 |
0,00 |
0,00 |
|
|
A.13. Extraordinary expenses: |
577.000,00 |
2.026.000,00 |
0,00 |
0,00 |
2.000,00 |
|
|
A.14. Expenses and losses of former
financial years: |
0,00 |
0,00 |
0,00 |
0,00 |
0,00 |
|
|
A.IV. EXTRAORDINARY PROFIT
(B.9+B.10+B.11+B.12+B.13-A.10-A.11-A.12-A.13-A.14): |
0,00 |
0,00 |
323.000,00 |
0,00 |
0,00 |
|
|
A.V. PROFIT BEFORE TAXES (A.III+A.IV-B.III-B.IV): |
0,00 |
0,00 |
215.026.000,00 |
0,00 |
0,00 |
|
|
A.15. Corporation tax: |
2.337.000,00 |
2.732.000,00 |
47.971.000,00 |
-2.452.330,00 |
27.000,00 |
|
|
A.16. Miscellaneous taxes: |
0,00 |
0,00 |
0,00 |
0,00 |
0,00 |
|
|
A.VI. FINANCIAL YEAR RESULTS (PROFIT) (A.V-A.15-A.16): |
0,00 |
0,00 |
167.055.000,00 |
0,00 |
0,00 |
|
MERCANTILE
REGISTRY.
|
|
EQUIVALENCIA |
EQUIVALENCIA |
EQUIVALENCIA |
EQUIVALENCIA |
EQUIVALENCIA |
|
|
CREDIT |
2012 |
2011 |
2010 |
2009 |
2008 |
|
|
B)
INCOME ( B.1 to B.13): |
72.540.000,00 |
89.610.000,00 |
238.054.000,00 |
14.066.357,00 |
21.143.000,00 |
|
|
B.1. Net total sales: |
53.358.000,00 |
67.433.000,00 |
0,00 |
581.138,00 |
0,00 |
|
|
a) Sales: |
0,00 |
0,00 |
0,00 |
0,00 |
0,00 |
|
|
b) Rendering of
services: |
53.358.000,00 |
67.433.000,00 |
0,00 |
581.138,00 |
0,00 |
|
|
Returns and Rappel on
sales: |
0,00 |
0,00 |
0,00 |
0,00 |
0,00 |
|
|
B.2. Stock increase of manufactured goods
and products in process: |
0,00 |
0,00 |
0,00 |
0,00 |
0,00 |
|
|
B.3. Works performed by the company for
fixed assets: |
325.000,00 |
0,00 |
0,00 |
0,00 |
0,00 |
|
|
B.4. Miscellaneous operating income:
|
18.122.000,00 |
20.556.000,00 |
6.590.000,00 |
5.959.435,00 |
8.596.000,00 |
|
|
a) Auxiliary income
and other from current management: |
18.122.000,00 |
20.556.000,00 |
6.590.000,00 |
5.959.435,00 |
8.596.000,00 |
|
|
b) Grants: |
0,00 |
0,00 |
0,00 |
0,00 |
0,00 |
|
|
c) Liabilities and
charges provisions surplus: |
0,00 |
0,00 |
0,00 |
0,00 |
0,00 |
|
|
B.I. PÉRDIDAS DE EXPLOTACIÓN
(A.1+A.2+A.3+A.4+A.5-A.6-B.1-B.2-B.3-B.4): |
15.825.000,00 |
21.279.000,00 |
691.000,00 |
0,00 |
0,00 |
|
|
B.5. Income from equity investment: |
0,00 |
0,00 |
0,00 |
0,00 |
12.547.000,00 |
|
|
a) In companies of
the group: |
0,00 |
0,00 |
0,00 |
0,00 |
12.397.000,00 |
|
|
b) In associated
companies: |
0,00 |
0,00 |
0,00 |
0,00 |
0,00 |
|
|
c) Third parties:
|
0,00 |
0,00 |
0,00 |
0,00 |
150.000,00 |
|
|
B.6. Income from other marketable securities
and long-term receivables: |
0,00 |
0,00 |
0,00 |
0,00 |
0,00 |
|
|
a) From companies of
the group: |
0,00 |
0,00 |
0,00 |
0,00 |
0,00 |
|
|
b) From associated
companies: |
0,00 |
0,00 |
0,00 |
0,00 |
0,00 |
|
|
c) From companies out
of the group: |
0,00 |
0,00 |
0,00 |
0,00 |
0,00 |
|
|
B.7. Miscellaneous interests or similar
income: |
669.000,00 |
1.621.000,00 |
231.141.000,00 |
7.525.784,00 |
0,00 |
|
|
a) From companies of
the group: |
0,00 |
0,00 |
7.617.000,00 |
7.493.773,00 |
0,00 |
|
|
b) From associated
companies: |
0,00 |
0,00 |
0,00 |
0,00 |
0,00 |
|
|
c) Miscellaneous
interests: |
0,00 |
67.000,00 |
60.000,00 |
32.011,00 |
0,00 |
|
|
d) Profit on
financial investment: |
669.000,00 |
1.554.000,00 |
223.464.000,00 |
0,00 |
0,00 |
|
|
B.8. Exchange positive differences: |
0,00 |
0,00 |
0,00 |
0,00 |
0,00 |
|
|
B.II. NEGATIVE FINANCIAL RESULTS (A.7+A.8+A.9-B.5-B.6-B.7-B.8):
|
10.359.000,00 |
11.547.000,00 |
0,00 |
40.220.189,00 |
123.422.000,00 |
|
|
B.III. LOSSES ON ORDINARY ACTIVITIES ( B.I + B.II - A.I - A.II
): |
26.184.000,00 |
32.826.000,00 |
0,00 |
39.581.761,00 |
122.944.000,00 |
|
|
B.9.Profit on disposal of both tangible and
intangible fixed assets and securities portfolio: |
0,00 |
0,00 |
0,00 |
0,00 |
0,00 |
|
|
B.10. Profit on transactions with own
shares and debentures: |
0,00 |
0,00 |
0,00 |
0,00 |
0,00 |
|
|
B.11. Capital grants transferred to profit
and loss: |
66.000,00 |
0,00 |
0,00 |
0,00 |
0,00 |
|
|
B.12. Extraordinary income: |
0,00 |
0,00 |
323.000,00 |
0,00 |
0,00 |
|
|
B.13. Income and profit of former financial
years: |
0,00 |
0,00 |
0,00 |
0,00 |
0,00 |
|
|
B.IV. NEGATIVE EXTRAORDINARY RESULTS
(A.10+A.11+A.12+A.13+A.14-B.9-B.10-B.11-B.12-B.13): |
49.521.000,00 |
20.380.000,00 |
0,00 |
0,00 |
2.000,00 |
|
|
B.V. LOSSES BEFORE TAXES (B.III+B.IV-A.III-A.IV): |
75.705.000,00 |
53.206.000,00 |
0,00 |
39.581.761,00 |
122.946.000,00 |
|
|
B.VI. RESULT OF THE PERIOD (LOSSES) (B.V+A.15+A.16): |
78.042.000,00 |
55.938.000,00 |
0,00 |
37.129.432,00 |
122.973.000,00 |
|
MERCANTILE
REGISTRY.
cASHFLOW STATEMENT
Model: Normal
>
Source of information: Data contained in this section is taken from the information
declared in the Annual Accounts submitted to the Trade Register.
|
|
2012 |
2011 |
2010 |
2009 |
2008 |
|
|
1.
Fiscal year result before taxes.: 61100 |
-75.705.000,00 |
-53.206.000,00 |
215.026.000,00 |
-39.581.761,00 |
-122.946.000,00 |
|
|
2.
Results adjustments.: 61200 |
87.602.000,00 |
59.886.000,00 |
-215.041.000,00 |
0,00 |
123.956.000,00 |
|
|
a) Fixed Assets Amortization (+).: 61201 |
24.136.000,00 |
27.180.000,00 |
223.000,00 |
0,00 |
81.000,00 |
|
|
b) Obsolescence Allowances (+/-). : 61202 |
44.136.000,00 |
17.992.000,00 |
0,00 |
0,00 |
105.940.000,00 |
|
|
c) Variation in Provision (+/-). : 61203 |
3.921.000,00 |
686.000,00 |
-223.464.000,00 |
0,00 |
453.000,00 |
|
|
d) Allocation of grants (-).: 61204 |
0,00 |
0,00 |
130.000,00 |
0,00 |
0,00 |
|
|
e) Results on disposal of fixed assets (+/-). : 61205 |
4.874.000,00 |
362.000,00 |
0,00 |
0,00 |
0,00 |
|
|
g) Financial income (-).: 61207 |
-66.000,00 |
-67.000,00 |
-7.677.000,00 |
0,00 |
-12.547.000,00 |
|
|
h) Financial Expenses (+). : 61208 |
11.028.000,00 |
13.168.000,00 |
15.747.000,00 |
0,00 |
30.029.000,00 |
|
|
j) Reasonable Value Variation in Financial Instruments (+/-).:
61210 |
-669.000,00 |
-1.554.000,00 |
0,00 |
0,00 |
0,00 |
|
|
k) Other income and expense (-/+). : 61211 |
242.000,00 |
2.119.000,00 |
0,00 |
0,00 |
0,00 |
|
|
3.
Changes in current capital equity.: 61300 |
1.705.000,00 |
8.132.000,00 |
2.860.000,00 |
-2.688.002,00 |
1.791.000,00 |
|
|
a) Stock (+/-).: 61301 |
407.000,00 |
1.471.000,00 |
0,00 |
-1.764,00 |
0,00 |
|
|
d) Debtors and other accounts receivable (+/-). : 61302 |
5.442.000,00 |
13.453.000,00 |
4.589.000,00 |
-5.374.467,00 |
-1.565.000,00 |
|
|
c) Other current assets (+/-). : 61303 |
1.227.000,00 |
1.027.000,00 |
0,00 |
-14.380,00 |
5.668.000,00 |
|
|
d) Creditors and other accounts payable (+/-). : 61304 |
-5.371.000,00 |
-7.819.000,00 |
-1.729.000,00 |
2.702.609,00 |
-2.312.000,00 |
|
|
4.
Other cash flows for operating activities.: 61400 |
-7.507.000,00 |
-6.411.000,00 |
34.000,00 |
0,00 |
-7.694.000,00 |
|
|
a) Interest payments (-). : 61401 |
-7.573.000,00 |
-6.478.000,00 |
-26.000,00 |
0,00 |
-7.957.000,00 |
|
|
c) Interest collection (+). : 61403 |
66.000,00 |
67.000,00 |
60.000,00 |
0,00 |
263.000,00 |
|
|
5.
Operating activity cash flows (1 + 2 + 3 + 4) : 61500 |
6.095.000,00 |
8.401.000,00 |
2.879.000,00 |
-42.269.764,00 |
-4.893.000,00 |
|
|
6.
Payments for investment (-).: 62100 |
-567.000,00 |
-2.050.000,00 |
-2.171.000,00 |
-215.750.328,00 |
-9.125.000,00 |
|
|
a) Companies of the group and affiliates. : 62101 |
0,00 |
0,00 |
0,00 |
-214.742.525,00 |
0,00 |
|
|
b) Intangible fixed assets. : 62102 |
-1.000,00 |
-161.000,00 |
-352.000,00 |
-207.154,00 |
-213.000,00 |
|
|
c) Fixed assets. : 62103 |
-566.000,00 |
-1.789.000,00 |
-27.000,00 |
-4.285,00 |
-12.000,00 |
|
|
e) Other financial assets. : 62105 |
0,00 |
-100.000,00 |
-1.336.000,00 |
-796.365,00 |
-8.900.000,00 |
|
|
h) Other assets. : 62108 |
0,00 |
0,00 |
-456.000,00 |
0,00 |
0,00 |
|
|
7.
Divestment payment collection (+). : 62200 |
6.618.000,00 |
5.728.000,00 |
0,00 |
0,00 |
0,00 |
|
|
c) Fixed assets. : 62203 |
6.595.000,00 |
5.503.000,00 |
0,00 |
0,00 |
0,00 |
|
|
d) Real estate investment. : 62204 |
23.000,00 |
225.000,00 |
0,00 |
0,00 |
0,00 |
|
|
8.
Investment activity cash flows (6 + 7) minus Amortization: 62300 |
6.051.000,00 |
3.678.000,00 |
-2.171.000,00 |
-215.750.328,00 |
-9.125.000,00 |
|
|
9.
Payment collection and payments for equity instruments. : 63100 |
0,00 |
0,00 |
0,00 |
58.200.068,00 |
0,00 |
|
|
a) Issuance of equity instruments (+). : 63101 |
0,00 |
0,00 |
0,00 |
4.168,00 |
126.853.148,00 |
|
|
b) Amortization of assets instruments (-). : 63102 |
0,00 |
0,00 |
0,00 |
-190.784,00 |
0,00 |
|
|
10.
Payment collection and payments for financial liabilities instruments.:
63200 |
-11.879.000,00 |
-7.518.000,00 |
-811.000,00 |
363.665.378,00 |
23.977.000,00 |
|
|
a) Issuance : 63201 |
-11.879.000,00 |
-7.518.000,00 |
-811.000,00 |
363.665.378,00 |
23.977.000,00 |
|
|
2. Debts incurred with credit institutions (+). : 63203 |
-11.879.000,00 |
-7.518.000,00 |
-811.000,00 |
358.241.399,00 |
23.977.000,00 |
|
|
5. Other debts (+). : 63206 |
0,00 |
0,00 |
0,00 |
5.423.979,00 |
0,00 |
|
|
11.
Payments from dividends and remunerations from other assets instruments. :
63300 |
0,00 |
0,00 |
0,00 |
0,00 |
0,00 |
|
|
12.
Cash flows for financing activities (9+10+11).: 63400 |
-11.879.000,00 |
-7.518.000,00 |
-811.000,00 |
421.865.446,00 |
23.977.000,00 |
|
|
D)
EFECTO DE LAS VARIACIONES DE LOS TIPOS DE CAMBIO: 64000 |
0,00 |
0,00 |
0,00 |
0,00 |
0,00 |
|
|
E)
NET INCREASE/DECREASE OF CASH OR EQUIVALENT ASSETS (+/-5+/-8+/12+/-D) :
65000 |
267.000,00 |
4.561.000,00 |
-103.000,00 |
163.845.354,00 |
9.959.000,00 |
|
|
Cash or equivalent assets as of beginning of the fiscal year.:
65100 |
5.214.000,00 |
653.000,00 |
756.000,00 |
0,00 |
3.059.000,00 |
|
|
Cash or equivalent assets as of end of the fiscal year.:
65200 |
5.481.000,00 |
5.214.000,00 |
653.000,00 |
760.222,00 |
13.018.000,00 |
|
FINANCIAL DIAGNOSIS
>
Economic-Financial Comparative Analysis
Data used in the following ratios and indicators is taken from the
Annual Accounts submitted by the company to the TRADE REGISTER.
>
Comparison within the Sector
|
Cash
Flow |
2012 |
2011 |
Variación
2012 - 2011 |
|
|||
|
|
Empresa |
Sector |
Empresa |
Sector |
Empresa |
Sector |
|
|
Cash
Flow over Sales: |
0,01
% |
0,01
% |
0,07
% |
0,00
% |
-92,60
% |
|
|
|
EBITDA
over Sales: |
15,58
% |
9,55
% |
8,75
% |
10,07
% |
77,99
% |
-5,09
% |
|
|
Cash
Flow Yield: |
0,00
% |
0,00
% |
0,01
% |
0,00
% |
-91,97
% |
|
|
|
Profitability |
2012 |
2011 |
Variación
2012 - 2011 |
|
|||
|
|
Empresa |
Sector |
Empresa |
Sector |
Empresa |
Sector |
|
|
Operating
economic profitability: |
-25,38
% |
5,66
% |
-11,28
% |
6,97
% |
-124,95
% |
-18,78
% |
|
|
Total
economic profitability: |
-24,74
% |
2,71
% |
-11,16
% |
4,18
% |
-121,69
% |
-35,03
% |
|
|
Financial
profitability: |
50,77
% |
1,73
% |
74,22
% |
5,87
% |
-31,59
% |
-70,51
% |
|
|
Margin:
|
-90,29
% |
5,14
% |
-45,04
% |
6,36
% |
-100,46
% |
-19,21
% |
|
|
Mark-up:
|
-104,63
% |
1,91
% |
-58,17
% |
4,74
% |
-79,88
% |
-59,59
% |
|
|
Solvency |
2012 |
2011 |
Variación
2012 - 2011 |
|
|||
|
|
Empresa |
Sector |
Empresa |
Sector |
Empresa |
Sector |
|
|
Liquidity:
|
0,20 |
0,13 |
0,12 |
0,11 |
73,72 |
17,79 |
|
|
Acid
Test: |
1,32 |
0,87 |
1,03 |
0,83 |
27,97 |
4,64 |
|
|
Working
Capital / Investment: |
0,04 |
0,03 |
0,01 |
0,03 |
220,26 |
31,82 |
|
|
Solvency:
|
1,69 |
1,21 |
1,32 |
1,16 |
27,59 |
3,94 |
|
|
Indebtedness |
2012 |
2011 |
Variación
2012 - 2011 |
|
|||
|
|
Empresa |
Sector |
Empresa |
Sector |
Empresa |
Sector |
|
|
Indebtedness
level: |
-2,71 |
1,58 |
-5,81 |
1,65 |
53,34 |
-4,26 |
|
|
Borrowing
Composition: |
14,11 |
1,12 |
8,56 |
1,04 |
64,72 |
7,37 |
|
|
Repayment
Ability: |
1.551,21 |
124,65 |
95,01 |
704,05 |
1.532,72 |
-82,30 |
|
|
Warranty:
|
0,63 |
1,64 |
0,83 |
1,62 |
-23,76 |
1,72 |
|
|
Generated
resources / Total creditors: |
-0,13 |
0,07 |
-0,07 |
0,07 |
-94,90 |
-0,31 |
|
|
Efficiency |
2012 |
2011 |
Variación
2012 - 2011 |
|
|||
|
|
Empresa |
Sector |
Empresa |
Sector |
Empresa |
Sector |
|
|
Productivity:
|
1,34 |
1,76 |
1,19 |
1,75 |
12,18 |
0,16 |
|
|
Turnover
of Collection Rights : |
2,59 |
4,87 |
2,40 |
4,49 |
8,22 |
8,62 |
|
|
Turnover
of Payment Entitlements: |
3,41 |
3,53 |
3,16 |
3,27 |
7,81 |
8,09 |
|
|
Stock
rotation: |
37,12 |
6,86 |
35,21 |
6,09 |
5,40 |
12,69 |
|
|
Assets
turnover: |
0,28 |
1,10 |
0,25 |
1,10 |
12,22 |
0,53 |
|
|
Borrowing
Cost: |
2,66 |
3,04 |
3,04 |
2,93 |
-12,38 |
4,08 |
|
>
Trend of indicators under the General Accounting Plan of 2007 (2012, 2011,
2010, 2009, 2008)
|
Cash
Flow |
2012 |
2011 |
2010 |
2009 |
2008 |
|
|
Cash
Flow over Sales: |
0,01
% |
0,07
% |
|
28.193,87
% |
|
|
|
EBITDA
over Sales: |
15,58
% |
8,75
% |
|
131,00
% |
|
|
|
Cash
Flow Yield: |
0,00
% |
0,01
% |
0,00
% |
72,98
% |
4,20
% |
|
|
Profitability |
2012 |
2011 |
2010 |
2009 |
2008 |
|
|
Operating
economic profitability: |
-25,38
% |
-11,28
% |
-35,49
% |
7,13
% |
2,38
% |
|
|
Total
economic profitability: |
-24,74
% |
-11,16
% |
102,82
% |
-5,65
% |
-39,19
% |
|
|
Financial
profitability: |
50,77
% |
74,22
% |
679,31
% |
26,15
% |
117,25
% |
|
|
Margin:
|
-90,29
% |
-45,04
% |
-10,49
% |
9,76
% |
5,56
% |
|
|
Mark-up:
|
-104,63
% |
-58,17
% |
3.258,01
% |
-605,17
% |
-1.435,78
% |
|
|
Solvency |
2012 |
2011 |
2010 |
2009 |
2008 |
|
|
Liquidity:
|
0,20 |
0,12 |
0,10 |
0,00 |
1,31 |
|
|
Acid
Test: |
1,32 |
1,03 |
0,23 |
0,08 |
2,00 |
|
|
Working
Capital / Investment: |
0,04 |
0,01 |
-0,02 |
-0,86 |
0,04 |
|
|
Solvency:
|
1,69 |
1,32 |
0,23 |
0,09 |
2,01 |
|
|
Indebtedness |
2012 |
2011 |
2010 |
2009 |
2008 |
|
|
Indebtedness
level: |
-2,71 |
-5,81 |
8,13 |
-2,58 |
-3,26 |
|
|
Borrowing
Composition: |
14,11 |
8,56 |
28,54 |
0,73 |
33,51 |
|
|
Repayment
Ability: |
1.551,21 |
95,01 |
-1.863,88 |
-9,26 |
-36,06 |
|
|
Warranty:
|
0,63 |
0,83 |
1,12 |
0,61 |
0,69 |
|
|
Generated
resources / Total creditors: |
-0,13 |
-0,07 |
-0,28 |
-0,05 |
-0,06 |
|
|
Efficiency |
2012 |
2011 |
2010 |
2009 |
2008 |
|
|
Productivity:
|
1,34 |
1,19 |
0,90 |
1,30 |
1,19 |
|
|
Turnover
of Collection Rights : |
2,59 |
2,40 |
7,47 |
1,20 |
1,27 |
|
|
Turnover
of Payment Entitlements: |
3,41 |
3,16 |
1,90 |
1,15 |
1,35 |
|
|
Stock
rotation: |
37,12 |
35,21 |
|
3.345,34 |
|
|
|
Assets
turnover: |
0,28 |
0,25 |
3,38 |
0,73 |
0,43 |
|
|
Borrowing
Cost: |
2,66 |
3,04 |
7,88 |
7,34 |
8,78 |
|
COMPARATIVE SECTORIAL BALANCE
Sector-based
Comparison under the rules of the New General Accounting Plan.
|
Variación
- |
|
|
Empresa |
Sector |
|
Variación
- |
|
|
Empresa |
Sector |
|
Variación
- |
|
|
Empresa |
Sector |
Public Tenders and Works Won
No Public Tenders assigned to the name of the company.
Research Summary
|
The subject is a leader company in its activity and its evolution is conditioned by the current situation of the market. Due to the accumulation of losses in the latest years, there is an important debt situation. It has not guarantees with its creditors. |
Sources
Registry of Commerce's Official Gazette. Own and external data bases Company References
FOREIGN EXCHANGE RATES
|
Currency |
Unit
|
Indian Rupees |
|
US Dollar |
1 |
Rs.61.32 |
|
UK Pound |
1 |
Rs.102.54 |
|
Euro |
1 |
Rs.84.19 |
INFORMATION DETAILS
|
Report Prepared
by : |
MNL |
RATING EXPLANATIONS
|
RATING |
STATUS |
PROPOSED CREDIT LINE |
|
|
|
>86 |
Aaa |
Possesses an extremely sound financial base with the strongest capability
for timely payment of interest and principal sums |
Unlimited |
|
|
71-85 |
Aa |
Possesses adequate working capital. No caution needed for credit
transaction. It has above average (strong) capability for payment of interest
and principal sums |
Large |
|
|
56-70 |
A |
Financial & operational base are regarded healthy. General
unfavourable factors will not cause fatal effect. Satisfactory capability for
payment of interest and principal sums |
Fairly Large |
|
|
41-55 |
Ba |
Overall operation is considered normal. Capable to meet normal
commitments. |
Satisfactory |
|
|
26-40 |
B |
Capability to overcome financial difficulties seems comparatively
below average. |
Small |
|
|
11-25 |
Ca |
Adverse factors are
apparent. Repayment of interest and principal sums in default or expected to
be in default upon maturity |
Limited with full security |
|
|
<10 |
C |
Absolute credit risk exists. Caution needed to be exercised |
Credit not
recommended |
|
|
-- |
NB |
New Business |
-- |
|
This score serves as a reference to assess SC’s credit risk
and to set the amount of credit to be extended. It is calculated from a
composite of weighted scores obtained from each of the major sections of this
report. The assessed factors and their relative weights (as indicated through
%) are as follows:
Financial
condition (40%) Ownership
background (20%) Payment
record (10%)
Credit history
(10%) Market trend
(10%) Operational
size (10%)
This report is issued at your request without any
risk and responsibility on the part of MIRA INFORM PRIVATE LIMITED (MIPL)
or its officials.