MIRA
INFORM REPORT
|
Report Date : |
13.03.2014 |
IDENTIFICATION DETAILS
|
Name : |
HINDUSTAN ADHESIVES LIMITED |
|
|
|
|
Registered
Office : |
340/2-A, |
|
|
|
|
Country : |
|
|
|
|
|
Financials (as
on) : |
31.03.2013 |
|
|
|
|
Date of
Incorporation : |
05.04.1988 |
|
|
|
|
Com. Reg. No.: |
55-031191 |
|
|
|
|
Capital
Investment / Paid-up Capital : |
Rs. 51.163 Millions |
|
|
|
|
CIN No.: [Company Identification
No.] |
L74899DL1988PLC031191 |
|
|
|
|
TAN No.: [Tax Deduction &
Collection Account No.] |
DELH00730C |
|
|
|
|
Legal Form : |
A Public Limited Liability Company. The Company’s Shares are Listed on
the Stock Exchanges. |
|
|
|
|
Line of Business
: |
Manufacturer, Exporter and Importer of Self Adhesives
Tapes and BOPP Films. |
|
|
|
|
No. of Employees
: |
250 (Approximately) |
RATING & COMMENTS
|
MIRA’s Rating : |
Ba (42) |
|
RATING |
STATUS |
PROPOSED CREDIT LINE |
|
|
41-55 |
Ba |
Overall operation is considered normal. Capable to meet normal
commitments. |
Satisfactory |
|
Maximum Credit Limit : |
USD 530000 |
|
|
|
|
Status : |
Satisfactory |
|
|
|
|
Payment Behaviour : |
Slow but correct |
|
|
|
|
Litigation : |
Clear |
|
|
|
|
Comments : |
Subject is an established company having satisfactory track record. Profitability of the company seems to be fair. Trade relations are fair. Business is active. Payment terms are
reported to be slow but correct. The company can be considered for business dealings at usual trade
terms and condition. |
NOTES :
Any query related to this report can be made
on e-mail : infodept@mirainform.com
while quoting report number, name and date.
ECGC Country Risk Classification List – December 1, 2013
|
Country Name |
Previous Rating (30.09.2013) |
Current Rating (01.12.2013) |
|
India |
A1 |
A1 |
|
Risk Category |
ECGC
Classification |
|
Insignificant |
A1 |
|
Low |
A2 |
|
Moderate |
B1 |
|
High |
B2 |
|
Very High |
C1 |
|
Restricted |
C2 |
|
Off-credit |
D |
INDIAN ECONOMIC OVERVIEW
The worst is over for India’s economy with gross domestic product likely
to expand 5 %to 5.5 % this year and more than 6 % in 2015, according to Moody’s
Analytics. Concerns over the rupee and current account deficit are under
control, said the agency. Ratings firm Crisil has forecast 6 % growth for
2014/15 up from the estimated 4.8 % for 2013/14. Total economic growth,
infrastructure bottlenecks and lack of transparency and consistency in foreign
direct investment policies seem to have taken a toll on India’s attractiveness
as an investment destination, says an Ernst & Young survey. Projects
with FDI component fell 16.4 % across the globe in 2012 from the previous
year. The drop in India was steeper at 21 %. State run carrier Air India
is doling out free tickets to its 24000 employees, even as it expects to incur
a loss of Rs 39000 mn this financial year and has a debt of Rs 350000 mn.
550000 number of jobs generated across India in 2013, a fall of 0.4 % as
compared to with a year earlier. The National Capital Region has a
one-fourth share in total jobs created, according to a study by industry lobby
group Assochem, Banks, real estate, automobile and telecommunications sectors
are showing a rise of job creation. $ 805 mn investments by venture capital
firms in India during 2013, registering a drop of about 18 % over the previous
year. The Information Technology and IT-Enabled Services Industry retained
its status as the favourable venture capital investors in 2013. Pakistan has
temporarily banned gold imports for the second time in six months, as it tries
to stem smuggling into India. India’s import duty on gold is 10 % and curbs on
purchases have dried up legal imports into what used to be the world’s biggest
bullion buyers. The World Gold Council puts the amount smuggled into India at
upto 200 tonnes in 2013. The Reserve Bank of India has proposed that unclaimed
bank deposits estimated to be about Rs 35000 mn be used for education and
awareness among depositors. According to the plan, deposits that have not
been claimed for at least 10 years will be transferred to the scheme.
RBI DEFAULTERS’ LIST STATUS
Subject’s name is not enlisted as a defaulter
in the publicly available RBI Defaulters’ list.
EPF (Employee Provident Fund) DEFAULTERS’ LIST STATUS
Subject’s name is not enlisted as a defaulter
in the publicly available EPF (Employee Provident Fund) Defaulters’ list as of
31-03-2012.
INFORMATION PARTED BY
|
Name : |
Ms. Suman Trivedi |
|
Designation : |
Account Executive |
|
Contact No.: |
91-120-2674450 |
|
Date : |
11.03.2014 |
LOCATIONS
|
Registered Office : |
340/2-A, |
|
Tel. No.: |
91-11-22111379/23719734 / 41650348 / 41650347 / 26714080 |
|
Fax No.: |
91-11-23328210 / 26191358 / 25131098 |
|
E-Mail : |
|
|
Website : |
|
|
Location : |
Owned |
|
|
|
|
Corporate Office : |
B-2 / 8, Safdarjung Enclave, |
|
Tel. No.: |
91-11-51650347-48, 51650350 / 26714080 |
|
Fax No.: |
91-11-51650349 / 26191358 |
|
E-Mail : |
|
|
|
|
|
Factory 1 : |
29th Mile Stone, Village Achheja, Tehsil Dadri, District Gautam Budh Nagar, Uttar Pradesh |
|
Tel. No.: |
91-120-2674450 |
|
Location : |
Owned |
|
|
|
|
Factory 2 : |
Plot No. 15, K.I.E Industrial Estate, Village - Mundiyaki, Pargana- Manglour, Tehsil Roorkee, District Haridwar- 247 667, Uttarakhand, India |
DIRECTORS
As on 31.03.2013
|
Name : |
Mr. Lalit Kumar Bagla |
|
Designation : |
Chairman |
|
Date of Birth/Age : |
25.09.1941 |
|
Qualification : |
Graduate |
|
Experience : |
50 years |
|
Date of Appointment : |
25.04.1988 |
|
Other Directorships
: |
1. Bagla Polifilms Limited 2. Agarwal Tracom Private Limited 3. Alora Trading Company Limited |
|
|
|
|
Name : |
Mr. M. S. Bagla |
|
Designation : |
Managing Director |
|
Date of Birth/Age : |
16.03.1963 |
|
Qualification : |
Graduate |
|
Experience : |
32 years |
|
Date of Appointment : |
05.04.1988 |
|
Other Directorships
: |
1. Hindustan Foils Limited 2. BhutnathTradelink Private Limited 3. Agarwal Tracom Private Limited 4. Bagla Polifilms Limited 5. Umesh Commercial Company Limited 6. Alora Trading Company Limited |
|
|
|
|
Name : |
Mr. Dev Prakash Gupta |
|
Designation : |
Director |
|
Date of Birth/Age : |
12.10.1961 |
|
Qualification : |
P.H.D. in Chemical |
|
Experience : |
24 years |
|
Date of Appointment : |
31.10.2011 |
|
|
|
|
Name : |
Mr. K.C. Gupta |
|
Designation : |
Director |
|
|
|
|
Name : |
Mr. Pawan Sharma |
|
Designation : |
Director |
|
|
|
|
Name : |
Mr. Suresh Ajila |
|
Designation : |
Director |
|
|
|
|
Name : |
Mrs. Urmila Goenka |
|
Designation : |
Director |
KEY EXECUTIVES
|
Name : |
Mr. S. S. Dua |
|
Designation : |
Company Secretary |
|
|
|
|
Name : |
Ms. Suman Trivedi |
|
Designation : |
Account Executive |
MAJOR SHAREHOLDERS / SHAREHOLDING PATTERN
As on 31.12.2013
|
Category of
Shareholder |
No. of Shares |
% of No. of
Shares |
|
|
(A) Shareholding of Promoter and Promoter Group |
|
|
|
|
|
|
|
|
|
|
2393329 |
46.78 |
|
|
|
640400 |
12.52 |
|
|
|
3033729 |
59.30 |
|
|
|
|
|
|
|
Total shareholding of Promoter and Promoter Group (A) |
3033729 |
59.30 |
|
|
(B) Public Shareholding |
|
|
|
|
|
|
|
|
|
|
200 |
0.00 |
|
|
|
200 |
0.00 |
|
|
|
|
|
|
|
|
861976 |
16.85 |
|
|
|
|
|
|
|
|
1037106 |
20.27 |
|
|
|
165371 |
3.23 |
|
|
|
17918 |
0.35 |
|
|
|
11319 |
0.22 |
|
|
|
6499 |
0.13 |
|
|
|
100 |
0.00 |
|
|
|
2082371 |
40.70 |
|
|
Total Public shareholding (B) |
2082571 |
40.70 |
|
|
Total (A)+(B) |
5116300 |
100.00 |
|
|
(C) Shares held by Custodians and against which Depository
Receipts have been issued |
0 |
0.00 |
|
|
|
0 |
0.00 |
|
|
|
0 |
0.00 |
|
|
|
0 |
0.00 |
|
|
Total (A)+(B)+(C) |
5116300 |
0.00 |

BUSINESS DETAILS
|
Line of Business : |
Manufacturer, Exporter and Importer of Self Adhesives
Tapes and BOPP Films. |
||||||||
|
|
|
||||||||
|
Products : |
|
||||||||
|
|
|
||||||||
|
Exports : |
|
||||||||
|
Products : |
Finished Goods |
||||||||
|
Countries : |
·
Canada ·
Indonesia |
||||||||
|
|
|
||||||||
|
Imports : |
|
||||||||
|
Products : |
Raw Materials |
||||||||
|
Countries : |
Austria |
||||||||
|
|
|
||||||||
|
Terms : |
|
||||||||
|
Selling : |
L/C / Credit |
||||||||
|
|
|
||||||||
|
Purchasing : |
L/C / Credit |
GENERAL INFORMATION
|
Customers : |
End Users |
||||||||||||||||||||||||||||||||||||||||||||||||||||||
|
|
|
||||||||||||||||||||||||||||||||||||||||||||||||||||||
|
No. of Employees : |
250 (Approximately) |
||||||||||||||||||||||||||||||||||||||||||||||||||||||
|
|
|
||||||||||||||||||||||||||||||||||||||||||||||||||||||
|
Bankers : |
·
IDBI Bank, Videocon Tower, Jhandewalan, New
Delhi, India ·
Allahabad Bank, International Branch, Partiament
Street, New Delhi, India ·
HDFC Bank ·
ICICI Bank Limited ·
Indusind Bank Limited |
||||||||||||||||||||||||||||||||||||||||||||||||||||||
|
|
|
||||||||||||||||||||||||||||||||||||||||||||||||||||||
|
Facilities : |
(Rs.
In Millions)
|
||||||||||||||||||||||||||||||||||||||||||||||||||||||
|
|
|
|
Banking
Relations : |
--- |
|
|
|
|
Auditors : |
|
|
Name : |
Salarpuria and Partners Chartered Accountants |
|
Address : |
1008 Chiranjiv Tower, 43, Nehru Place, New Delhi – 110 019, India |
|
|
|
|
Where Control Exist
: |
· Hindustan Foils Limited · Agarwal Tracom Private Limited · Bagla Polifilms Limited · Alora Trading Company Limited |
|
|
|
|
Others : |
Surya Consumers Goods Private Limited |
CAPITAL STRUCTURE
As on 31.03.2013
Authorised Capital :
|
No. of Shares |
Type |
Value |
Amount |
|
|
|
|
|
|
7000000 |
Equity Shares |
Rs.10/- each |
Rs. 70.000 Millions |
|
|
|
|
|
Issued, Subscribed & Paid-up Capital :
|
No. of Shares |
Type |
Value |
Amount |
|
|
|
|
|
|
5116300 |
Equity Shares |
Rs.10/- each |
Rs.51.163
Millions |
|
|
|
|
|
(Out of Which: 1,029,000 Equity share of Rs.10/- each Fully paid up, issued as Bonus Share by Capitalisation of General Reserve)
DETAILS OF
SHAREHOLDER HOLDING 5% OR MORE SHARES:
|
Name of Share
holder |
No. of Shares |
% |
|
Mr. Madhusudan Bagla |
812,419 |
15.88 |
|
Mrs. Anju Bagla |
598,630 |
11.70 |
|
Master Dhruv Bagla |
314,580 |
6.15 |
|
Mr. Nakul Bagla |
372,100 |
7.27 |
|
Mr. M S Bagla-karta (M S Bagla - HUF) |
269,250 |
5.26 |
FINANCIAL DATA
[all figures are
in Rupees Millions]
ABRIDGED BALANCE
SHEET
|
SOURCES OF FUNDS |
|
31.03.2013 |
31.03.2012 |
|
I.
EQUITY
AND LIABILITIES |
|
|
|
|
(1)Shareholders' Funds |
|
|
|
|
(a) Share Capital |
|
51.163 |
51.163 |
|
(b) Reserves & Surplus |
|
83.541 |
67.224 |
|
(c) Money
received against share warrants |
|
0.000 |
0.000 |
|
|
|
|
|
|
(2) Share Application money pending allotment |
|
0.000 |
0.000 |
|
Total
Shareholders’ Funds (1) + (2) |
|
134.704 |
118.387 |
|
|
|
|
|
|
(3)
Non-Current Liabilities |
|
|
|
|
(a) long-term borrowings |
|
94.038 |
115.928 |
|
(b) Deferred tax liabilities (Net) |
|
19.996 |
17.440 |
|
(c) Other long term liabilities |
|
0.000 |
0.000 |
|
(d) long-term provisions |
|
6.684 |
5.562 |
|
Total Non-current Liabilities (3) |
|
120.718 |
138.930 |
|
|
|
|
|
|
(4) Current Liabilities |
|
|
|
|
(a) Short term borrowings |
|
134.356 |
120.914 |
|
(b) Trade payables |
|
58.285 |
50.504 |
|
(c) Other current
liabilities |
|
14.283 |
12.575 |
|
(d) Short-term provisions |
|
0.343 |
0.347 |
|
Total Current Liabilities (4) |
|
207.267 |
184.340 |
|
|
|
|
|
|
TOTAL |
|
462.689 |
441.657 |
|
|
|
|
|
|
II.
ASSETS |
|
|
|
|
(1) Non-current assets |
|
|
|
|
(a) Fixed Assets |
|
|
|
|
(i) Tangible assets |
|
226.572 |
227.509 |
|
(ii) Intangible Assets |
|
0.000 |
0.000 |
|
(iii) Capital
work-in-progress |
|
0.000 |
11.636 |
|
(iv)
Intangible assets under development |
|
0.000 |
0.000 |
|
(b) Non-current Investments |
|
0.000 |
0.000 |
|
(c) Deferred tax assets (net) |
|
0.000 |
0.000 |
|
(d) Long-term Loan and Advances |
|
0.000 |
0.000 |
|
(e) Other Non-current assets |
|
5.048 |
5.393 |
|
Total Non-Current Assets |
|
231.620 |
244.538 |
|
|
|
|
|
|
(2) Current assets |
|
|
|
|
(a) Current investments |
|
0.000 |
0.000 |
|
(b) Inventories |
|
87.859 |
80.724 |
|
(c) Trade receivables |
|
114.530 |
90.459 |
|
(d) Cash and cash
equivalents |
|
8.475 |
4.819 |
|
(e) Short-term loans and
advances |
|
13.301 |
14.213 |
|
(f) Other current assets |
|
6.904 |
6.904 |
|
Total Current Assets |
|
231.069 |
197.119 |
|
|
|
|
|
|
TOTAL |
|
462.689 |
441.657 |
|
SOURCES OF FUNDS |
|
|
31.03.2011 |
|
|
SHAREHOLDERS FUNDS |
|
|
|
|
|
1] Share Capital |
|
|
51.163 |
|
|
2] Share Application Money |
|
|
0.000 |
|
|
3] Reserves & Surplus |
|
|
51.075 |
|
|
4] (Accumulated Losses) |
|
|
0.000 |
|
|
NETWORTH |
|
|
102.238 |
|
|
LOAN FUNDS |
|
|
|
|
|
1] Secured Loans |
|
|
134.767 |
|
|
2] Unsecured Loans |
|
|
30.613 |
|
|
TOTAL BORROWING |
|
|
165.380 |
|
|
DEFERRED TAX LIABILITIES |
|
|
13.400 |
|
|
|
|
|
|
|
|
TOTAL |
|
|
281.018 |
|
|
|
|
|
|
|
|
APPLICATION OF FUNDS |
|
|
|
|
|
|
|
|
|
|
|
FIXED ASSETS [Net Block] |
|
|
104.583 |
|
|
Capital work-in-progress |
|
|
48.220 |
|
|
|
|
|
|
|
|
INVESTMENT |
|
|
0.000 |
|
|
DEFERREX TAX ASSETS |
|
|
0.000 |
|
|
|
|
|
|
|
|
CURRENT ASSETS, LOANS & ADVANCES |
|
|
|
|
|
|
Inventories |
|
|
74.397
|
|
|
Sundry Debtors |
|
|
100.400
|
|
|
Cash & Bank Balances |
|
|
10.703
|
|
|
Other Current Assets |
|
|
6.904
|
|
|
Loans & Advances |
|
|
31.023
|
|
Total
Current Assets |
|
|
223.427
|
|
|
Less : CURRENT
LIABILITIES & PROVISIONS |
|
|
|
|
|
|
Sundry Creditors |
|
|
64.667
|
|
|
Other Current Liabilities |
|
|
10.099
|
|
|
Provisions |
|
|
20.446
|
|
Total
Current Liabilities |
|
|
95.212
|
|
|
Net Current Assets |
|
|
128.215
|
|
|
|
|
|
|
|
|
MISCELLANEOUS EXPENSES |
|
|
0.000 |
|
|
|
|
|
|
|
|
TOTAL |
|
|
281.018 |
|
PROFIT & LOSS
ACCOUNT
|
|
PARTICULARS |
31.03.2013 |
31.03.2012 |
31.03.2011 |
|
|
|
SALES |
|
|
|
|
|
|
|
Income |
762.583 |
667.390 |
629.385 |
|
|
|
Other Income |
2.393 |
2.299 |
0.631 |
|
|
|
TOTAL (A) |
764.976 |
669.689 |
630.016 |
|
|
|
|
|
|
|
|
Less |
EXPENSES |
|
|
|
|
|
|
|
Cost of Materials Consumed |
497.638 |
|
|
|
|
|
Purchases of Stock-in-Trade |
0.000 |
10.017 |
|
|
|
|
Changes in inventories of finished goods, work-in-progress
and Stock-in-Trade |
(3.362) |
(0.401) |
569.718 |
|
|
|
Employees benefits expense |
43.698 |
38.019 |
|
|
|
|
Other expenses |
147.150 |
128.488 |
|
|
|
|
TOTAL (B) |
685.124 |
610.433 |
569.718 |
|
|
|
|
|
|
|
|
Less |
PROFIT
BEFORE INTEREST, TAX, DEPRECIATION AND AMORTISATION (A-B) (C) |
79.852 |
59.256 |
60.298 |
|
|
|
|
|
|
|
|
|
Less |
FINANCIAL
EXPENSES (D) |
33.890 |
21.258 |
18.266 |
|
|
|
|
|
|
|
|
|
|
PROFIT
BEFORE TAX, DEPRECIATION AND AMORTISATION (C-D) (E) |
45.962 |
37.998 |
42.032 |
|
|
|
|
|
|
|
|
|
Less/ Add |
DEPRECIATION/
AMORTISATION (F) |
21.883 |
15.312 |
15.647 |
|
|
|
|
|
|
|
|
|
|
PROFIT BEFORE
TAX (E-F) (G) |
24.079 |
22.686 |
26.385 |
|
|
|
|
|
|
|
|
|
Less |
TAX (H) |
8.315 |
6.983 |
8.665 |
|
|
|
|
|
|
|
|
|
|
PROFIT AFTER TAX
(G-H) (I) |
15.764 |
15.703 |
17.720 |
|
|
|
|
|
|
|
|
|
Add |
PREVIOUS
YEARS’ BALANCE BROUGHT FORWARD |
43.017 |
27.314 |
9.594 |
|
|
|
|
|
|
|
|
|
|
BALANCE CARRIED
TO THE B/S |
58.781 |
43.017 |
27.314 |
|
|
|
|
|
|
|
|
|
|
EARNINGS IN
FOREIGN CURRENCY |
|
|
|
|
|
|
|
Export value of FOB basis |
88.358 |
66.416 |
58.050 |
|
|
TOTAL EARNINGS |
88.358 |
66.416 |
58.050 |
|
|
|
|
|
|
|
|
|
|
IMPORTS |
|
|
|
|
|
|
|
Raw Materials |
147.890 |
83.445 |
69.770 |
|
|
|
Capital Goods |
6.014 |
82.370 |
0.482 |
|
|
|
Others |
3.768 |
2.881 |
0.245 |
|
|
TOTAL IMPORTS |
157.672 |
168.696 |
70.497 |
|
|
|
|
|
|
|
|
|
|
Earnings Per
Share (Rs.) |
3.08 |
3.07 |
3.46 |
|
QUARTERLY RESULTS
|
PARTICULARS |
30.06.2013 |
30.09.2013 |
31.12.2013 |
|
|
1st
Quarter |
2nd
Quarter |
3rd
Quarter |
|
Net Sales |
184.000 |
188.900 |
201.200 |
|
Total Expenditure |
157.400 |
168.800 |
183.700 |
|
PBIDT (Excl OI) |
26.600 |
20.100 |
17.500 |
|
Other Income |
0.000 |
0.000 |
1.200 |
|
Operating Profit |
26.600 |
20.100 |
18.700 |
|
Interest |
7.700 |
8.000 |
9.000 |
|
Exceptional Items |
0.000 |
0.000 |
0.000 |
|
PBDT |
18.900 |
12.100 |
9.700 |
|
Depreciation |
5.300 |
5.500 |
5.300 |
|
Profit Before Tax |
13.600 |
6.600 |
4.400 |
|
Tax |
2.200 |
3.700 |
1.100 |
|
Provisions and contingencies |
0.000 |
0.000 |
0.000 |
|
Profit After Tax |
11.400 |
2.900 |
3.300 |
|
Extraordinary Items |
0.000 |
0.000 |
0.000 |
|
Prior Period Expenses |
0.000 |
0.000 |
0.000 |
|
Other Adjustments |
0.000 |
0.000 |
0.000 |
|
Net Profit |
11.400 |
2.900 |
3.300 |
KEY RATIOS
|
PARTICULARS |
|
31.03.2013 |
31.03.2012 |
31.03.2011 |
|
PAT / Total Income |
(%) |
2.06 |
2.34 |
2.81 |
|
|
|
|
|
|
|
Net Profit Margin (PBT/Sales) |
(%) |
3.16 |
3.40 |
4.19 |
|
|
|
|
|
|
|
Return on Total Assets (PBT/Total Assets} |
(%) |
5.20 |
5.28 |
8.04
|
|
|
|
|
|
|
|
Return on Investment (ROI) (PBT/Networth) |
|
0.18 |
0.19 |
1.62
|
|
|
|
|
|
|
|
Debt Equity Ratio (Total Debt /Networth) |
|
1.70 |
2.00 |
1.62
|
|
|
|
|
|
|
|
Current Ratio (Current Asset/Current Liability) |
|
1.11 |
1.07 |
2.35
|
FINANCIAL ANALYSIS
[all figures are
in Rupees Millions]
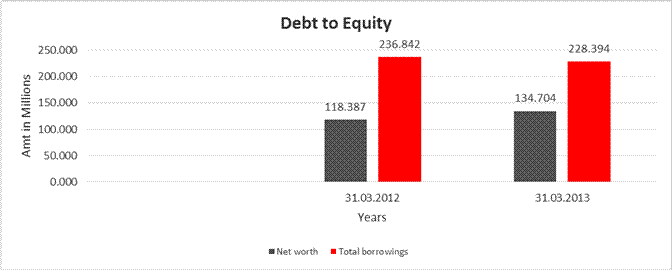
DEBT EQUITY RATIO
|
Particular |
31.03.2012 |
31.03.2013 |
|
|
(Rs.
In Millions) |
(Rs.
In Millions) |
|
Share Capital |
51.163 |
51.163 |
|
Reserves & Surplus |
67.224 |
83.541 |
|
Net
worth |
118.387 |
134.704 |
|
|
|
|
|
long-term borrowings |
115.928 |
94.038 |
|
Short term borrowings |
120.914 |
134.356 |
|
Total
borrowings |
236.842 |
228.394 |
|
Debt/Equity
ratio |
2.001 |
1.696 |
YEAR-ON-YEAR GROWTH
|
Year
on Year Growth |
31.03.2011 |
31.03.2012 |
31.03.2013 |
|
|
(Rs.
In Millions) |
(Rs.
In Millions) |
(Rs.
In Millions) |
|
Sales |
629.385 |
667.390 |
762.583 |
|
|
|
6.038 |
14.263 |

NET PROFIT MARGIN
|
Net
Profit Margin |
31.03.2011 |
31.03.2012 |
31.03.2013 |
|
|
(Rs.
In Millions) |
(Rs.
In Millions) |
(Rs.
In Millions) |
|
Sales |
629.385 |
667.390 |
762.583 |
|
Profit |
17.720 |
15.703 |
15.764 |
|
|
2.82% |
2.35% |
2.07% |

LOCAL AGENCY FURTHER INFORMATION
|
Sr. No. |
Check List by Info
Agents |
Available in Report (Yes / No) |
|
1] |
Year of Establishment |
Yes |
|
2] |
Locality of the firm |
Yes |
|
3] |
Constitutions of the firm |
Yes |
|
4] |
Premises details |
No |
|
5] |
Type of Business |
Yes |
|
6] |
Line of Business |
Yes |
|
7] |
Promoter's background |
Yes |
|
8] |
No. of employees |
Yes |
|
9] |
Name of person contacted |
Yes |
|
10] |
Designation of contact person |
Yes |
|
11] |
Turnover of firm for last three years |
Yes |
|
12] |
Profitability for last three years |
Yes |
|
13] |
Reasons for variation <> 20% |
---------------------- |
|
14] |
Estimation for coming financial year |
No |
|
15] |
Capital in the business |
Yes |
|
16] |
Details of sister concerns |
Yes |
|
17] |
Major suppliers |
No |
|
18] |
Major customers |
No |
|
19] |
Payments terms |
Yes |
|
20] |
Export / Import details (if applicable) |
Yes |
|
21] |
Market information |
---------------------- |
|
22] |
Litigations that the firm / promoter involved in |
---------------------- |
|
23] |
Banking Details |
Yes |
|
24] |
Banking facility details |
Yes |
|
25] |
Conduct of the banking account |
---------------------- |
|
26] |
Buyer visit details |
---------------------- |
|
27] |
Financials, if provided |
Yes |
|
28] |
Incorporation details, if applicable |
Yes |
|
29] |
Last accounts filed at ROC |
Yes |
|
30] |
Major Shareholders, if available |
Yes |
|
31] |
Date of Birth of Proprietor/Partner/Director, if available |
Yes |
|
32] |
PAN of Proprietor/Partner/Director, if available |
No |
|
33] |
Voter ID No of Proprietor/Partner/Director, if available |
No |
|
34] |
External Agency Rating, if available |
No |
UNSECURED LOAN
Rs.
In Millions
|
Particular |
As
on 31.03.2013 |
As
on 31.03.2012 |
|
LONG TERM
BORROWINGS |
|
|
|
FROM BODIES
CORPORATE : |
|
|
|
Related Parties |
16.400 |
16.050 |
|
Others |
10.000 |
25.348 |
|
From Directors |
2.500 |
2.568 |
|
From Others (Including Deferred Credit) |
21.671 |
16.451 |
|
Total |
50.571 |
60.417 |
|
|
|
|
OPERATIONS
The Company continues to increase the sales of Carton Sealing Tapes and other Specialty Adhesive Coated products by providing the customers an excellent quality product backed by dedicated customer services. The Company continues to add value to the product and has focus towards using self adhesive tapes as both a security feature and as well as a product branding tool which have resulted in higher sales and as well better contribution to the profits of the company in the current year.
The Company has now reduced its BOPP film production for converting into adhesive tapes due to cheaper availability of films in the market from the competitors and has undertaken an initiative to upgrade the quality of the film plant by some major changes in the critical components of the film plant which will become operational by March 2014, and then allow the company to make a variety of films for selling in the market.
The Company has commenced production of POF shrink films from 16th March, 2012 in the new location at Roorkee in Uttarakhand and this new product has been well appreciated in the market and will also help significantly in improving the sales turnover of the company and enhancing its profits in the current financial year.
CURRENT SCENARIO
The growing sales of Carton Sealing Tapes and the acceptance of the new products developed by the Company for the Indian market and as well growth in the FMCG sector in India for all manufactured products and services provides ample opportunity for the Company to utilize full capacities for production of Self Adhesive Tapes and be able to focus on building its Brand and Image as a quality supplier of Adhesive Coated Products in India.
The Company expects to utilize 100% capacity of the POF shrink films plant during the current year which will enhance the turnover and bring good profits to the Company.
The recent fall in the value of the INR against the USD has been beneficial for the company as it has helped in promoting exports of our manufactured products, since it would now be able to take more advantage of the global network created over the last few years with consistent exports to various parts of the world for different types of packaging materials.
FINANCIAL RESULTS
The total income of the Company has increased by about 14.30% despite the slowdown in the global economy, whereas the PAT has increased marginally by about 0.39%, due to the volatility in raw material prices during the year and the higher rates of interest charged by the lenders.
The Company is confident of further improving the performance in the Current financial year and is pleased to inform you that it is moving towards greater success and prosperity and would keep looking for new opportunities to expand the business in the packaging industry.
INDEX OF CHARGES
|
S.No. |
Charge ID |
Date of Charge
Creation/Modification |
Charge amount
secured |
Charge Holder |
Address |
Service Request
Number (SRN) |
|
1 |
10453011 |
10/02/2014 * |
60,000,000.00 |
IDBI BANK LIMITED |
3RD FLOOR, INDIAN RED CROSS SOCIETY BUILDING, 1, RED CROSS ROAD, NEW DELHI, DELHI -110001, INDIA |
B96102223 |
|
2 |
10382654 |
27/12/2013 * |
205,000,000.00 |
IDBI BANK LIMITED |
3RD FLOOR, INDIAN RED CROSS SOCIETY BUILDING, 1, RED CROSS ROAD, NEW DELHI, DELHI -110001, INDIA |
B93102846 |
|
3 |
10369534 |
17/10/2013 * |
123,000,000.00 |
IDBI BANK LIMITED |
3RD FLOOR, INDIAN RED CROSS SOCIETY BUILDING, 1, RED CROSS ROAD, NEW DELHI, DELHI -110001, INDIA |
B87124954 |
|
4 |
10219496 |
27/12/2013 * |
331,200,000.00 |
ALLAHABAD BANK |
INTERNATIONAL RANCH, NEW DELHI, 3RD FLOOR, 17 PARLIAMENT STREET, NEW DELHI, DELHI - 110001, INDIA |
B93931194 |
|
5 |
10219493 |
19/03/2010 |
139,700,000.00 |
ALLAHABAD BANK |
INTERNATIONAL BRANCH, 17, PARLIAMENT STREET,, NEW |
A85365344 |
|
6 |
10157551 |
04/01/2014 * |
205,000,000.00 |
IDBI BANK LIMITED |
3RD FLOOR, INDIAN RED CROSS SOCIETY BUILDING, 1, RED CROSS ROAD, NEW DELHI, DELHI -110001, INDIA |
B93957694 |
|
7 |
10106269 |
05/06/2008 |
63,750,000.00 |
IDBI BANK LIMITED |
IDBI TOWERWTC COMPLEX, CUFFE PARADE, MUMBAI, MAHARASHTRA - 400005, INDIA |
A39900923 |
|
8 |
80026962 |
06/04/2004 |
95,500,000.00 |
THE UNITED WESTERN BANK LIMITED |
KAROL BAGH, NEW DELHI, DELHI - 110005, INDIA |
- |
|
9 |
90063104 |
06/04/2004 |
36,700,000.00 |
ALLAHABAD BANK |
DELHI GATE, 228; HAPUR ROAD, GHAZIABAD, UTTAR PRADESH - 201001, INDIA |
- |
|
10 |
90061434 |
17/04/2003 * |
34,700,000.00 |
ALLAHABAD BANK |
DELHI GATE, GHAZIABAD, UTTAR PRADESH, INDIA |
- |
|
11 |
90060820 |
10/01/1998 * |
26,100,000.00 |
ALLAHABAD BANK |
DELHI GATE, GHAZIABAD AND SCINDIA HOUSE, DELHI, DELHI, INDIA |
- |
|
12 |
90060721 |
06/12/1996 * |
600,000,000.00 |
THE UNITED WESTERN BANK LIMITED |
2046; GURUDWARA ROAD, KAROL BAGH, NEW DELHI, DELHI, INDIA |
- |
* Date of charge modification
FIXED ASSETS
·
Land (Freehold)
·
Building
·
Plant and Machinery
·
Electric Installation
·
Furniture and Fixtures
·
Air Conditioner
·
Office Equipment
·
Car’s
·
Delivery Trucks
·
Scooters
·
Cycles
·
Computers
UNAUDITED
FINANCIAL RESULTS FOR THE THREE MONTHS ENDED 31.12.2013
(Rs. in millions)
|
Sr. No. |
Particular |
Quarter Ended |
Nine Months |
|
|
|
|
3 Months Ended 31.12.2013 |
3 Months Ended 30.09.2013 |
9 Months Ended 31.12.2013 |
|
1. |
Net Sales/Income
from Operations |
201.200 |
188.900 |
574.100 |
|
2. |
Other Income |
1.200 |
0.000 |
1.200 |
|
|
|
202.400 |
188.900 |
575.300 |
|
|
|
|
|
|
|
3. |
Expenditure |
|
|
|
|
|
Increase/Decrease in Stock in Trade |
2.300 |
3.400 |
(7.900) |
|
|
Consumption of Raw Materials |
129.500 |
114.600 |
368.800 |
|
|
Staff Cost |
12.800 |
10.900 |
34.400 |
|
|
Other Expenditures |
39.100 |
39.900 |
114.600 |
|
4. |
Interest |
9.000 |
8.000 |
24.700 |
|
5. |
Depreciation and Amortization Expenses |
5.300 |
5.500 |
16.100 |
|
|
f) Total |
198.000 |
182.300 |
550.700 |
|
|
|
|
|
|
|
6. |
Profit
/ Loss Before Tax |
4.400 |
6.600 |
24.600 |
|
|
|
|
|
|
|
7. |
Provision for Taxation |
(0.900) |
(1.300) |
(4.900) |
|
8. |
Mat Tax Credit |
0.000 |
(1.700) |
(1.700) |
|
9. |
Add: Deferred Tax Assets |
(0.200) |
(0.700) |
(0.400) |
|
|
|
|
|
|
|
10. |
Net
Profit / Loss |
3.300 |
2.900 |
17.600 |
|
|
|
|
|
|
|
11. |
Paid-up Equity Share Capital (Face Value of Rs.10/- Each) |
51.200 |
51.200 |
51.200 |
|
|
|
|
|
|
|
12. |
Reserves Excluding Revaluation Reserve |
101.100 |
97.700 |
101.100 |
|
|
|
|
|
|
|
13. |
Earning Per Shares |
0.64 |
0.57 |
3.44 |
|
|
|
|
|
|
|
14. |
Non
Promoted |
|
|
|
|
|
-Number of Shares |
2302571 |
2302571 |
2302571 |
|
|
- Percentage of Shareholding |
41% |
41% |
41% |
|
|
|
|
|
|
|
15. |
Promoters
and Promoter Group Shareholding |
|
|
|
|
|
a)
Pledged/Encumbered |
|
|
|
|
|
- Number of Shares |
Nil |
Nil |
Nil |
|
|
- Percentage of Shares (as a % of the Total Shareholding
of promoter and promoter group) |
Nil |
Nil |
Nil |
|
|
- Percentage of Shares (as a % of the Total Share Capital
of the Company) |
Nil |
Nil |
Nil |
|
|
|
|
|
|
|
|
b)
Non Encumbered |
|
|
|
|
|
- Number of Shares |
2813729 |
2813729 |
2813729 |
|
|
- Percentage of Shares (as a % of the Total Shareholding
of Promoter and Promoter Group) |
100% |
100% |
100% |
|
|
- Percentage of Shares (as a % of the Total Share Capital
of the Company) |
59% |
59% |
59% |
NOTES
1. Above results were taken on record by its Board of Directors at the
meeting held on 15.02.2014.
2. Segment reporting as defined in accounting standard 17 is not applicable
to the Company
3. There were no complaints from investors outstanding at the beginning of
the quarter. The company received one complaint from the investors during the
qtr.
4. Results for the period ended December 31, 2013 have been received by the
auditors of company.
CMT REPORT (Corruption, Money Laundering & Terrorism]
The Public Notice information has been collected from various sources
including but not limited to: The Courts,
1] INFORMATION ON
DESIGNATED PARTY
No exist designating subject or any of its beneficial owners,
controlling shareholders or senior officers as terrorist or terrorist
organization or whom notice had been received that all financial transactions
involving their assets have been blocked or convicted, found guilty or against
whom a judgement or order had been entered in a proceedings for violating
money-laundering, anti-corruption or bribery or international economic or
anti-terrorism sanction laws or whose assets were seized, blocked, frozen or
ordered forfeited for violation of money laundering or international
anti-terrorism laws.
2] Court Declaration :
No exist to suggest that subject is or was
the subject of any formal or informal allegations, prosecutions or other
official proceeding for making any prohibited payments or other improper
payments to government officials for engaging in prohibited transactions or
with designated parties.
3] Asset Declaration :
No records exist to suggest that the property or assets of the subject
are derived from criminal conduct or a prohibited transaction.
4] Record on Financial
Crime :
Charges or conviction
registered against subject: None
5] Records on Violation of
Anti-Corruption Laws :
Charges or
investigation registered against subject: None
6] Records on Int’l
Anti-Money Laundering Laws/Standards :
Charges or
investigation registered against subject: None
7] Criminal Records
No
available information exist that suggest that subject or any of its principals
have been formally charged or convicted by a competent governmental authority
for any financial crime or under any formal investigation by a competent
government authority for any violation of anti-corruption laws or international
anti-money laundering laws or standard.
8] Affiliation with
Government :
No record
exists to suggest that any director or indirect owners, controlling
shareholders, director, officer or employee of the company is a government
official or a family member or close business associate of a Government
official.
9] Compensation Package :
Our market
survey revealed that the amount of compensation sought by the subject is fair
and reasonable and comparable to compensation paid to others for similar
services.
10] Press Report :
No press reports / filings exists on
the subject.
CORPORATE GOVERNANCE
MIRA INFORM as part of its Due Diligence do provide comments on
Corporate Governance to identify management and governance. These factors often
have been predictive and in some cases have created vulnerabilities to credit
deterioration.
Our Governance Assessment focuses principally on the interactions
between a company’s management, its Board of Directors, Shareholders and other
financial stakeholders.
CONTRAVENTION
Subject is not known to have contravened any existing local laws,
regulations or policies that prohibit, restrict or otherwise affect the terms
and conditions that could be included in the agreement with the subject.
FOREIGN EXCHANGE RATES
|
Currency |
Unit
|
Indian Rupees |
|
US Dollar |
1 |
Rs.61.09 |
|
|
1 |
Rs.101.59 |
|
Euro |
1 |
Rs.84.65 |
INFORMATION DETAILS
|
Information
Gathered by : |
PLK |
|
|
|
|
Report Prepared
by : |
NTH |
SCORE & RATING EXPLANATIONS
|
SCORE FACTORS |
RANGE |
POINTS |
|
HISTORY |
1~10 |
5 |
|
PAID-UP CAPITAL |
1~10 |
5 |
|
OPERATING SCALE |
1~10 |
5 |
|
FINANCIAL CONDITION |
|
|
|
--BUSINESS SCALE |
1~10 |
5 |
|
--PROFITABILIRY |
1~10 |
5 |
|
--LIQUIDITY |
1~10 |
4 |
|
--LEVERAGE |
1~10 |
4 |
|
--RESERVES |
1~10 |
5 |
|
--CREDIT LINES |
1~10 |
4 |
|
--MARGINS |
-5~5 |
-- |
|
DEMERIT POINTS |
|
|
|
--BANK CHARGES |
YES/NO |
YES |
|
--LITIGATION |
YES/NO |
NO |
|
--OTHER ADVERSE INFORMATION |
YES/NO |
NO |
|
MERIT POINTS |
|
|
|
--SOLE DISTRIBUTORSHIP |
YES/NO |
NO |
|
--EXPORT ACTIVITIES |
YES/NO |
YES |
|
--AFFILIATION |
YES/NO |
YES |
|
--LISTED |
YES/NO |
YES |
|
--OTHER MERIT FACTORS |
YES/NO |
YES |
|
DEFAULTER |
|
|
|
--RBI |
YES/NO |
NO |
|
--EPF |
YES/NO |
NO |
|
TOTAL |
|
42 |
This score serves as a reference to assess SC’s credit risk
and to set the amount of credit to be extended. It is calculated from a
composite of weighted scores obtained from each of the major sections of this
report. The assessed factors and their relative weights (as indicated through
%) are as follows:
Financial
condition (40%) Ownership
background (20%) Payment
record (10%)
Credit history
(10%) Market trend
(10%) Operational
size (10%)
RATING EXPLANATIONS
|
RATING |
STATUS |
PROPOSED CREDIT LINE |
|
|
>86 |
Aaa |
Possesses an extremely sound financial base with the strongest
capability for timely payment of interest and principal sums |
Unlimited |
|
71-85 |
Aa |
Possesses adequate working capital. No caution needed for credit
transaction. It has above average (strong) capability for payment of interest
and principal sums |
Large |
|
56-70 |
A |
Financial & operational base are regarded healthy. General
unfavourable factors will not cause fatal effect. Satisfactory capability for
payment of interest and principal sums |
Fairly Large |
|
41-55 |
Ba |
Overall operation is considered normal. Capable to meet normal
commitments. |
Satisfactory |
|
26-40 |
B |
Capability to overcome financial difficulties seems comparatively below
average. |
Small |
|
11-25 |
Ca |
Adverse factors are apparent. Repayment of interest and principal sums
in default or expected to be in default upon maturity |
Limited with
full security |
|
<10 |
C |
Absolute credit risk exists. Caution needed to be exercised |
Credit not
recommended |
|
-- |
NB |
New Business |
-- |
This report is issued at your request without any
risk and responsibility on the part of MIRA INFORM PRIVATE LIMITED (MIPL) or
its officials.