MIRA INFORM REPORT
|
Report Date : |
02.05.2014 |
IDENTIFICATION DETAILS
|
Name : |
GOOD LUCK STEEL TUBES LIMITED |
|
|
|
|
Registered
Office : |
5/102, Sikka Complex, 1st Floor, Community Centre, Preet
Vihar, Vikas Marg, |
|
|
|
|
Country : |
India |
|
|
|
|
Financials (as
on) : |
31.03.2013 |
|
|
|
|
Date of
Incorporation : |
06.11.1986 |
|
|
|
|
Com. Reg. No.: |
55-050910 |
|
|
|
|
Capital
Investment / Paid-up Capital : |
Rs. 37.443 millions |
|
|
|
|
CIN No.: [Company Identification
No.] |
L74899DL1986PLC050910 |
|
|
|
|
TAN No.: [Tax Deduction &
Collection Account No.] |
MRTG00350A |
|
|
|
|
PAN No.: [Permanent Account No.] |
AAACG3204D |
|
|
|
|
Legal Form : |
A Public Limited Liability Company. The Company’s Shares are Listed on
the Stock Exchanges. |
|
|
|
|
Line of Business
: |
Subject is
engaged in the Manufacturing of Black and G.I. Pipe, C.R. Sheet / Coil,
G.P.G.C. Sheet / Coil, C.R.C.A. Sheet / Coil, Structures, Poles, Stainless /
Mild / Alloy steel forgings and flanges, Bright Bars, ERW Tube and CDW Tubes,
etc. |
|
|
|
|
No. of Employees
: |
Information denied by the management. |
RATING & COMMENTS
|
MIRA’s Rating : |
Ba (49) |
|
RATING |
STATUS |
PROPOSED CREDIT LINE |
|
|
41-55 |
Ba |
Overall operation is considered normal. Capable to meet normal
commitments. |
Satisfactory |
|
Maximum Credit Limit : |
USD 4751000 |
|
|
|
|
Status : |
Satisfactory |
|
|
|
|
Payment Behaviour : |
Regular |
|
|
|
|
Litigation : |
Clear |
|
|
|
|
Comments : |
Subject is an established company having satisfactory track record.
Performance capacity of the company seems to be good. Trade relation reported
to be fair. Business is active. Payment terms are reported to be regular and
as per commitments. The company can be considered for business dealing at usual trade
terms and conditions. |
NOTES :
Any query related to this report can be made
on e-mail : infodept@mirainform.com
while quoting report number, name and date.
ECGC Country Risk Classification List – March 31, 2014
|
Country Name |
Previous Rating (31.12.2013) |
Current Rating (31.03.2014) |
|
India |
A1 |
A1 |
|
Risk Category |
ECGC
Classification |
|
Insignificant |
A1 |
|
Low |
A2 |
|
Moderate |
B1 |
|
High |
B2 |
|
Very High |
C1 |
|
Restricted |
C2 |
|
Off-credit |
D |
INDIAN ECONOMIC OVERVIEW
US investment bank
Goldman Sachs has upgraded its outlook on Indian markets as it expects
positive impact of the election cycle.
India’s economy may
grow 4.7 % in the current financial year, lower than the official estimate of
4.9 %, Fitch Rating said. The global rating agency expects the economy to pick
up in the next two financial years.
Global ratings
agency Standard & Poor said increasing focus by India Inc on lowering debt
is likely to improve their credit profiles.
Singapore (1.1
million Indian tourists in 2012), Thailand (one million), the United Arab
Emirates ().98 million) and Malaysia ().82 million) emerged as the preferred
holidays hotspots for Indians. The total figure is expected to increase to 1.93
million by 2017, according to the latest Eurmonitor international report.
There is a $29.34 bn
outward foreign direct investment by domestic companies between April and
January of 2013/14 which has seen some signs of recovery according to a Care
Ratings report.
There are 264 number
of new companies being set up every day on average during 2014. Most of them
are registered in Mumbai. India had 1.38 million registered companies at the
end of January, 2014.
Twitter like
messaging service Weibo Corporation has filed to raise $ 500 million via a US
initial public offering. Alibaba, which owns a stake in Weibo is expected to
raise about $ 15 billion New York this year in the highest profile Internet IPO
since Facebook’s in 2012.
Bharti Airtel has
raised Rs.2,453.2 crore (350 million Swiss Francs) by selling six-year bonds at
a coupon rate of three per cent and maturing in 2020. This is the largest ever
bond offering by an Indian company in Swiss Francs. Bharat Petroleum
Corporation raised 175 million Swiss Francs by selling five year bonds at 2.98
% coupon rate in February.
Indian Oil
Corporation plans to invest Rs 7650 crore in setting up a petrochemical complex
at its almost complete Paradip refinery in Odhisha in three to four years. The
company board is set to consider the setting up of a 700000 tonne per annum
polypropylene plant at an estimated cost at Rs.3150 crore.
Global chief
information officers at gathering in Bangalore in April to meet Indian startups
at an event called Tech50 Watchout for Little Eye Labs-Facebook type deals in
the making.
EXTERNAL AGENCY RATING
|
Rating Agency Name |
ICRA |
|
Rating |
BBB [Term Loan] |
|
Rating Explanation |
Moderate credit quality and average credit risk. |
|
Date |
January 2014 |
|
Rating Agency Name |
ICRA |
|
Rating |
A3+ [Non Fund Based Limits] |
|
Rating Explanation |
Moderate degree of safety and higher credit risk. |
|
Date |
January 2014 |
RBI DEFAULTERS’ LIST STATUS
Subject’s name is not enlisted as a defaulter
in the publicly available RBI Defaulters’ list.
EPF (Employee Provident Fund) DEFAULTERS’ LIST STATUS
Subject’s name is not enlisted as a defaulter
in the publicly available EPF (Employee Provident Fund) Defaulters’ list as of
31-03-2012.
INFORMATION DECLINED BY
|
Name : |
Mr. Deepak Sharma |
|
Designation : |
Deputy General Manager in Finance |
|
Contact No.: |
91-120-4196600 |
|
Date : |
29.04.2014 |
LOCATIONS
|
Registered Office : |
5/102, Sikka Complex, 1st Floor, Community Centre, Preet
Vihar, Vikas Marg, |
|
Tel. No.: |
91-11-22465439 |
|
Fax No.: |
91-11-22214254 |
|
E-Mail : |
|
|
Website : |
|
|
|
|
|
Corporate Office : |
II F 166-167, Good Luck House, Nehru Nagar, |
|
Tel. No.: |
91-120-4196600 / 4196700 |
|
Fax No.: |
91-120-4196666 / 4196777 |
|
Email: |
|
|
|
|
|
Factory 1 : |
A-42 and 45, Industrial
Area, Sikandrabad, District Bulandshahr - 203205 |
|
Tel. No.: |
91-5735-221969 / 221970 |
|
Fax No.: |
91-5735-222863 |
|
|
|
|
Factory 2 : |
A-51, Industrial Area, Sikandrabad, District Bulandhahar-203205,
Uttar Pradesh, India |
|
Tel. No.: |
91-5735-221017 |
|
|
|
|
Factory 3 : |
Khsra No. 2839, Dhoom Manik Pur, G.T. Road, Gautam Budh
Nagar, Dadri, Uttar Pradesh, India |
|
Tel. No.: |
91-120-2666896 |
|
|
|
DIRECTORS
AS ON 31.03.2013
|
Name : |
Mr. Mahesh Chandra Garg |
||||||||||||||||||||||||||||||||||||||||||||||||||||||
|
Designation : |
Director |
||||||||||||||||||||||||||||||||||||||||||||||||||||||
|
Address : |
R-4/52, Raj Nagar, |
||||||||||||||||||||||||||||||||||||||||||||||||||||||
|
Date of Birth/Age : |
28.06.1946 |
||||||||||||||||||||||||||||||||||||||||||||||||||||||
|
Date of Appointment : |
06.11.1986 |
||||||||||||||||||||||||||||||||||||||||||||||||||||||
|
DIN : |
00292437 |
||||||||||||||||||||||||||||||||||||||||||||||||||||||
|
Other
Directorship:
|
|||||||||||||||||||||||||||||||||||||||||||||||||||||||
|
|
|
||||||||||||||||||||||||||||||||||||||||||||||||||||||
|
Name : |
Mr. Ramesh Chandra Garg |
||||||||||||||||||||||||||||||||||||||||||||||||||||||
|
Designation : |
Director |
||||||||||||||||||||||||||||||||||||||||||||||||||||||
|
Address : |
10/159, Raj Nagar, Sector - 10, |
||||||||||||||||||||||||||||||||||||||||||||||||||||||
|
Date of Birth/Age : |
15.07.1946 |
||||||||||||||||||||||||||||||||||||||||||||||||||||||
|
Date of Appointment : |
12.09.1988 |
||||||||||||||||||||||||||||||||||||||||||||||||||||||
|
DIN : |
00298129 |
||||||||||||||||||||||||||||||||||||||||||||||||||||||
|
Other
Directorship:
|
|||||||||||||||||||||||||||||||||||||||||||||||||||||||
|
|
|
||||||||||||||||||||||||||||||||||||||||||||||||||||||
|
Name : |
Mr. Vijender Kumar Tyagi |
||||||||||||||||||||||||||||||||||||||||||||||||||||||
|
Designation : |
Director |
||||||||||||||||||||||||||||||||||||||||||||||||||||||
|
Address : |
K 36 Hig, Niti Nagar, Sector - 23, |
||||||||||||||||||||||||||||||||||||||||||||||||||||||
|
Date of Birth/Age : |
05.10.1957 |
||||||||||||||||||||||||||||||||||||||||||||||||||||||
|
Date of Appointment : |
19.12.2006 |
||||||||||||||||||||||||||||||||||||||||||||||||||||||
|
DIN : |
01584278 |
||||||||||||||||||||||||||||||||||||||||||||||||||||||
|
|
|
||||||||||||||||||||||||||||||||||||||||||||||||||||||
|
Name : |
Mr. Rahul Goel |
||||||||||||||||||||||||||||||||||||||||||||||||||||||
|
Designation : |
Director |
||||||||||||||||||||||||||||||||||||||||||||||||||||||
|
Address : |
Ke 93, Kavi Nagar, |
||||||||||||||||||||||||||||||||||||||||||||||||||||||
|
Date of Birth/Age : |
14.09.1972 |
||||||||||||||||||||||||||||||||||||||||||||||||||||||
|
Date of Appointment : |
19.12.2006 |
||||||||||||||||||||||||||||||||||||||||||||||||||||||
|
DIN : |
02067212 |
||||||||||||||||||||||||||||||||||||||||||||||||||||||
|
|
|
||||||||||||||||||||||||||||||||||||||||||||||||||||||
|
Name : |
Mr. Anurag Agarwal |
||||||||||||||||||||||||||||||||||||||||||||||||||||||
|
Designation : |
Director |
||||||||||||||||||||||||||||||||||||||||||||||||||||||
|
Address : |
Om Kunj, Chiranji Colony, Dadri,Gautam Budha Nagar, |
||||||||||||||||||||||||||||||||||||||||||||||||||||||
|
Date of Birth/Age : |
12.02.1982 |
||||||||||||||||||||||||||||||||||||||||||||||||||||||
|
Date of Appointment : |
19.12.2006 |
||||||||||||||||||||||||||||||||||||||||||||||||||||||
|
DIN : |
01584222 |
||||||||||||||||||||||||||||||||||||||||||||||||||||||
|
|
|
||||||||||||||||||||||||||||||||||||||||||||||||||||||
|
Name : |
Mr. Nitin Garg |
||||||||||||||||||||||||||||||||||||||||||||||||||||||
|
Designation : |
Director |
||||||||||||||||||||||||||||||||||||||||||||||||||||||
|
Date of Birth/Age : |
31.05.1980 |
||||||||||||||||||||||||||||||||||||||||||||||||||||||
|
Date of Appointment : |
21.09.2012 |
||||||||||||||||||||||||||||||||||||||||||||||||||||||
KEY EXECUTIVES
|
Name : |
Mr. Abhishek Agrawal |
|
Designation : |
Company Secretary |
|
|
|
|
Name : |
Mr. Deepak Sharma |
|
Designation : |
Deputy General Manager in Finance |
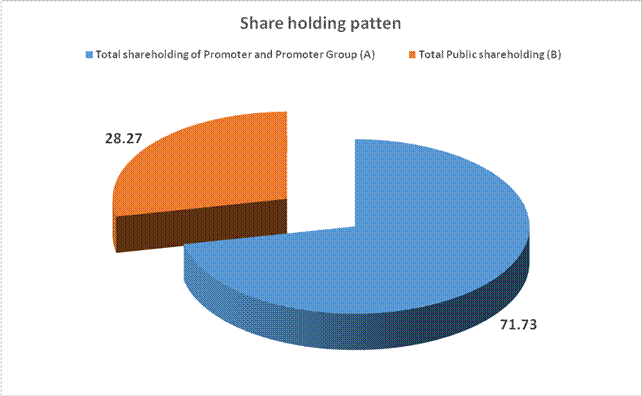
MAJOR SHAREHOLDERS / SHAREHOLDING PATTERN
AS ON 31.12.2013
|
Category of Shareholder |
Total No. of Shares |
Total Shareholding as a % of Total No. of Shares |
|
(A) Shareholding of Promoter and Promoter Group |
|
|
|
|
|
|
|
|
13428615 |
71.73 |
|
|
13428615 |
71.73 |
|
|
|
|
|
Total shareholding of Promoter and Promoter Group (A) |
13428615 |
71.73 |
|
(B) Public Shareholding |
|
|
|
|
|
|
|
|
835680 |
4.46 |
|
|
835680 |
4.46 |
|
|
|
|
|
|
796945 |
4.26 |
|
|
|
|
|
|
2961644 |
15.82 |
|
|
445232 |
2.38 |
|
|
253134 |
1.35 |
|
|
33828 |
0.18 |
|
|
219306 |
1.17 |
|
|
4456955 |
23.81 |
|
Total Public shareholding (B) |
5292635 |
28.27 |
|
Total (A)+(B) |
18721250 |
100.00 |
|
(C) Shares held by Custodians and against which Depository Receipts
have been issued |
0 |
0.00 |
|
|
0 |
0.00 |
|
|
0 |
0.00 |
|
|
0 |
0.00 |
|
Total (A)+(B)+(C) |
18721250 |
0.00 |
BUSINESS DETAILS
|
Line of Business : |
Subject is
engaged in the Manufacturing of Black and G.I. Pipe, C.R. Sheet / Coil, G.P.G.C.
Sheet / Coil, C.R.C.A. Sheet / Coil, Structures, Poles, Stainless / Mild /
Alloy steel forgings and flanges, Bright Bars, ERW Tube and CDW Tubes, etc. |
GENERAL INFORMATION
|
No. of Employees : |
Information denied by the management. |
||||||||||||||||||||||||
|
|
|
||||||||||||||||||||||||
|
Bankers : |
|
||||||||||||||||||||||||
|
|
|
||||||||||||||||||||||||
|
Facilities : |
|
|
|
|
|
Banking
Relations : |
-- |
|
|
|
|
Auditors : |
|
|
Name : |
Sanjeev Anand and Associates Chartered Accountants |
|
Address : |
77, Navyug Market, |
|
PAN No: |
AAPFS7604B |
|
|
|
|
Associates : |
Masterji Metalloys Private Limited |
CAPITAL STRUCTURE
AS ON 31.03.2013
Authorised Capital :
|
No. of Shares |
Type |
Value |
Amount |
|
50000000 |
Equity Shares |
Rs.2/- each |
Rs.100.000 Millions |
Issued, Subscribed & Paid-up Capital :
|
No. of Shares |
Type |
Value |
Amount |
|
18721250 |
Equity Shares |
Rs.2/- each |
Rs.37.443
Millions |
FINANCIAL DATA
[all figures are
in Rupees Millions]
ABRIDGED BALANCE
SHEET
|
SOURCES
OF FUNDS |
31.03.2013 |
31.03.2012 |
31.03.2011 |
|
I.
EQUITY AND LIABILITIES |
|
|
|
|
(1)Shareholders' Funds |
|
|
|
|
(a) Share Capital |
37.443 |
37.443 |
37.443 |
|
(b) Reserves & Surplus |
1150.532 |
940.698 |
749.104 |
|
(c) Money
received against share warrants |
0.000 |
0.000 |
0.000 |
|
|
|
|
|
|
(2)
Share Application money pending allotment |
0.000 |
0.000 |
0.000 |
|
Total Shareholders’ Funds (1) + (2) |
1187.975 |
978.141 |
786.547 |
|
|
|
|
|
|
(3)
Non-Current Liabilities |
|
|
|
|
(a)
long-term borrowings |
433.572 |
418.412 |
125.845 |
|
(b) Deferred tax
liabilities (Net) |
118.586 |
82.806 |
66.326 |
|
(c)
Other long term liabilities |
0.000 |
0.000 |
0.000 |
|
(d)
long-term provisions |
6.046 |
3.887 |
2.981 |
|
Total
Non-current Liabilities (3) |
558.204 |
505.105 |
195.152 |
|
|
|
|
|
|
(4) Current Liabilities |
|
|
|
|
(a)
Short term borrowings |
2190.818 |
1856.840 |
1384.084 |
|
(b)
Trade payables |
413.356 |
187.268 |
46.805 |
|
(c)
Other current liabilities |
259.941 |
174.590 |
184.663 |
|
(d)
Short-term provisions |
83.084 |
95.856 |
76.391 |
|
Total
Current Liabilities (4) |
2947.199 |
2314.554 |
1691.943 |
|
|
|
|
|
|
TOTAL |
4693.378 |
3797.800 |
2673.642 |
|
|
|
|
|
|
II.
ASSETS |
|
|
|
|
(1) Non-current assets |
|
|
|
|
(a)
Fixed Assets |
|
|
|
|
(i)
Tangible assets |
1165.897 |
799.016 |
632.660 |
|
(ii)
Intangible Assets |
0.000 |
0.000 |
0.000 |
|
(iii)
Capital work-in-progress |
2.272 |
167.962 |
5.083 |
|
(iv) Intangible assets under
development |
0.000 |
0.000 |
0.000 |
|
(b)
Non-current Investments |
21.461 |
0.000 |
0.000 |
|
(c)
Deferred tax assets (net) |
0.000 |
0.000 |
0.000 |
|
(d) Long-term Loan and Advances |
69.660 |
87.431 |
34.750 |
|
(e)
Other Non-current assets |
0.000 |
0.000 |
0.000 |
|
Total
Non-Current Assets |
1259.290 |
1054.409 |
672.493 |
|
|
|
|
|
|
(2) Current assets |
|
|
|
|
(a)
Current investments |
0.000 |
0.000 |
0.515 |
|
(b)
Inventories |
1155.044 |
1024.516 |
670.276 |
|
(c)
Trade receivables |
1831.768 |
1315.757 |
951.644 |
|
(d)
Cash and cash equivalents |
65.435 |
56.904 |
88.696 |
|
(e)
Short-term loans and advances |
381.841 |
346.214 |
290.018 |
|
(f)
Other current assets |
0.000 |
0.000 |
0.000 |
|
Total
Current Assets |
3434.088 |
2743.391 |
2001.149 |
|
|
|
|
|
|
TOTAL |
4693.378 |
3797.800 |
2673.642 |
PROFIT & LOSS
ACCOUNT
|
|
PARTICULARS |
31.03.2013 |
31.03.2012 |
31.03.2011 |
|
|
|
SALES |
|
|
|
|
|
|
|
Income |
9532.435 |
6790.480 |
5608.190 |
|
|
|
Other Income |
241.202 |
144.361 |
121.984 |
|
|
|
TOTAL (A) |
9773.637 |
6934.841 |
5730.174 |
|
|
|
|
|
|
|
|
Less |
EXPENSES |
|
|
|
|
|
|
|
Cost of Raw Materials Consumed |
7256.804 |
5398.826 |
4416.454 |
|
|
|
Purchase of Stock-in-Trade |
295.580 |
3.201 |
5.940 |
|
|
|
Employee Benefit Expenses |
295.911 |
232.994 |
180.582 |
|
|
|
Other Expenses |
1320.889 |
898.625 |
738.854 |
|
|
|
Prior Period Items |
(1.551) |
5.949 |
17.492 |
|
|
|
Changes in
Inventories of Finished Goods Stock-in-Process and Stock-in-Trade |
(138.162) |
(129.897) |
(19.872) |
|
|
|
TOTAL (B) |
9029.471 |
6409.698 |
5339.450 |
|
|
|
|
|
|
|
|
Less |
PROFIT
/ (LOSS) BEFORE INTEREST, TAX, DEPRECIATION AND AMORTISATION (A-B) (C) |
744.166 |
525.143 |
390.724 |
|
|
|
|
|
|
|
|
|
Less |
FINANCIAL
EXPENSES (D) |
344.088 |
192.125 |
126.676 |
|
|
|
|
|
|
|
|
|
|
PROFIT
/ (LOSS) BEFORE TAX, DEPRECIATION AND AMORTISATION (C-D) (E) |
400.078 |
333.018 |
264.048 |
|
|
|
|
|
|
|
|
|
Less/ Add |
DEPRECIATION/
AMORTISATION (F) |
70.552 |
52.143 |
40.733 |
|
|
|
|
|
|
|
|
|
|
PROFIT / (LOSS)
BEFORE TAX (E-F) (G) |
329.526 |
280.875 |
223.315 |
|
|
|
|
|
|
|
|
|
Less |
TAX (H) |
110.102 |
79.751 |
75.808 |
|
|
|
|
|
|
|
|
|
|
PROFIT / (LOSS)
AFTER TAX (G-H) (I) |
219.424 |
201.124 |
147.507 |
|
|
|
|
|
|
|
|
|
Add |
PREVIOUS
YEARS’ BALANCE BROUGHT FORWARD |
734.094 |
581.673 |
470.693 |
|
|
|
|
|
|
|
|
|
Less |
APPROPRIATIONS |
|
|
|
|
|
|
|
Transfer to General Reserve |
40.000 |
40.000 |
30.000 |
|
|
|
Proposed Dividend |
7.489 |
7.489 |
5.616 |
|
|
|
Dividend Tax |
1.273 |
1.215 |
0.911 |
|
|
BALANCE CARRIED
TO THE B/S |
904.756 |
734.093 |
581.673 |
|
|
|
|
|
|
|
|
|
|
EARNINGS IN
FOREIGN CURRENCY |
|
|
|
|
|
|
|
FOB Value of Exports |
3525.019 |
1834.265 |
1590.775 |
|
|
|
|
|
|
|
|
|
IMPORTS |
|
|
|
|
|
|
|
Raw Materials |
0.000 |
4.147 |
81.409 |
|
|
|
Stores & Spares |
0.387 |
0.083 |
0.355 |
|
|
|
Capital Goods |
16.129 |
1.754 |
1.002 |
|
|
TOTAL IMPORTS |
16.516 |
5.984 |
82.766 |
|
|
|
|
|
|
|
|
|
|
Earnings /
(Loss) Per Share (Rs.) |
11.72 |
10.74 |
7.88 |
|
QUARTERLY RESULTS
|
PARTICULARS |
|
30.06.2013 |
30.09.2013 |
|
Type |
|
1st
Quarter |
2nd
Quarter |
|
Net Sales |
|
2637.800 |
2476.000 |
|
Total Expenditure |
|
2439.000 |
2278.700 |
|
PBIDT (Excl OI) |
|
198.800 |
197.300 |
|
Other Income |
|
01.900 |
01.600 |
|
Operating Profit |
|
200.800 |
198.800 |
|
Interest |
|
87.100 |
88.000 |
|
Exceptional Items |
|
0.000 |
0.000 |
|
PBDT |
|
113.700 |
110.900 |
|
Depreciation |
|
17.700 |
18.300 |
|
Profit Before Tax |
|
96.000 |
92.500 |
|
Tax |
|
31.000 |
32.000 |
|
Provisions and contingencies |
|
0.000 |
0.000 |
|
Profit After Tax |
|
65.000 |
60.500 |
|
Extraordinary Items |
|
0.000 |
0.000 |
|
Prior Period Expenses |
|
(0.200) |
0.000 |
|
Other Adjustments |
|
0.000 |
0.000 |
|
Net Profit |
|
64.800 |
60.500 |
KEY RATIOS
|
PARTICULARS |
|
31.03.2013 |
31.03.2012 |
31.03.2011 |
|
PAT / Total Income |
(%) |
2.25
|
2.90 |
2.57 |
|
|
|
|
|
|
|
Net Profit Margin (PBT/Sales) |
(%) |
3.45
|
4.14 |
3.98 |
|
|
|
|
|
|
|
Return on Total Assets (PBT/Total Assets} |
(%) |
7.05
|
7.74 |
8.37 |
|
|
|
|
|
|
|
Return on Investment (ROI) (PBT/Networth) |
|
0.27
|
0.29 |
0.28 |
|
|
|
|
|
|
|
Debt Equity Ratio (Total Debt/Networth) |
|
2.21
|
2.33 |
1.92 |
|
|
|
|
|
|
|
Current Ratio (Current Asset/Current Liability) |
|
1.17
|
1.19 |
1.18 |
FINANCIAL ANALYSIS
[all figures are
in Rupees Millions]
DEBT EQUITY RATIO
|
Particular |
31.03.2011 |
31.03.2012 |
31.03.2013 |
|
|
(Rs. In Millions) |
(Rs. In Millions) |
(Rs. In Millions) |
|
Share Capital |
37.443 |
37.443 |
37.443 |
|
Reserves & Surplus |
749.104 |
940.698 |
1150.532 |
|
Net worth |
786.547 |
978.141 |
1187.975 |
|
|
|
|
|
|
long-term borrowings |
125.845 |
418.412 |
433.572 |
|
Short term borrowings |
1384.084 |
1856.840 |
2190.818 |
|
Total borrowings |
1509.929 |
2275.252 |
2624.390 |
|
Debt/Equity ratio |
1.920 |
2.326 |
2.209 |

YEAR-ON-YEAR GROWTH
|
Year on Year Growth |
31.03.2011 |
31.03.2012 |
31.03.2013 |
|
|
(Rs. In Millions) |
(Rs. In Millions) |
(Rs. In Millions) |
|
Sales |
5608.190 |
6790.480 |
9532.435 |
|
|
|
21.081 |
40.379 |

NET PROFIT MARGIN
|
Net Profit Margin |
31.03.2011 |
31.03.2012 |
31.03.2013 |
|
|
(Rs. In Millions) |
(Rs. In Millions) |
(Rs. In Millions) |
|
Sales |
5608.190 |
6790.480 |
9532.435 |
|
Profit |
147.507 |
201.124 |
219.424 |
|
|
2.63% |
2.96% |
2.30% |
LOCAL AGENCY FURTHER INFORMATION
|
Sr. No. |
Check List by
Info Agents |
Available in
Report (Yes / No) |
|
1] |
Year of Establishment |
Yes |
|
2] |
Locality of the firm |
Yes |
|
3] |
Constitutions of the firm |
Yes |
|
4] |
Premises details |
No |
|
5] |
Type of Business |
Yes |
|
6] |
Line of Business |
Yes |
|
7] |
Promoter's background |
Yes |
|
8] |
No. of employees |
No |
|
9] |
Name of person contacted |
Yes |
|
10] |
Designation of contact person |
Yes |
|
11] |
Turnover of firm for last three years |
Yes |
|
12] |
Profitability for last three years |
Yes |
|
13] |
Reasons for variation <> 20% |
-- |
|
14] |
Estimation for coming financial year |
No |
|
15] |
Capital in the business |
Yes |
|
16] |
Details of sister concerns |
Yes |
|
17] |
Major suppliers |
No |
|
18] |
Major customers |
No |
|
19] |
Payments terms |
No |
|
20] |
Export / Import details (if applicable) |
No |
|
21] |
Market information |
-- |
|
22] |
Litigations that the firm / promoter involved in |
-- |
|
23] |
Banking Details |
Yes |
|
24] |
Banking facility details |
Yes |
|
25] |
Conduct of the banking account |
-- |
|
26] |
Buyer visit details |
-- |
|
27] |
Financials, if provided |
Yes |
|
28] |
Incorporation details, if applicable |
Yes |
|
29] |
Last accounts filed at ROC |
Yes |
|
30] |
Major Shareholders, if available |
No |
|
31] |
PAN of Proprietor/Partner/Director, if available |
No |
|
32] |
Date
of Birth of Proprietor/Partner/Director, if available |
Yes |
|
33] |
Voter ID No of Proprietor/Partner/Director, if available |
No |
|
34] |
External Agency Rating, if available |
Yes |
INDEX OF CHARGES:
|
S. No. |
Charge ID |
Date of Charge Creation/Modification |
Charge amount
secured |
Charge Holder |
Address |
Service Request
Number (SRN) |
|
1 |
10034338 |
18/12/2006 |
232,400,000.00 |
UNION BANK OF
INDIA |
OVERSEAS BRANCH,
CONNAUGHT PLACE, NEW DELHI - 110001, INDIA |
A09634932 |
|
Unsecured Loan |
As
on 31.03.2013 [Rs.
in Millions] |
As
on 31.03.2012 [Rs.
in Millions] |
|
Long Term
Borrowings |
|
|
|
From Related Parties |
92.313 |
117.308 |
|
From Body Corporate |
17.900 |
32.500 |
|
TOTAL
|
110.213 |
149.808 |
COMPANY OVERVIEW:
Subject is engaged
in the manufacturing of Black and G.I. Pipe, C.R. Sheet / Coil, G.P.G.C. Sheet
/ Coil, C.R.C.A. Sheet / Coil, Structures, Poles, Stainless / Mild / Alloy
steel forgings and flanges, Bright Bars, ERW Tube and CDW Tubes, etc.
COMPANY'S
PERFORMANCE:
In spite of
sluggish demand and pricing pressure, with the crossing of Rs.10000.000
Millions as its gross turnover the company has achieved a mile stone. The total
turnover of the company has increased by 41.35% over the last year figure of
Rs.7420.000 Millions The Company is continued to perform outstanding in its
international business also and has posted export turnover of Rs.3673.000
Millions which constitute around 37% of the total turnover for the FY 2012-13.
The company has made a whopping jump in it's overall performance. Its profit
before interest and taxes has reached to Rs. 672.000 Millions, in comparison of
Rs.473.000 Millions for the year 2011-12. The book value of equity share at the
end of the financial year 2012-13 has reached to Rs. 63.42 per share.
It is continuous
endeavor of the management that keeps the Company growing at an enormous pace
and in this direction, the management is planning to enter into some more value
added products and to modernize and augment its existing manufacturing
facility. Further, this year the Company has succeeded in entering into the
agreement with the GAIL (India) limited for continuous supply of RLNG gas
through pipe line for its two plants for the purpose of replacing its existing
fuel arrangement for manufacturing process. This new arrangement will
definitely helps the Company in counter the rising fuel bill and providing a
clean environment to the society. Though, the current agreement is a short term
agreement but the Company is hopeful that it will secure the uninterrupted
supply of gas in future also.
MANAGEMENT
DISCUSSION AND ANALYSIS:
INDUSTRY OVERVIEW:
Steel products are
classified into four broad categories: flat steel products, long steel products,
scrap and semi-finished products. Flat products include plates, hot-rolled
strip and sheets, and cold-rolled strip and sheets. The long steel products are
tubes, pipes, structure, wire rods, beams, forging products etc. The steel
industry is an economic indicator, as it plays a critical role in
infrastructure and overall economic development. However, despite its size, the
steel industry remains relatively fragmented is highly cyclical and intensely
competitive. After witnessing the sturdy growth for most of the initial phase
in the last decade, the steel industry suffered a setback due to the recession
in 2008 as consumers utilized existing inventories rather than buying new
stocks. The industry witnessed a slight turnaround in late 2009 and continued
to grow slowly thereafter. Demand for steel benefited from growth in the
developing economies that helped counter the sluggishness in developed
countries. Asia, particularly China, continued to be the principal growth
driver. But, the demand for steel products, nonetheless, remained below
pre-recession levels.
The automotive,
construction and natural oil and gas markets have been the largest consumers of
steel, consuming more than half of the total steel produced. In 2012-13, the
continuing Euro-zone sovereign debt crisis, economic stagnation or slow growth
in developed economies and a cooling of emerging market economies took a toll
on these industries. Growth in the Chinese economy, which in recent years has
been one of the main demand drivers for steel, slowed. These challenging
economic conditions continued to hinder the steel industry in the year
2013. So far as
the domestic steel industry is concerned, the year 2013 was not a good year for
it. The Indian steel industry could not be escaped from the global slowdown
impact and saw a subdued growth from the key consuming sectors. The limited
availability of iron ore also affected the industry adversely. The growth in
the steel industry remained muted in FY13, and somewhat lower than the 5.5%
growth recorded in FY 12.
The domestic steel
demand is likely to grow at a faster pace in comparison of world steel market
and is expected to grow at a rate of 6.7% annually till 2016-17. While the
demand for flat products in the domestic market is likely to be supported by
the automobiles, at a timid pace, demand for long products will continue to
increase on the back of modest growth in demand from the construction sector.
OUTLOOK:
In 2014, the steel
industry will continue to face headwinds in the form of overcapacity and surge
of imports. Global steel demand is expected to improve gradually in 2014
compared with 2013 levels. Growth in the United States will be supported by
strong momentum in the auto sector and recovery in construction markets.
Concerns surrounding China's growth and the European debt crisis remain
overhangs on the sector's outlook.
Efforts of the
Chinese government to rebalance its economy will contribute to the domestic and
global steel demand. Although China is the dominant market in the steel sector,
India is also increasing its presence, due to rise in its domestic steel
demand. The rising middle class population along with increased urbanization
will fuel steel demand in the future. But, overcapacity has been a perennial
problem. Stiff competition from cheaper imports and from domestic producers
with new or expanded facilities continues to result in a significant oversupply
of steel compared to demand. However, selling prices will improve hand-in-hand
with improved demand across most regions, due to higher raw material prices and
an end to the destocking that was observed during last years. In addition to
raw material prices, the sustainability of higher steel prices will continue to
depend on an increase in sustainable real demand, and no further worsening of
the Euro-zone debt crisis.
FIXED ASSETS:
- Land
- Furniture and
Fixture
- Plant and
Machinery
- Office
Equipments
- Electrical
Installation
- Vehicles
CMT REPORT (Corruption, Money Laundering & Terrorism]
The Public Notice information has been collected from various sources
including but not limited to: The Courts,
1] INFORMATION ON
DESIGNATED PARTY
No exist designating subject or any of its beneficial owners, controlling
shareholders or senior officers as terrorist or terrorist organization or whom
notice had been received that all financial transactions involving their assets
have been blocked or convicted, found guilty or against whom a judgement or
order had been entered in a proceedings for violating money-laundering,
anti-corruption or bribery or international economic or anti-terrorism sanction
laws or whose assets were seized, blocked, frozen or ordered forfeited for
violation of money laundering or international anti-terrorism laws.
2] Court Declaration :
No exist to suggest that subject is or was
the subject of any formal or informal allegations, prosecutions or other
official proceeding for making any prohibited payments or other improper payments
to government officials for engaging in prohibited transactions or with
designated parties.
3] Asset Declaration :
No records exist to suggest that the property or assets of the subject
are derived from criminal conduct or a prohibited transaction.
4] Record on Financial
Crime :
Charges or conviction
registered against subject: None
5] Records on Violation of
Anti-Corruption Laws :
Charges or
investigation registered against subject: None
6] Records on Int’l
Anti-Money Laundering Laws/Standards :
Charges or
investigation registered against subject: None
7] Criminal Records
No
available information exist that suggest that subject or any of its principals
have been formally charged or convicted by a competent governmental authority
for any financial crime or under any formal investigation by a competent
government authority for any violation of anti-corruption laws or international
anti-money laundering laws or standard.
8] Affiliation with
Government :
No record
exists to suggest that any director or indirect owners, controlling
shareholders, director, officer or employee of the company is a government
official or a family member or close business associate of a Government
official.
9] Compensation Package :
Our market
survey revealed that the amount of compensation sought by the subject is fair
and reasonable and comparable to compensation paid to others for similar
services.
10] Press Report :
No press reports / filings exists on
the subject.
CORPORATE GOVERNANCE
MIRA INFORM as part of its Due Diligence do provide comments on
Corporate Governance to identify management and governance. These factors often
have been predictive and in some cases have created vulnerabilities to credit
deterioration.
Our Governance Assessment focuses principally on the interactions
between a company’s management, its Board of Directors, Shareholders and other
financial stakeholders.
CONTRAVENTION
Subject is not known to have contravened any existing local laws, regulations
or policies that prohibit, restrict or otherwise affect the terms and
conditions that could be included in the agreement with the subject.
FOREIGN EXCHANGE RATES
|
Currency |
Unit
|
Indian Rupees |
|
US Dollar |
1 |
Rs.60.34 |
|
|
1 |
Rs.101.45 |
|
Euro |
1 |
Rs.83.31 |
INFORMATION DETAILS
|
Information
Gathered by : |
PRT |
|
|
|
|
Analysis Done by
: |
SUB |
|
|
|
|
Report Prepared
by : |
TPT |
SCORE & RATING EXPLANATIONS
|
SCORE FACTORS |
RANGE |
POINTS |
|
HISTORY |
1~10 |
6 |
|
PAID-UP CAPITAL |
1~10 |
5 |
|
OPERATING SCALE |
1~10 |
5 |
|
FINANCIAL CONDITION |
|
|
|
--BUSINESS SCALE |
1~10 |
6 |
|
--PROFITABILIRY |
1~10 |
5 |
|
--LIQUIDITY |
1~10 |
5 |
|
--LEVERAGE |
1~10 |
6 |
|
--RESERVES |
1~10 |
6 |
|
--CREDIT LINES |
1~10 |
5 |
|
--MARGINS |
-5~5 |
-- |
|
DEMERIT POINTS |
|
|
|
--BANK CHARGES |
YES/NO |
YES |
|
--LITIGATION |
YES/NO |
NO |
|
--OTHER ADVERSE INFORMATION |
YES/NO |
NO |
|
MERIT POINTS |
|
|
|
--SOLE DISTRIBUTORSHIP |
YES/NO |
NO |
|
--EXPORT ACTIVITIES |
YES/NO |
NO |
|
--AFFILIATION |
YES/NO |
YES |
|
--LISTED |
YES/NO |
YES |
|
--OTHER MERIT FACTORS |
YES/NO |
YES |
|
DEFAULTER |
|
|
|
--RBI |
YES/NO |
NO |
|
--EPF |
YES/NO |
NO |
|
TOTAL |
|
49 |
This score serves as a reference to assess SC’s
credit risk and to set the amount of credit to be extended. It is calculated
from a composite of weighted scores obtained from each of the major sections of
this report. The assessed factors and their relative weights (as indicated
through %) are as follows:
Financial
condition (40%) Ownership
background (20%) Payment
record (10%)
Credit history
(10%) Market trend (10%) Operational size
(10%)
RATING EXPLANATIONS
|
RATING |
STATUS |
PROPOSED CREDIT LINE |
|
|
>86 |
Aaa |
Possesses an extremely sound financial base with the strongest
capability for timely payment of interest and principal sums |
Unlimited |
|
71-85 |
Aa |
Possesses adequate working capital. No caution needed for credit transaction.
It has above average (strong) capability for payment of interest and
principal sums |
Large |
|
56-70 |
A |
Financial & operational base are regarded healthy. General
unfavourable factors will not cause fatal effect. Satisfactory capability for
payment of interest and principal sums |
Fairly Large |
|
41-55 |
Ba |
Overall operation is considered normal. Capable to meet normal
commitments. |
Satisfactory |
|
26-40 |
B |
Capability to overcome financial difficulties seems comparatively below
average. |
Small |
|
11-25 |
Ca |
Adverse factors are apparent. Repayment of interest and principal sums
in default or expected to be in default upon maturity |
Limited with
full security |
|
<10 |
C |
Absolute credit risk exists. Caution needed to be exercised |
Credit not
recommended |
|
-- |
NB |
New Business |
-- |
This report is issued at your request without any
risk and responsibility on the part of MIRA INFORM PRIVATE LIMITED (MIPL) or
its officials.