MIRA INFORM REPORT
|
Report Date : |
06.05.2014 |
IDENTIFICATION DETAILS
|
Name : |
BJC LOGISTICS
AND WAREHOUSE COMPANY
LIMITED |
|
|
|
|
Formerly Known as : |
BJC INTERNATIONAL COMPANY
LIMITED |
|
|
|
|
Registered Office : |
99 Birli Jucker
House Building, Soi Rubia,
Sukhumvit 42 Road, Prakanong,
Klongtoey, Bangkok 10110 |
|
|
|
|
Country : |
Thailand |
|
|
|
|
Financials (as on) : |
31.12.2012 |
|
|
|
|
Date of Incorporation : |
13.11.2007 |
|
|
|
|
Com. Reg. No.: |
0105550119268 |
|
|
|
|
Legal Form : |
Private
Limited Company |
|
|
|
|
Line of Business : |
engaged in
holding business and
investment in BJC
group of companies
and other companies
in overseas. |
|
|
|
|
No of Employees : |
12 |
RATING & COMMENTS
|
MIRA’s Rating : |
Ba |
|
RATING |
STATUS |
PROPOSED CREDIT LINE |
|
|
41-55 |
Ba |
Overall operation is considered normal. Capable to meet normal
commitments. |
Satisfactory |
|
Status : |
Satisfactory |
|
|
|
|
Payment Behaviour : |
No Complaints |
|
|
|
|
Litigation : |
Clear |
NOTES :
Any query related to this report can be made
on e-mail : infodept@mirainform.com
while quoting report number, name and date.
ECGC Country Risk Classification List – March 31, 2014
|
Country Name |
Previous Rating (31.12.2013) |
Current Rating (31.03.2014) |
|
Thailand |
B1 |
B1 |
|
Risk Category |
ECGC
Classification |
|
Insignificant |
A1 |
|
Low Risk |
A2 |
|
Moderate Low Risk |
B1 |
|
Moderate Risk |
B2 |
|
Moderate High Risk |
C1 |
|
High Risk |
C2 |
|
Very High Risk |
D |
Thailand ECONOMIC OVERVIEW
With a well-developed infrastructure,
a free-enterprise economy, generally pro-investment policies, and strong export
industries, Thailand achieved steady growth due largely to industrial and
agriculture exports - mostly electronics, agricultural commodities, automobiles
and parts, and processed foods. Unemployment, at less than 1% of the labor
force, stands as one of the lowest levels in the world, which puts upward
pressure on wages in some industries. Thailand also attracts nearly 2.5 million
migrant workers from neighboring countries. The Thai government is implementing
a nation-wide 300 baht ($10) per day minimum wage policy and deploying new tax
reforms designed to lower rates on middle-income earners. The Thai economy has
weathered internal and external economic shocks in recent years. The global
economic recession severely cut Thailand's exports, with most sectors
experiencing double-digit drops. In late 2011 Thailand's recovery was
interrupted by historic flooding in the industrial areas in Bangkok and its
five surrounding provinces, crippling the manufacturing sector. The government
approved flood mitigation projects worth $11.7 billion, which were started in
2012, to prevent similar economic damage, and an additional $75 billion for
infrastructure over the following seven years.
|
Source : CIA |
Company
name
BJC LOGISTICS
AND WAREHOUSE COMPANY
LIMITED
[FORMER :
BJC INTERNATIONAL COMPANY
LIMITED]
SUMMARY
BUSINESS
ADDRESS : 99
BIRLI JUCKER HOUSE
BUILDING, SOI RUBIA,
SUKHUMVIT 42
ROAD, PRAKANONG,
KLONGTOEY, BANGKOK
10110, THAILAND
TELEPHONE : [66] 2367-1111,
2367-1095
FAX :
[66] 2712-2240
E-MAIL
ADDRESS : p.romhild@bjc.co.th
REGISTRATION
ADDRESS : SAME
AS BUSINESS ADDRESS
ESTABLISHED
: 2007
REGISTRATION
NO. : 0105550119268
TAX
ID NO. : 3032861076
CAPITAL REGISTERED : BHT. 1,611,000,000
CAPITAL PAID-UP : BHT.
1,611,000,000
SHAREHOLDER’S PROPORTION : THAI :
100%
FISCAL YEAR CLOSING DATE : DECEMBER 31
LEGAL
STATUS : PRIVATE LIMITED
COMPANY
EXECUTIVE : MR. PETER EMIL
ROMHILD, BRITISH
CHIEF EXECUTIVE
OFFICER
NO.
OF STAFF : 12
LINES
OF BUSINESS : INTERNATIONAL HOLDING
AND INVESTMENT
COMPANY
CORPORATE
PROFILE
OPERATING
TREND : STABLE
PRESENT
SITUATION : OPERATING NORMALLY
REPUTATION : GOOD
WITH NORMAL BUSINESS
ENGAGEMENT
MANAGEMENT
STANDARD : MANAGEMENT WITH
GOOD PERFORMANCE
HISTORY
The
subject was established
on November 13,
2007 as a private
limited company under
the originally registered
name “BJC International
Company Limited”, by
Thai group, with
the business objective
to engage in
international holding and
investment in BJC
group in overseas.
On May 7,
2013, its registered
name was changed
to BJC LOGISTICS
AND WAREHOUSE CO.,
LTD. It currently
employs 12 staff.
The subject
is a wholly
owned subsidiary of
Berli Jucker Public
Company Limited.
The
subject’s registered address
is 99 Birli
Jucker House Building, Soi
Rubia, Sukhumvit 42 Road,
Prakanong, Klongtoey, Bangkok 10110, and
this is the
subject’s current operation
address.
THE BOARD
OF DIRECTOR
|
Name |
|
Nationality |
Age |
|
|
|
|
|
|
Mr. Aswin Techajareonvikul |
|
Thai |
38 |
|
Mrs. Thapanee Techajareonvikul |
|
Thai |
38 |
|
Mrs. Vipada Duangrat |
|
Thai |
59 |
|
Mr. Manus Manoonchai |
|
Thai |
59 |
|
Mr. Sithichai Chaikriangkrai |
|
Thai |
60 |
|
Mrs. Chaveewan Jantanapumma |
|
Thai |
67 |
|
Mr. Teerapol Kiatsuranon |
|
Thai |
56 |
|
Mr. Pattaphong Eiamsuro |
|
Thai |
55 |
|
Mr. Pisanu Pongwattana |
[-] |
Thai |
48 |
AUTHORIZED
PERSON
- Any two
of the above
directors can jointly
sign on behalf
of the subject
with
company’s affixed.
- In case
of contact with
government enterprise, the
mentioned director [-]
can sign on behalf
of the subject
with company’s affixed.
MANAGEMENT
Mr. Peter Emil Romhild
is the Chief
Executive Officer.
He is British
nationality.
Mrs. Suwicha Boonsupa is
the International Business
Department Manager.
She is Thai
nationality.
BUSINESS
OPERATIONS
The subject
is engaged in
holding business and
investment in BJC
group of companies
and other companies
in overseas.
SUBSIDIARY AND AFFILIATED
COMPANIES
Asia Books Co.,
Ltd.
Business Type :
Importer and distributor
of book and
magazine
Investment : The
subject holds 99.92%
of the company’s
shares.
BJIMK Company Limited
Business Type :
Trading business in
Hong Kong
Investment : The
subject holds 75%
of the company’s shares.
LITIGATION
Bankruptcy and
Receivership
There are no
litigation on bankruptcy
and receivership cases
filed against the
subject found at
Legal Execution Department
for the past
five years.
Others
There are no
legal suits filed
against the subject
for the past
two years.
CREDIT
Local bills are
paid by cash
or on the
credit term of
30 days.
BANKING
Bangkok
Bank Public Co.,
Ltd.
Kasikornbank
Public Co., Ltd.
EMPLOYMENT
The
subject currently employs
12 staff.
LOCATION
DETAILS
The
premise is rented
for administrative office
at the heading
address. Premise is
located in commercial/residential area.
Branches:
- BJC International [Hong Kong],
36th Floor, Times
Square Building II,
1 Matheson Street,
Causeway, Hong Kong.
- Vietnam Representative Office,
Fosco II, Block E,
E21, 40 Bahuyen
Thanh Quen
Street,
Hi Chi Minh
City, Vietnam
- Myanmar Representative Office, 39[KK],
Pho Sein street,
Bahan Township,
Yangon,
Myanmar
- Malaysia Representative Office
COMMENT
The
subject is a
holding and investment
company in BJC
group in overseas.
As a holding company,
the subject is
confident in an
improvement of its
business performance in long
term prospect.
FINANCIAL INFORMATION
The
capital was registered
at Bht. 100,000,000 divided
into 10,000,000 shares
of Bht. 10
each with fully
paid.
The
capital was increased
later as follows:
Bht. 1,300,000,000
on January 30,
2012
Bht. 1,495,000,000
on May 7,
2013
Bht. 1,611,000,000
on July 7,
2013
The
latest registered capital
was increased to
Bht. 1,611,000,000 divided
into 161,100,000 shares
of Bht. 10 each
with fully paid.
THE
SHAREHOLDERS LISTED WERE
: [as at
June 5, 2013]
|
NAME |
HOLDING |
% |
|
|
|
|
|
Berli Jucker Public
Company Limited Nationality: Thai Address : 99
Soi Rubia, Sukhumvit
42 Road,
Prakanong, Klongtoey, Bangkok |
161,099,998 |
100.00 |
|
BJC Healthcare Co.,
Ltd. Nationality: Thai Address : 99
Soi Rubia, Sukhumvit
42 Road,
Prakanong, Klongtoey, Bangkok
|
1 |
- |
|
Berli Jucker Foods
Co., Ltd. Nationality: Thai Address : 99
Soi Rubia, Sukhumvit
42 Road,
Prakanong, Klongtoey, Bangkok |
1 |
- |
Total Shareholders : 3
Share Structure [as
at June 5, 2013]
|
Nationality |
Shareholders |
No. of Share |
% Shares |
|
|
|
|
|
|
Thai |
3 |
161,100,000 |
100.00 |
|
Foreign |
- |
- |
- |
|
Total |
3 |
161,100,000 |
100.00 |
NAME OF AUDITOR
& CERTIFIED PUBLIC
ACCOUNTANT NO. :
Mr. Chavala Thienprasertkij No.
4301
BALANCE
SHEET [BAHT]
The
latest financial figures
published for December
31, 2012, 2011
& 2010 were:
ASSETS
|
Current Assets |
2012 |
2011 |
2010 |
|
|
|
|
|
|
Cash and Cash Equivalents |
1,188,522 |
767,143 |
1,295,813 |
|
Other Receivable - Related Company |
16,512,304 |
11,503,599 |
10,104,805 |
|
Short-term Loan to Related Company |
466,496,335 |
408,496,335 |
6,126,162 |
|
Other Current Assets
|
81,630 |
25,421 |
9,532 |
|
|
|
|
|
|
Total Current Assets
|
484,278,791 |
420,792,498 |
17,536,312 |
|
Investment in Subsidiaries |
888,532,114 |
888,501,289 |
- |
|
Long-term Investment |
16,451 |
16,426 |
16,426 |
|
Total Assets |
1,372,827,356 |
1,309,310,213 |
17,552,738 |
LIABILITIES &
SHAREHOLDERS' EQUITY [BAHT]
|
Current Liabilities |
2012 |
2011 |
2010 |
|
|
|
|
|
|
Other Payable |
266,948 |
20,241,450 |
69,998 |
|
Short-term Loan from Related Company |
87,700,000 |
1,286,000,000 |
- |
|
|
|
|
|
|
Total Current Liabilities |
87,966,948 |
1,306,241,450 |
69,998 |
|
Total Liabilities |
87,966,948 |
1,306,241,450 |
69,998 |
|
|
|
|
|
|
Shareholders' Equity |
|
|
|
|
|
|
|
|
|
Share capital : Baht 10
par value authorized, and
issued share capital 130,000,000 shares
in 2012; 10,000,000 shares
in 2011 & 2010 |
1,300,000,000 |
100,000,000 |
100,000,000 |
|
|
|
|
|
|
Capital Paid |
1,300,000,000 |
25,000,000 |
25,000,000 |
|
Retained Earning Unappropriated [Deficit] |
[15,139,592] |
[21,931,237] |
[7,517,260] |
|
Total Shareholders' Equity |
1,284,860,408 |
3,068,763 |
17,482,740 |
|
Total Liabilities &
Shareholders' Equity |
1,372,827,356 |
1,309,310,213 |
17,552,738 |
PROFIT
& LOSS ACCOUNT
|
Sale |
2012 |
2011 |
2010 |
|
|
|
|
|
|
Interest Income |
16,191,545 |
5,762,545 |
60,934 |
|
Dividend Income |
218,412 |
153,262 |
24,970 |
|
Total Sales |
16,409,957 |
5,915,807 |
85,904 |
|
Expenses |
|
|
|
|
|
|
|
|
|
Administrative Expenses |
597,717 |
156,731 |
73,935 |
|
Total Expenses |
597,717 |
156,731 |
73,935 |
|
Profit before Financial Cost |
15,812,240 |
5,759,076 |
11,969 |
|
Financial Cost |
[9,020,595] |
[20,173,053] |
- |
|
Net Profit / [Loss] |
6,791,645 |
[14,413,977] |
11,969 |
FINANCIAL
ANALYSIS
|
ITEM |
UNIT |
2012 |
2011 |
2010 |
|
|
|
|
|
|
|
LIQUIDITY RATIO |
|
|
|
|
|
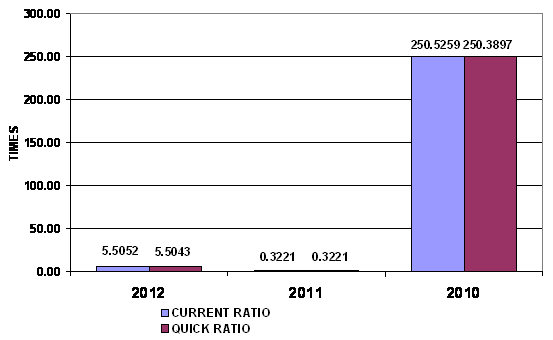
CURRENT RATIO |
TIMES |
5.51 |
0.32 |
250.53 |
|
QUICK RATIO |
TIMES |
5.50 |
0.32 |
250.39 |
|
|
|
|
|
|
|
ACTIVITY RATIO |
|
|
|
|
|
FIXED ASSETS TURNOVER |
TIMES |
- |
- |
- |
|
TOTAL ASSETS TURNOVER |
TIMES |
- |
- |
- |
|
INVENTORY CONVERSION PERIOD |
DAYS |
- |
- |
- |
|
INVENTORY TURNOVER |
TIMES |
- |
- |
- |
|
RECEIVABLES CONVERSION PERIOD |
DAYS |
- |
- |
- |
|
RECEIVABLES TURNOVER |
TIMES |
- |
- |
- |
|
PAYABLES CONVERSION PERIOD |
DAYS |
- |
- |
- |
|
CASH CONVERSION CYCLE |
DAYS |
- |
- |
- |
|
|
|
|
|
|
|
PROFITABILITY
RATIO |
|
|
|
|
|
COST OF GOODS SOLD |
% |
- |
- |
- |
|
SELLING & ADMINISTRATION |
% |
- |
- |
- |
|
INTEREST |
% |
- |
- |
- |
|
GROSS PROFIT MARGIN |
% |
- |
- |
- |
|
NET PROFIT MARGIN BEFORE EX. ITEM |
% |
- |
- |
- |
|
NET PROFIT MARGIN |
% |
- |
- |
- |
|
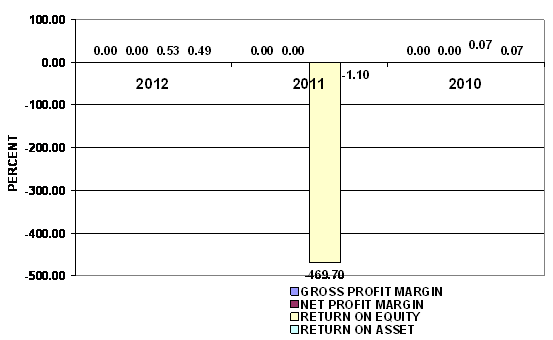
RETURN ON EQUITY |
% |
0.53 |
(469.70) |
0.07 |
|
RETURN ON ASSET |
% |
0.49 |
(1.10) |
0.07 |
|
EARNING PER SHARE |
BAHT |
0.05 |
(5.77) |
0.00 |
|
|
|
|
|
|
|
LEVERAGE RATIO |
|
|
|
|
|
DEBT RATIO |
TIMES |
0.06 |
1.00 |
0.00 |
|
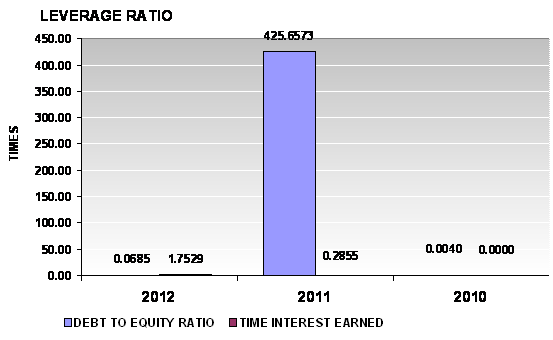
DEBT TO EQUITY RATIO |
TIMES |
0.07 |
425.66 |
0.00 |
|
TIME INTEREST EARNED |
TIMES |
1.75 |
0.29 |
- |
|
|
|
|
|
|
|
ANNUAL GROWTH |
|
|
|
|
|
SALES GROWTH |
% |
- |
- |
|
|
OPERATING PROFIT |
% |
174.56 |
48,016.60 |
|
|
NET PROFIT |
% |
147.12 |
(120,527.58) |
|
|
FIXED ASSETS |
% |
- |
- |
|
|
TOTAL ASSETS |
% |
4.85 |
7,359.29 |
|
ANNUAL GROWTH :
SATISFACTORY
Net profit has increased from THB -14,413,977.00 in 2011 to THB 6,791,645.00
in 2012. And total assets has increased from THB 1,309,310,213.00 in 2011 to
THB 1,372,827,356.00 in 2012.
PROFITABILITY :
RISKY
PROFITABILITY
RATIO
|
Gross Profit Margin |
- |
|
Industrial Average |
22.09 |
|
Net Profit Margin |
- |
|
Industrial Average |
41.34 |
|
Return on Assets |
0.49 |
Deteriorated |
Industrial Average |
6.48 |
|
Return on Equity |
0.53 |
Deteriorated |
Industrial Average |
167.37 |
Return on Assets measures how efficiently profits are being generated
from the assets employed in the business when compared with the ratios of firms
in a similar business. A low ratio in comparison with industry averages
indicates an inefficient use of business assets. When compared with the
industry average, it was lower, the
company's figure is 0.49%.
Return on Equity indicates how profitable a company is by comparing its
net income to its average shareholders' equity, ROE measures how much the
shareholders earned for their investment in the company. When compared with the
industry average, it was lower, the company's figure is 0.53%.
Trend of the average
competitors in the same industry for last 5 years
Return on Assets Uptrend
Return on Equity Uptrend
LIQUIDITY :
SATISFACTORY
LIQUIDITY RATIO
|
Current Ratio |
5.51 |
Impressive |
Industrial Average |
0.59 |
|
Quick Ratio |
5.50 |
|
|
|
|
Cash Conversion Cycle |
- |
|
|
|
The Current Ratio is to ascertain whether a company's short-term assets are
readily available to pay off its short-term liabilities. The company's figure
is 5.51 times in 2012, increased from 0.32 times, then it is generally
considered to have good short-term financial strength. When compared with the
industry average, the ratio of the company was higher, indicated that company
was an efficient operator in a dominant position within its industry.
The Quick Ratio is a liquidity indicator that further refines the
current ratio by measuring the amount of the most liquid current assets there
are to cover current liabilities. The company's figure is 5.5 times in 2012,
increased from 0.32 times, although excluding inventory so the company still
have good short-term financial strength.
Trend of the
average competitors in the same industry for last 5 years
Current Ratio Uptrend
LEVERAGE :
EXCELLENT
LEVERAGE RATIO
|
Debt Ratio |
0.06 |
Impressive |
Industrial Average |
0.97 |
|
Debt to Equity Ratio |
0.07 |
Impressive |
Industrial Average |
37.30 |
|
Times Interest Earned |
1.75 |
Impressive |
Industrial Average |
- |
Debt to Equity Ratio a measurement of how much suppliers, lenders, creditors
and obligors have committed to the company versus what the shareholders have
committed. A lower the percentage means that the company is using less leverage
and has a stronger equity position.
Times Interest Earned measuring a company's ability to meet its debt
obligations. Ratio is 1.76 higher than 1, so the company can pay interest
expenses on outstanding debt.
Debt Ratio shows the proportion of a company's assets which are financed
through debt. The company's figure is 0.06 less than 0.5, most of the company's
assets are financed through equity.
Trend of the
average competitors in the same industry for last 5 years
Debt Ratio Uptrend
Times Interest Earned Stable
ACTIVITY : RISKY
ACTIVITY RATIO
|
Fixed Assets Turnover |
- |
|
Industrial Average |
- |
|
Total Assets Turnover |
- |
|
Industrial Average |
0.16 |
|
Inventory Conversion Period |
- |
|
|
|
|
Inventory Turnover |
- |
|
Industrial Average |
1.02 |
|
Receivables Conversion Period |
- |
|
|
|
|
Receivables Turnover |
- |
|
Industrial Average |
0.39 |
|
Payables Conversion Period |
- |
|
|
|
Trend of the
average competitors in the same industry for last 5 years
Fixed Assets Turnover Stable
Total Assets Turnover Uptrend
Inventory Turnover Uptrend
Receivables Turnover Uptrend
FOREIGN EXCHANGE RATES
|
Currency |
Unit
|
Indian Rupees |
|
US Dollar |
1 |
Rs.60.05 |
|
UK Pound |
1 |
Rs.101.32 |
|
Euro |
1 |
Rs.83.34 |
INFORMATION DETAILS
|
Analysis Done by
: |
RAS |
|
|
|
|
Report Prepared
by : |
MNL |
RATING EXPLANATIONS
|
RATING |
STATUS |
PROPOSED CREDIT LINE |
|
|
>86 |
Aaa |
Possesses an extremely sound financial base with the strongest
capability for timely payment of interest and principal sums |
Unlimited |
|
71-85 |
Aa |
Possesses adequate working capital. No caution needed for credit
transaction. It has above average (strong) capability for payment of interest
and principal sums |
Large |
|
56-70 |
A |
Financial & operational base are regarded healthy. General unfavourable
factors will not cause fatal effect. Satisfactory capability for payment of
interest and principal sums |
Fairly Large |
|
41-55 |
Ba |
Overall operation is considered normal. Capable to meet normal
commitments. |
Satisfactory |
|
26-40 |
B |
Capability to overcome financial difficulties seems comparatively
below average. |
Small |
|
11-25 |
Ca |
Adverse factors are apparent. Repayment of interest and principal sums
in default or expected to be in default upon maturity |
Limited with full
security |
|
<10 |
C |
Absolute credit risk exists. Caution needed to be exercised |
Credit not
recommended |
|
-- |
NB |
New Business |
-- |
This score serves as a reference to assess SC’s
credit risk and to set the amount of credit to be extended. It is calculated
from a composite of weighted scores obtained from each of the major sections of
this report. The assessed factors and their relative weights (as indicated
through %) are as follows:
Financial
condition (40%) Ownership
background (20%) Payment
record (10%)
Credit history
(10%) Market trend (10%) Operational size
(10%)
This report is issued at your request without any
risk and responsibility on the part of MIRA INFORM PRIVATE LIMITED (MIPL)
or its officials.