MIRA INFORM REPORT
|
Report Date : |
06.05.2014 |
IDENTIFICATION DETAILS
|
Name : |
WELSPUN CORP LIMITED (w.e.f. 27.04.2010) |
|
|
|
|
Formerly Known
As : |
WELSPUN GUJARAT STAHL ROHREN LIMITED |
|
|
|
|
Registered
Office : |
Welspun City, Village Versamedi, Taluka Anjar,
District Kutch – 370110, Gujarat |
|
|
|
|
Country : |
India |
|
|
|
|
Financials (as
on) : |
31.03.2013 |
|
|
|
|
Date of
Incorporation : |
26.04.1995 |
|
|
|
|
Com. Reg. No.: |
04-025609 |
|
|
|
|
Capital
Investment / Paid-up Capital : |
Rs.1314.740
Millions |
|
|
|
|
CIN No.: [Company Identification
No.] |
L27100GJ1995PLC025609 |
|
|
|
|
IEC No.: |
0895004801 |
|
|
|
|
TAN No.: [Tax Deduction &
Collection Account No.] |
BRDW00071B RKTW00064B |
|
|
|
|
PAN No.: [Permanent Account No.] |
AAACW0744L |
|
|
|
|
Legal Form : |
A Public Limited Liability company. The company’s Shares are Listed on
the Stock Exchanges. |
|
|
|
|
Line of Business
: |
Manufacturing
of Steel Pipes, Coils and Plates |
|
|
|
|
No. of Employees
: |
Information Decline by the management |
RATING & COMMENTS
|
MIRA’s Rating : |
A (65) |
|
RATING |
STATUS |
PROPOSED CREDIT LINE |
|
|
56-70 |
A |
Financial & operational base are regarded healthy. General
unfavourable factors will not cause fatal effect. Satisfactory capability for
payment of interest and principal sums |
Fairly Large |
|
Maximum Credit Limit : |
USD 170000000 |
|
|
|
|
Status : |
Good |
|
|
|
|
Payment Behaviour : |
Regular |
|
|
|
|
Litigation : |
Clear |
|
|
|
|
Comments : |
Subject is the flagship company of “Welspun Group”. It is one of the
largest manufactures of large diameter line pipe in the world. It is a well established company having good track record. Financial
position of the company is sound. Even though the company has shown some growth in the sales turnover
during 2013 there seems some dip in the profitability. However, trade relations are reported as trustworthy. Business is
active. Payments are reported to be regular and as per commitment. In view of promoters resourcefulness and long standing experience in
the industry, the company can be considered good for business dealings at
usual trade terms and conditions. |
NOTES :
Any query related to this report can be made
on e-mail : infodept@mirainform.com
while quoting report number, name and date.
INDIAN ECONOMIC OVERVIEW
US investment bank
Goldman Sachs has upgraded its outlook on Indian markets as it expects
positive impact of the election cycle.
India’s economy may
grow 4.7 % in the current financial year, lower than the official estimate of
4.9 %, Fitch Rating said. The global rating agency expects the economy to pick
up in the next two financial years.
Global ratings
agency Standard & Poor said increasing focus by India Inc on lowering debt
is likely to improve their credit profiles.
Singapore (1.1
million Indian tourists in 2012), Thailand (one million), the United Arab
Emirates ().98 million) and Malaysia ().82 million) emerged as the preferred
holidays hotspots for Indians. The total figure is expected to increase to 1.93
million by 2017, according to the latest Eurmonitor international report.
There is a $29.34 bn
outward foreign direct investment by domestic companies between April and
January of 2013/14 which has seen some signs of recovery according to a Care
Ratings report.
There are 264 number
of new companies being set up every day on average during 2014. Most of them
are registered in Mumbai. India had 1.38 million registered companies at the
end of January, 2014.
Twitter like
messaging service Weibo Corporation has filed to raise $ 500 million via a US initial
public offering. Alibaba, which owns a stake in Weibo is expected to raise
about $ 15 billion New York this year in the highest profile Internet IPO since
Facebook’s in 2012.
Bharti Airtel has
raised Rs.2,453.2 crore (350 million Swiss Francs) by selling six-year bonds at
a coupon rate of three per cent and maturing in 2020. This is the largest ever
bond offering by an Indian company in Swiss Francs. Bharat Petroleum
Corporation raised 175 million Swiss Francs by selling five year bonds at 2.98
% coupon rate in February.
Indian Oil
Corporation plans to invest Rs 7650 crore in setting up a petrochemical complex
at its almost complete Paradip refinery in Odhisha in three to four years. The
company board is set to consider the setting up of a 700000 tonne per annum
polypropylene plant at an estimated cost at Rs.3150 crore.
Global chief
information officers at gathering in Bangalore in April to meet Indian startups
at an event called Tech50 Watchout for Little Eye Labs-Facebook type deals in
the making.
EXTERNAL AGENCY RATING
|
Rating Agency Name |
CARE |
|
Rating |
Long term bank facilities: AA - |
|
Rating Explanation |
High credit quality and low credit risk. |
|
Date |
13.09.2013 |
|
Rating Agency Name |
CARE |
|
Rating |
Short term bank facilities: A1+ |
|
Rating Explanation |
Very strong degree of safety and lowest credit risk. |
|
Date |
13.09.2013 |
RBI DEFAULTERS’ LIST STATUS
Subject’s name is not enlisted as a defaulter
in the publicly available RBI Defaulters’ list.
EPF (Employee Provident Fund) DEFAULTERS’ LIST STATUS
Subject’s name is not enlisted as a defaulter
in the publicly available EPF (Employee Provident Fund) Defaulters’ list as of
31-03-2012.
INFORMATION DECLINED
Management Non Co-Operative (Tel. No.: 91-22-24908000)
LOCATIONS
|
Registered Office / Factory 1 : |
Welspun City, Village Versamedi, Taluka Anjar,
District Kutch – 370110, Gujarat, India |
|
Tel. No.: |
91-2461-266011/ 256281 91-2836-661111 / 279000/ 573428/ 29 |
|
Fax No.: |
91-2461-256285 91-2836-279060 / 279010/ 247070 |
|
E-Mail : |
|
|
Website : |
|
|
Area : |
4950518 Sq .ft. (Factory) |
|
Location : |
Owned |
|
|
|
|
Corporate Office : |
Welspun House, 5th Floor, Kamala Mills Compound, Senapati Bapat Marg,
Lotheyr Parel, Mumbai-400013, |
|
Tel. No.: |
91-22-24908000/ 66136000 |
|
Fax No.: |
91-22-24908020/ 21 |
|
E-Mail : |
|
|
|
|
|
Factory 2 : |
Village Vadadla, Near Dahej, Taluka: Vagra, District Bharuch – 392130,
Gujarat, India |
|
Tel. No.: |
91-2641-256281 / 256011 |
|
Fax No.: |
91-2641-256285 |
|
E-Mail : |
|
|
|
|
|
Factory 3 : |
KIADB Industrial Area, Gejjalagere, Taluka Maddur, District Mandya –
571428, |
|
|
|
|
Branch Office: |
T-11, Vasant Sqare Mall (3rd Floor), Sector - B, Pocket –
5, Vasant Kunj, New Delhi – 110070, India
|
|
Tel. No.: |
91-11-26022051/ 2612 2054 |
|
Fax No.: |
91-11-26122064 |
DIRECTORS
As on: 31.03.2013
|
Name : |
Mr. Balkrishan Goenka |
|
Designation : |
Chairman and Executive Director |
|
Address : |
6, |
|
Qualification : |
B. Com |
|
|
|
|
Name : |
Mr. Braja Mishra |
|
Designation : |
Managing Director |
|
|
|
|
Name : |
Mr. Rajesh R. Mandawewala |
|
Designation : |
Director |
|
Address : |
171, B Wing, 17th Floor, Tanna Redisency, Bay view,
392, V. S. Marg, Prabhadevi, Mumbai – 400026, Maharashtra, India. |
|
Qualification : |
B. Com , A.C.A |
|
|
|
|
Name : |
Mr. Mukul Sarkar |
|
Designation : |
Nominee Director of Exim Bank Limited |
|
|
|
|
Name : |
Mr. Mintoo Bhadari |
|
Designation : |
Nominee Director of Insight Solutions Limited |
|
|
|
|
Name : |
Mr. Raj Kumar Jain |
|
Designation : |
Director |
|
Address : |
A/ 42, Manali, Evershine Nagar, Malad (West), Mumbai –
4000064, |
|
Qualification : |
A. C. A. |
|
|
|
|
Name : |
Mr. K. H. Viswanathan |
|
Designation : |
Director |
|
Address : |
Plat No. 4, Kalyani Uttam Society, Antony Road, Chembur, Mumbai – 400071,
Maharashtra, India. |
|
Qualification : |
ICWA |
|
|
|
|
Name : |
Mr. Ram Gopal Sharma |
|
Designation : |
Director |
|
Address : |
707, Look Shrtia, |
|
Qualification : |
B. Com, Master in
Ecomomics |
|
|
|
|
Name : |
Mr. Nirmal Gangwal |
|
Designation : |
Director |
|
|
|
|
Name : |
Mr. Utsav Baijal |
|
Designation : |
Nominee Director of Insight Solutions Limited |
KEY EXECUTIVES
|
Name : |
Mr. Pradeep Joshi |
|
Designation : |
Company Secretary |
|
|
|
|
Name : |
Mr. Brijgopal Jaju |
|
Designation : |
Chief Financial Officer |
|
|
|
|
Name : |
Mr. S. Krishnan |
|
Designation : |
Chief Financial Officer |
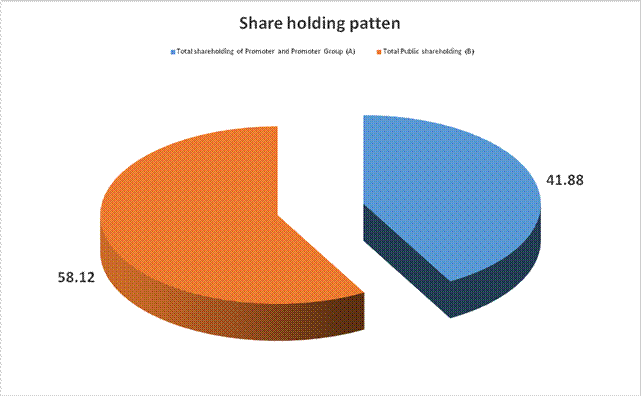
MAJOR SHAREHOLDERS / SHAREHOLDING PATTERN
As on: 31.03.2014
|
Category of
Shareholders |
No. of Shares |
Percentage of
Holding |
|
|
|
|
|
(A) Shareholding of Promoter and Promoter Group |
|
|
|
|
|
|
|
|
342 |
0.00 |
|
|
85910140 |
35.81 |
|
|
85910482 |
35.81 |
|
|
|
|
|
|
14565523 |
6.07 |
|
|
14565523 |
6.07 |
|
Total shareholding of Promoter and Promoter Group (A) |
100476005 |
41.88 |
|
(B) Public Shareholding |
|
|
|
|
|
|
|
|
22306901 |
9.30 |
|
|
270000 |
0.11 |
|
|
15094102 |
6.29 |
|
|
37671003 |
15.70 |
|
|
|
|
|
|
27407742 |
11.42 |
|
|
|
|
|
|
16640892 |
6.94 |
|
|
13490028 |
5.62 |
|
|
44236629 |
18.44 |
|
|
42542721 |
17.73 |
|
|
614500 |
0.26 |
|
|
949728 |
0.40 |
|
|
7500 |
0.00 |
|
|
68000 |
0.03 |
|
|
54180 |
0.02 |
|
|
101775291 |
42.42 |
|
Total Public shareholding (B) |
139446294 |
58.12 |
|
Total (A)+(B) |
239922299 |
100.00 |
|
(C) Shares held by Custodians and against which Depository
Receipts have been issued |
0 |
0.00 |
|
|
0 |
0.00 |
|
|
23026000 |
0.00 |
|
|
23026000 |
0.00 |
|
Total (A)+(B)+(C) |
262948299 |
0.00 |
Shareholding belonging to the category
"Promoter and Promoter Group"
|
Sl. No. |
Name of the
Shareholder |
Details of Shares
held |
Total shares (including underlying shares assuming full conversion of
warrants and convertible securities) as a % of diluted share capital |
|
|
No. of Shares held |
As a % of grand
total (A)+(B)+(C) |
|||
|
1 |
B K Goenka |
140 |
0.00 |
0.00 |
|
2 |
R R Mandawewala |
200 |
0.00 |
0.00 |
|
3 |
Dipali Goenka |
2 |
0.00 |
0.00 |
|
4 |
B K Goenka Trustee B K Goenka Family Trust |
5 |
0.00 |
0.00 |
|
5 |
Krishiraj Trading Limited |
5,28,62,858 |
20.10 |
19.23 |
|
6 |
Welspun Mercantile Limited |
1,44,77,701 |
5.51 |
5.27 |
|
7 |
Welspun Wintex Limited |
1,33,36,576 |
5.07 |
4.85 |
|
8 |
Welspun Investments and Commercial Limited |
52,33,000 |
1.99 |
1.90 |
|
9 |
Mulheim Pipecoatings GmbH (Formerly Eupec Pipe Coating GmbH) |
82,65,523 |
3.14 |
3.01 |
|
10 |
Intech Metals S A |
63,00,000 |
2.40 |
2.29 |
|
|
Total |
10,04,76,005 |
38.21 |
36.54 |
Shareholding belonging to the category
"Public" and holding more than 1% of the Total No. of Shares
|
Sl. No. |
Name of the
Shareholder |
No. of Shares held |
Shares as % of
Total No. of Shares |
Details of
convertible securities |
Total shares
(including underlying shares assuming full conversion of warrants and
convertible securities) as a % of diluted share capital |
|
|
Number of convertible
securities held |
% w.r.t total
number of convertible securities of the same class |
|||||
|
1 |
Granele Limited |
35038889 |
13.33 |
0 |
0.00 |
12.74 |
|
2 |
JP Morgan Chase Bank. NA ADR Account (Custodian and against which Depository receipts have been issued) |
23026000 |
8.76 |
0 |
0.00 |
8.37 |
|
3 |
Life Insurance Corporation of India and its Schemes |
19277980 |
7.33 |
0 |
0.00 |
7.01 |
|
4 |
Mentor Capital Limited |
7831424 |
2.98 |
0 |
0.00 |
2.85 |
|
5 |
Nippon Investment and Finance Company Private Limited |
7648958 |
2.91 |
0 |
0.00 |
2.78 |
|
6 |
Simba Asia Limited |
7503832 |
2.85 |
0 |
0.00 |
2.73 |
|
7 |
Akash Bhansali |
3653461 |
1.39 |
0 |
0.00 |
1.33 |
|
8 |
Edgbaston Asian Equity Trust |
2987139 |
1.14 |
0 |
0.00 |
1.09 |
|
9 |
Bakulesh Trambaklal Shah |
2844580 |
1.08 |
0 |
0.00 |
1.03 |
|
10 |
Holders of Foreign Currency Convertible Bonds |
0 |
0.00 |
12005000 |
100.00 |
4.37 |
|
|
Total |
109812263 |
41.76 |
12005000 |
100.00 |
44.30 |
Shareholding belonging to the category
"Public" and holding more than 5% of the Total No. of Shares
|
Sl. No. |
Name(s) of the
shareholder(s) and the Persons Acting in Concert (PAC) with them |
No. of Shares |
Shares as % of Total No. of Shares |
Total shares (including underlying shares assuming full conversion of
warrants and convertible securities) as a % of diluted share capital |
|
1 |
Granele Limited |
35038889 |
13.33 |
12.74 |
|
2 |
JP Morgan Chase Bank, NA ADR Account (Custodian and against which Depository receipts have been issued) |
23026000 |
8.76 |
8.37 |
|
3 |
Life Insurance Corporation of India and its Schemes |
19277980 |
7.33 |
7.01 |
|
|
Total |
77342869 |
29.41 |
28.13 |
Details of Depository Receipts (DRs)
|
Sl. No. |
Type of Outstanding
DR (ADRs, GDRs, SDRs, etc.) |
No. of Outstanding DRs |
No. of Shares Underlying |
Shares Underlying Outstanding DRs as % of Total No. of Shares |
|
1 |
Global Depository Receipts |
23,026 |
2,30,26,000 |
8.76 |
|
|
Total |
23,026 |
2,30,26,000 |
8.76 |
BUSINESS DETAILS
|
Line of Business : |
Manufacturing
of Steel Pipes, Coils and Plates |
PRODUCTION STATUS ( AS ON 31.03.2011)
|
Particulars |
Unit |
Licensed
Capacity |
Installed
Capacity |
Actual
Production |
|
Welded Pipes |
MT |
NA |
1200000 |
1150000 |
|
Coating of Pipes |
‘000 SQMS |
NA |
14500 |
14500 |
|
M.S. Plates/H.R. Coils |
MT |
NA |
1500000 |
1500000 |
|
Power (co-generation) |
KWH |
NA |
330000 |
330000 |
GENERAL INFORMATION
|
No. of Employees : |
Information Decline by the management |
|||||||||||||||||||||||||||||||||||||||||||||||||||||||||||||||||||||||||||||||||||||||||||||||||||||||||||||||||||||||||||||||||||||||||||||
|
|
|
|||||||||||||||||||||||||||||||||||||||||||||||||||||||||||||||||||||||||||||||||||||||||||||||||||||||||||||||||||||||||||||||||||||||||||||
|
Bankers : |
|
|||||||||||||||||||||||||||||||||||||||||||||||||||||||||||||||||||||||||||||||||||||||||||||||||||||||||||||||||||||||||||||||||||||||||||||
|
|
|
|||||||||||||||||||||||||||||||||||||||||||||||||||||||||||||||||||||||||||||||||||||||||||||||||||||||||||||||||||||||||||||||||||||||||||||
|
Facilities : |
(Rs.
In Millions)
|
|||||||||||||||||||||||||||||||||||||||||||||||||||||||||||||||||||||||||||||||||||||||||||||||||||||||||||||||||||||||||||||||||||||||||||||
|
|
|
|
Banking
Relations : |
-- |
|
|
|
|
Auditors : |
|
|
Name : |
MGB and Company Chartered Accountants |
|
Address : |
Mumbai, |
|
|
|
|
Subsidiaries : |
Direct Subsidiaries
Indirect Subsidiaries Held through Welspun Mauritius Holdings Limited
Held through Welspun Pipes Inc
Held through Welspun Natural Resources Private Limited ·
Welspun Plastics Private Limited Held through Welspun Infratech Limited ·
Welspun Projects Limited ·
Welspun Road Projects Private Limited ·
Welspun Infra Projects Private Limited ·
ARSS Bus Terminal Private Limited (w e f 3 August
2011) Held through Welspun Projects Limited
Held through Welspun Infra Projects Limited
|
|
|
|
|
Associates |
|
|
|
|
|
Joint Ventures : |
Dahej Infrastructure Private Limited |
|
|
|
|
Indirect Joint Ventures |
Held through Welspun Natural Resources Private Limited
Held through Welspun Infra Projects Private Limited ·
Leighton Welspun Contractors Private Limited (w e
f 28 April 2011) Held through Welspun Projects Limited
|
CAPITAL STRUCTURE
As on: 31.03.2013
Authorised Capital :
|
No. of Shares |
Type |
Value |
Amount |
|
|
|
|
|
|
304000000 |
Equity Shares |
Rs.5/- each |
Rs. 1520.000 |
|
98000000 |
Preference Shares |
Rs.10/-each |
Rs.980.000 Millions |
|
|
Total |
|
Rs.2500.000
Million |
Issued, Subscribed & Paid-up Capital :
|
No. of Shares |
Type |
Value |
Amount |
|
|
|
|
|
|
262948299 |
Equity Shares |
Rs.5/- each |
Rs.1314.740
Millions |
|
|
|
|
|
a) Reconciliation of
the number of Equity shares outstanding
|
Particular |
2012 |
|
|
|
Number of Shares |
Rs. in Millions |
|
At the beginning of the year |
227,781,035 |
1138.910 |
|
By way of Global Depository Receipts (GDR) |
-- |
-- |
|
By way of Conversion of Compulsory Convertible Debentures (CCD) |
35,038,889 |
175.190 |
|
Equity shares allotted on exercise of Employees Stock Options |
128,375 |
0.640 |
|
Outstanding at the end of the year |
262,948,299 |
1314.740 |
Terms and rights
attached to equity shares
The Company has only one class of equity shares having a par value of Rs. 5 per share. Each holder of equity shares is entitled to one vote per share, however the holders of global depository receipts (GDR's) do not have voting rights in respect of shares represented by the GDR's till the shares are held by the custodian. The dividend when proposed by the Board of Directors is subject to the approval of the shareholders in the ensuing Annual General Meeting.
In the event of liquidation of the company, the holders of the equity shares will be entitled to receive remaining assets of the company, after distribution of preferential amounts. The distribution will be in proportion to the number of equity shares held by the shareholders.
Number of Equity
Shares Held By the Shareholders
|
Particular |
2012 |
|
|
|
Number of Shares
|
% |
|
J P Morgan Chase Bank, NA ADR Account (Custodian and against
which GDR have been issued to Insight Solutions Limited) |
23,026,000 |
8.76 |
|
Granele Limited |
35,038,889 |
13.33 |
|
Life Insurance Corporation of India Limited and its Schemes |
19,283,580 |
7.33 |
|
Welspun Wintex Limited |
13,336,576 |
5.07 |
|
Welspun Mercantile Limited |
13,877,701 |
5.28 |
|
Welspun Fin trade Limited |
18,955,791 |
7.21 |
|
Krishiraj Trading Limited |
26,907,692 |
10.23 |
Employee Stock Options Scheme
In respect of options granted under the Welspun Employee Stock Options Scheme, in accordance with the guidelines issued by Securities and Exchange Board of India, the value of options (based on intrinsic value of the share on the date of the grant of the option) is accounted as deferred employee compensation, which is amortized on a straight line basis over the vesting period. Employee benefits expense include credit of Rs. 6.600 million (Rs. 1.510 million) on account of reversal of options lapsed during the year.
During the year, 128,375 equity shares of Rs. 5 each fully paid up were issued at a price of Rs. 80.000. Discount allowed aggregating to Rs. 3.430 million (Rs. 2.270 million) in respect of shares allotted pursuant to the Employee Stock Options Scheme is credited to Securities Premium Account as per guidelines of Securities and Exchange Board of India.
Stock Options
outstanding as at the year end are as follows
|
Particular |
Granted during
2006-07 |
Granted during
2009-10 |
|
Exercise Price |
Rs.80.00 |
Rs.66.75 |
|
Date of Grant |
8th January 2007 |
20th April 2009 |
|
Vesting period
commences on |
8th January 2008 |
20th April 2010 |
|
Options
outstanding at the beginning of the year |
375250 |
32875 |
|
Options exercised
during the year |
128375 |
-- |
|
Options lapsed
during the year |
246875 |
-- |
|
Options
Outstanding as at 31 March 20123 |
-- |
32875 |
Compulsorily
Convertible Debentures (CCD)
During the previous financial year, the Company has raised US$ 178.01 million (Equivalent INR 7,883.75 million) by way of issue of unsecured CCD carrying a coupon of 5% (Five) annually until issue of Equity Shares upon conversion of the CCD. Since the holder of CCD have not opted for conversion during the period of 18 months from the date of issue of the said CCD, the CCD got converted on 18 February 2013 into 35,038,889 equity shares of ` 5 each fully paid up at a conversion price of ` 225 per share. The entire proceeds have been invested in short-term securities as at 31 March 2013.
Global Depository Receipts (GDR)
During the previous year, the Company has raised US$ 115.00 million (Equivalent INR 5,180.85 million) by way of issue of 23,026,000 equity shares of ` 5 each fully paid up at a premium of Rs. 220 each (equivalent 23,026 Non-voting GDR each of US$ 4,994.45 each representing 1000 equity shares of par value of Rs.5 each). The entire proceeds have been invested in short-term securities as at 31 March 2013.
FINANCIAL DATA
[all figures are
in Rupees Millions]
ABRIDGED BALANCE
SHEET
|
SOURCES OF FUNDS |
31.03.2013 |
31.03.2012 |
31.03.2011 |
|
EQUITY AND LIABILITIES |
|
|
|
|
(1)Shareholders' Funds |
|
|
|
|
(a) Share Capital |
1314.740 |
1138.910 |
1023.340 |
|
(b) Reserves & Surplus |
42715.020 |
34490.370 |
29503.580 |
|
(c) Money received against share warrants |
0.000 |
0.000 |
0.000 |
|
|
|
|
|
|
(2) Share Application money pending allotment |
0.000 |
0.000 |
0.000 |
|
Total Shareholders’
Funds (1) + (2) |
44029.760 |
35629.280 |
30526.920 |
|
|
|
|
|
|
Compulsorily convertible debentures |
0.000 |
7883.750 |
0.000 |
|
Foreign Currency Monetary Item Translation Difference Account |
0.000 |
0.000 |
65.140 |
|
|
|
|
|
|
(3) Non-Current
Liabilities |
|
|
|
|
(a) long-term borrowings |
26053.720 |
22838.770 |
25229.010 |
|
(b) Deferred tax liabilities (Net) |
3893.910 |
3545.120 |
3431.420 |
|
(c) Other long term liabilities |
1764.260 |
2417.440 |
1561.600 |
|
(d) long-term provisions |
130.460 |
139.530 |
93.610 |
|
Total Non-current
Liabilities (3) |
31842.350 |
28940.860 |
30315.640 |
|
|
|
|
|
|
(4) Current
Liabilities |
|
|
|
|
(a) Short term borrowings |
1177.930 |
2928.180 |
1379.010 |
|
(b) Trade payables |
19083.280 |
25361.350 |
12026.220 |
|
(c) Other current liabilities |
6751.660 |
8008.420 |
6761.930 |
|
(d) Short-term provisions |
1122.560 |
1571.550 |
1775.110 |
|
Total Current
Liabilities (4) |
28135.430 |
37869.500 |
21942.270 |
|
|
|
|
|
|
TOTAL |
104007.540 |
110323.390 |
82849.970 |
|
|
|
|
|
|
ASSETS |
|
|
|
|
(1) Non-current
assets |
|
|
|
|
(a) Fixed Assets |
|
|
|
|
(i) Tangible assets |
29621.820 |
30271.180 |
24701.730 |
|
(ii) Intangible Assets |
216.230 |
262.810 |
344.600 |
|
(iii) Capital work-in-progress |
1784.840 |
1979.480 |
4951.390 |
|
(iv) Intangible assets under development |
0.000 |
0.000 |
0.000 |
|
(b) Non-current Investments |
19593.840 |
14659.390 |
4812.210 |
|
(c) Deferred tax assets (net) |
0.000 |
0.000 |
0.000 |
|
(d) Long-term Loan and Advances |
3051.270 |
5540.980 |
3165.700 |
|
(e) Other Non-current assets |
0.000 |
76.300 |
0.000 |
|
Total Non-Current
Assets |
54268.000 |
52790.140 |
37975.630 |
|
|
|
|
|
|
(2) Current assets |
|
|
|
|
(a) Current investments |
16908.260 |
19379.990 |
12891.170 |
|
(b) Inventories |
14741.860 |
16498.500 |
13156.350 |
|
(c) Trade receivables |
9770.790 |
10927.630 |
8841.300 |
|
(d) Cash and cash equivalents |
4328.630 |
6409.430 |
6164.710 |
|
(e) Short-term loans and advances |
2320.140 |
3078.450 |
3049.780 |
|
(f) Other current assets |
1669.860 |
1239.250 |
771.030 |
|
Total Current
Assets |
49739.540 |
57533.250 |
44874.340 |
|
|
|
|
|
|
TOTAL |
104007.540 |
110323.390 |
82849.970 |
PROFIT & LOSS
ACCOUNT
|
|
PARTICULARS |
31.03.2013 |
31.03.2012 |
31.03.2011 |
|
|
|
SALES |
|
|
|
|
|
|
|
Income |
66321.650 |
57697.110 |
62704.030 |
|
|
|
Other Income |
3003.780 |
2192.040 |
935.140 |
|
|
|
TOTAL (A) |
69325.430 |
59889.150 |
63639.170 |
|
|
|
|
|
|
|
|
Less |
EXPENSES |
|
|
|
|
|
|
|
Cost of materials consumed |
41559.920 |
36908.840 |
|
|
|
|
Purchases of traded goods |
9207.690 |
6853.500 |
|
|
|
|
Changes in inventories of finished goods and goods in process |
(1475.940) |
(843.560) |
|
|
|
|
Employee benefits expense |
2197.070 |
1756.090 |
|
|
|
|
|
11139.960 |
10136.730 |
|
|
|
|
Exceptional items |
538.200 |
0.000 |
|
|
|
|
TOTAL (B) |
63166.900 |
54811.600 |
55042.170 |
|
|
|
|
|
|
|
|
Less |
PROFIT
BEFORE INTEREST, TAX, DEPRECIATION AND AMORTISATION (A-B) (C) |
6158.530 |
5077.550 |
8597.000 |
|
|
|
|
|
|
|
|
|
Less |
FINANCIAL
EXPENSES (D) |
2988.980 |
2470.960 |
1676.720 |
|
|
|
|
|
|
|
|
|
|
PROFIT
BEFORE TAX, DEPRECIATION AND AMORTISATION (C-D) (E) |
3169.550 |
2606.590 |
6920.280 |
|
|
|
|
|
|
|
|
|
Less/ Add |
DEPRECIATION/
AMORTISATION (F) |
2289.910 |
1843.520 |
1656.650 |
|
|
|
|
|
|
|
|
|
|
PROFIT BEFORE
TAX (E-F) (G) |
879.640 |
763.070 |
5263.630 |
|
|
|
|
|
|
|
|
|
Less |
TAX (H) |
348.780 |
113.690 |
1619.110 |
|
|
|
|
|
|
|
|
|
|
PROFIT AFTER TAX
(G-H) (I) |
530.860 |
649.380 |
3644.520 |
|
|
|
|
|
|
|
|
|
Add |
PREVIOUS
YEARS’ BALANCE BROUGHT FORWARD |
13510.360 |
13415.490 |
11074.890 |
|
|
|
|
|
|
|
|
|
Less |
APPROPRIATIONS |
|
|
|
|
|
|
|
General Reserve |
53.090 |
65.000 |
364.500 |
|
|
|
Debenture Redemption Reserve |
(321.920) |
357.140 |
463.390 |
|
|
|
Proposed Dividend on Equity Shares |
153.810 |
132.370 |
409.340 |
|
|
|
Tax on above Dividend |
0.000 |
0.000 |
66.400 |
|
|
|
Dividend on Equity Shares for earlier
period |
0.200 |
0.000 |
0.250 |
|
|
|
Tax on Dividend |
0.000 |
0.000 |
0.040 |
|
|
BALANCE CARRIED
TO THE B/S |
14156.040 |
13510.360 |
13415.490 |
|
|
|
|
|
|
|
|
|
|
EARNINGS IN
FOREIGN CURRENCY |
|
|
|
|
|
|
|
FOB value of export |
20993.220 |
25243.000 |
22054.680 |
|
|
|
Job work and other charges |
5808.890 |
1053.840 |
718.810 |
|
|
TOTAL EARNINGS |
26802.110 |
26296.840 |
22773.490 |
|
|
|
|
|
|
|
|
|
|
IMPORTS |
|
|
|
|
|
|
|
Raw Materials |
28884.680 |
32854.050 |
22131.500 |
|
|
|
Capital Goods |
51.360 |
2286.950 |
81.500 |
|
|
|
Stores & Spares |
295.610 |
567.700 |
946.530 |
|
|
|
Traded Goods |
9296.010 |
6826.590 |
8433.870 |
|
|
|
Coal |
576.930 |
778.240 |
628.220 |
|
|
TOTAL IMPORTS |
39104.590 |
43313.530 |
32221.620 |
|
|
|
|
|
|
|
|
|
|
Earnings Per
Share (Rs.) |
2.29 |
2.96 |
17.82 |
|
KEY RATIOS
|
PARTICULARS |
|
31.03.2013 |
31.03.2012 |
31.03.2011 |
|
PAT / Total Income |
(%) |
0.77 |
1.09 |
5.72 |
|
|
|
|
|
|
|
Net Profit Margin (PBT/Sales) |
(%) |
1.32 |
1.32 |
8.40 |
|
|
|
|
|
|
|
Return on Total Assets (PBT/Total Assets} |
(%) |
1.07 |
0.81 |
7.21 |
|
|
|
|
|
|
|
Return on Investment (ROI) (PBT/Networth) |
|
0.01 |
0.02 |
0.17 |
|
|
|
|
|
|
|
Debt Equity Ratio (Total Debt/Networth) |
|
0.61 |
0.72 |
0.87 |
|
|
|
|
|
|
|
Current Ratio (Current Asset/Current Liability) |
|
1.77 |
1.51 |
2.05 |
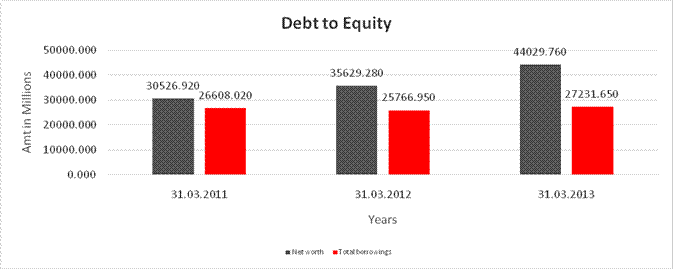
FINANCIAL ANALYSIS
[all figures are
in Rupees Millions]
DEBT EQUITY RATIO
|
Particular |
31.03.2011 |
31.03.2012 |
31.03.2013 |
|
|
(Rs.
In Millions) |
(Rs.
In Millions) |
(Rs.
In Millions) |
|
Share Capital |
1023.340 |
1138.910 |
1314.740 |
|
Reserves & Surplus |
29503.580 |
34490.370 |
42715.020 |
|
Net
worth |
30526.920 |
35629.280 |
44029.760 |
|
|
|
|
|
|
long-term borrowings |
25229.010 |
22838.770 |
26053.720 |
|
Short term borrowings |
1379.010 |
2928.180 |
1177.930 |
|
Total
borrowings |
26608.020 |
25766.950 |
27231.650 |
|
Debt/Equity
ratio |
0.872 |
0.723 |
0.618 |
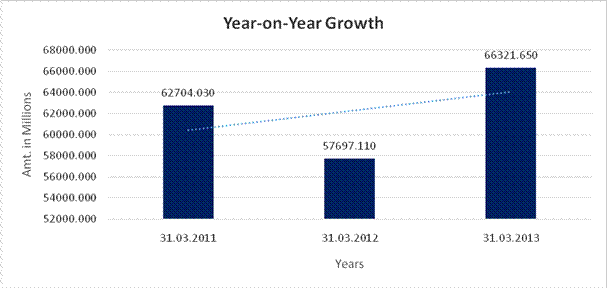
YEAR-ON-YEAR GROWTH
|
Year
on Year Growth |
31.03.2011 |
31.03.2012 |
31.03.2013 |
|
|
(Rs.
In Millions) |
(Rs.
In Millions) |
(Rs.
In Millions) |
|
Sales |
62704.030 |
57697.110 |
66321.650 |
|
|
|
(7.985) |
14.948 |
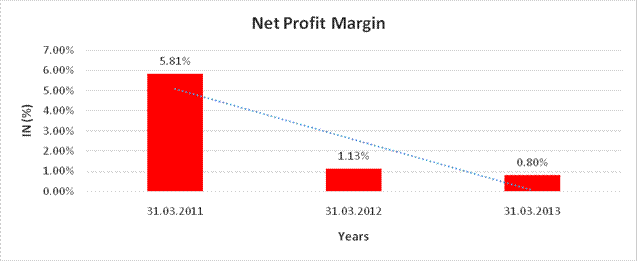
NET PROFIT MARGIN
|
Net
Profit Margin |
31.03.2011 |
31.03.2012 |
31.03.2013 |
|
|
(Rs.
In Millions) |
(Rs.
In Millions) |
(Rs.
In Millions) |
|
Sales |
62704.030 |
57697.110 |
66321.650 |
|
Profit |
3644.520 |
649.380 |
530.860 |
|
|
5.81% |
1.13% |
0.80% |
LOCAL AGENCY FURTHER INFORMATION
CURRENT MATURITIES
OF LONG-TERM DEBT DETAILS: NOT AVAILABLE
|
Sr. No. |
Check List by Info
Agents |
Available in Report (Yes / No) |
|
1] |
Year of Establishment |
Yes |
|
2] |
Locality of the firm |
Yes |
|
3] |
Constitutions of the firm |
Yes |
|
4] |
Premises details |
Yes |
|
5] |
Type of Business |
Yes |
|
6] |
Line of Business |
Yes |
|
7] |
Promoter's background |
Yes |
|
8] |
No. of employees |
No |
|
9] |
Name of person contacted |
No |
|
10] |
Designation of contact person |
No |
|
11] |
Turnover of firm for last three years |
Yes |
|
12] |
Profitability for last three years |
Yes |
|
13] |
Reasons for variation <> 20% |
-- |
|
14] |
Estimation for coming financial year |
No |
|
15] |
Capital in the business |
Yes |
|
16] |
Details of sister concerns |
Yes |
|
17] |
Major suppliers |
No |
|
18] |
Major customers |
No |
|
19] |
Payments terms |
Yes |
|
20] |
Export / Import details (if applicable) |
No |
|
21] |
Market information |
-- |
|
22] |
Litigations that the firm / promoter involved in |
-- |
|
23] |
Banking Details |
Yes |
|
24] |
Banking facility details |
Yes |
|
25] |
Conduct of the banking account |
-- |
|
26] |
Buyer visit details |
-- |
|
27] |
Financials, if provided |
Yes |
|
28] |
Incorporation details, if applicable |
Yes |
|
29] |
Last accounts filed at ROC |
Yes |
|
30] |
Major Shareholders, if available |
Yes |
|
31] |
Date of Birth of Proprietor/Partner/Director, if available |
Yes |
|
32] |
PAN of Proprietor/Partner/Director, if available |
No |
|
33] |
Voter ID No of Proprietor/Partner/Director, if available |
No |
|
34] |
External Agency Rating, if available |
Yes |
UNSECURED LOAN
(Rs.
In Millions)
|
Particulars |
As on 31.03.2013 |
As on 31.03.2012 |
|
Long-term
borrowings |
|
|
|
Foreign currency convertible bonds |
4424.230 |
7631.250 |
|
Deferred sales tax loan |
16.690 |
33.390 |
|
|
|
|
|
Total |
4440.920 |
7664.640 |
PRESS RELEASE
STRONG PIPE SALES AND
PROFITABILITY
Mumbai, 06th August 2013: Welspun Corp Limited (WCL) the flagship Company of the $3.5 billion Welspun
Group, announced its financial results for 1st Quarter FY14.
The company is in the process of demerging its non-pipe business (DRI, Infrastructure, Oil & gas exploration and Energy) into a separate company. The table below summarises the Q1FY14 results of the Global Pipe and Plates business, which will continue in Welspun Corp Limited, post the demerger.
Global Pipes and
Plates Business - Financial Highlights (Figures in Rs. Million)
|
Particulars |
Q1 FY 14 |
Q4 FY 13 |
Q1 FY 13 |
Change % QoQ |
Change % YoY |
|
Sales |
22491 |
28269 |
20014 |
-20% |
12% |
|
Reported EBITDA |
2291 |
3552 |
2220 |
-36% |
3% |
|
Operational EBITDA |
3456 |
2533 |
2971 |
36% |
16% |
|
Finance Cost |
770 |
813 |
929 |
-5% |
-17% |
|
Depreciation/ Amortization |
1007 |
900 |
875 |
12% |
15% |
|
PAT (Adjusted)* |
1205 |
1341 |
1329 |
-10% |
-9% |
|
Cash PAT |
2242 |
2939 |
2180 |
-24% |
3% |
* Adjusted for unrealized foreign exchange provision of Rs.1,447 million booked in Q1FY14; corresponding figure was gain of Rs. 51 million in Q4FY13 provision of Rs.1,328 million in Q1FY13. Total forex loss (realised + unrealised) for the quarter was Rs.1,812 million in Q1FY14.
The table below summarises the consolidated Q1 FY14 results of the company, including the businesses which will be demerged.
Sales
- Consolidated Sales at Rs. 26,757 million (Rs.33,164 million). While pipe sales continued to be high, plate sales were lower as production is only on need basis
- Total Pipes sales volume of 308K MT (363K MT) and total pipe production of 320K MT (355K MT)
- Plates sales volume of 46K MT (109K MT) and total plate production was 22K MT (121K MT)
Operational EBITDA for Q1 FY14
- Pipes EBITDA – Rs. 3,355 million (Rs. 2,831 million).
- Improvement in profitability across regions
- Saudi plant at optimal utilization levels driving EBITDA higher
- Plates EBITDA – Rs. 100 million (Rs. -298 million).
- Only profitable orders being booked and executed currently at the plant
- Infra EBITDA - Rs. 168 million (Rs. 280 million).
- DRI (Maxsteel) EBITDA - Rs. -14 million (Rs. -192 million).
Other items:
- The Company has made a foreign exchange provision of Rs. 2,045 million in Q1 FY14 which has impacted the reported figures.
- Finance Costs - Rs 1,264 million (Rs 1,156 million), increase was largely on account of translation of foreign currency interest payments
- Depreciation – Rs 1,252 million (Rs. 1,527 million). Q4FY13 was higher on account of retrospective change in accounting policy of cash subsidy received on BOT projects
- The consolidated net debt position stands at Rs. 36,610 million for Q1 FY14 (compared to Rs 31,235 million in Q4 FY13), while the net worth of the Company is Rs. 54,313 million resulting in net debt: equity of 67%.
Production and Sales
in K MT
|
Production Volume
(in K MT) |
Q1 FY 14 |
Q4 FY 13 |
Q1 FY 13 |
|
Total Pipes Consolidated |
320 |
355 |
217 |
|
Plates & Coils |
22 |
121 |
150 |
|
|
|
|
|
|
Sales Volume (in K
MT) |
Q1 FY 14 |
Q4 FY 13 |
Q1 FY 13 |
|
Total Pipes Consolidated |
308 |
363 |
178 |
|
Plates and Coils* |
46 |
109 |
148 |
* Includes internal sales
Order Book position
- The current pipe order book stands at Rs. 47 billion comprising of 691 K MT of international and domestic orders.
- The Infrastructure business has a cumulative current order book position of Rs. 39,142 million.
Business Outlook
- The outlook for the pipe business continues to be challenging. While there are some key large scale projects in the pipeline, margins have been under pressure. The Americas, Middle East and Europe will be the key regions which will drive demand in the medium term.
- The Plates, DRI (Maxsteel) and Infra businesses continue to face challenging business environment.
Management comments
Commenting on the
results, Mr. B. K. Goenka, Chairman, Welspun said, “The pipes business
continues to perform well in spite of the challenging environment. Our strong
global presence has ensured that we continue to win orders, while maintaining
profitability. The new US HFIW mill will help us to capitalise better on the
shale gas opportunity in North America. Welspun’s recent entry into the
European market will open up further opportunities. Our new organizational
structure in the pipes business, based on geographical business units with
independent heads, will enhance our marketing capabilities and customer
servicing, propelling our growth.”
WELSPUN CORP LIMITED
SUCCESSFULLY CONCLUDED RS 900.000 MILLIONS
Mumbai, November 9, 2012: Welspun Corp Limited (WCL), the 2nd largest (Large Diameter)
Pipe Company in the World (Source: Financial Times, UK), and the flagship Company of the $3.5 billion Welspun Group has informed the stock exchange today that it has successfully concluded the placement of AA(-) rate secured Redeemable Non convertible Debentures (NCD’s). WCL raised Rs. 900.000 millions NCD’s with average maturity of 9 years. The NCD’s were raised (excluding issue expense) at a coupon of 11% p.a. without any put/call option. The issue was dual rated at AA (-) thus affirming that the instruments with this rating are considered to have high degree of safety regarding timely servicing of financial obligations.
The NCD’s was placed amongst financial institutions.
|
ENTITY |
PERSON |
COMPETENT AUTHORITY |
REGULATORY
CHARGES |
REGULATORY
ACTION(S) / DATE OF ORDER |
FURTHER
DEVELOPMENTS |
|
WELSPUN-GUJARAT STAHL ROHREN LIMITED |
|
SEBI |
INDULGED IN CREATION OF ARTIFICIAL MARKET AND PRICE MANIPULATION TO INFLUENCE PRICE UPWARDS DURING PRICING PERIOD OF FCCB OF ACKRUTI CITY LIMITED,WELSPUN STAHL- ROHREN LIMITED,BRUSHMAN (INDIA) LIMITED,RPG TRANSMISSION LIMITED AND MURLI INDUSTRIES LIMITED |
DIRECTED BSE AND NSE TO PERMIT MEMBERS TO SQUARE OFF THEIR
EXISTING OPEN POSITIONS IF ANY, IN F&O SEGMENT AND ENSURE THAT NO FRESH
POSITIONS ARE CREATED |
DIRECTED VIDE ORDER DATED 05/02/2011 (1) NOT TO DISPOSED
OFF OR ALIENATE SHARES BELONGING TO VARIOUS SCRIPS. (2)NSDL TO FREEZE SHARES
LYING IN THE ACCOUNT OF IFSL. (3) BACKGROUND PURPOSE AND OTHER ATTENDANT
CIRCUMSTANCES RELATING TO OFF-MARKET TRANSFERS FROM THE ACCOUNT OF PCSL TO
IFSL AND SUBSEQUENT PART SALE OF TRANSFERRED SHARES SHALL BE INVESTIGATED |
|
WELSPUN-GUJARAT STAHL ROHREN LIMITED |
|
SEBI |
INDULGED IN CREATION OF ARTIFICIAL MARKET AND PRICE MANIPULATION TO INFLUENCE PRICE UPWARDS DURING PRICING PERIOD OF FCCB OF ACKRUTI CITY LIMITED,WELSPUN STAHL- ROHREN LIMITED,BRUSHMAN (INDIA) LIMITED,RPG TRANSMISSION LIMITED AND MURLI INDUSTRIES LIMITED |
DIRECTED BSE AND NSE TO PERMIT MEMBERS TO SQUARE OFF THEIR
EXISTING OPEN POSITIONS IF ANY, IN F&O SEGMENT AND ENSURE THAT NO FRESH
POSITIONS ARE CREATED |
DIRECTED VIDE ORDER DATED 05/02/2011 (1) NOT TO DISPOSED
OFF OR ALIENATE SHARES BELONGING TO VARIOUS SCRIPS. (2)NSDL TO FREEZE SHARES
LYING IN THE ACCOUNT OF IFSL. (3) BACKGROUND PURPOSE AND OTHER ATTENDANT CIRCUMSTANCES
RELATING TO OFF-MARKET TRANSFERS FROM THE ACCOUNT OF PCSL TO IFSL AND
SUBSEQUENT PART SALE OF TRANSFERRED SHARES SHALL BE INVESTIGATED |
|
WELSPUN-GUJARAT STAHL ROHREN LIMITED |
|
SEBI |
INDULGED IN CREATION OF ARTIFICIAL MARKET AND PRICE MANIPULATION TO INFLUENCE PRICE UPWARDS DURING PRICING PERIOD OF FCCB OF ACKRUTI CITY LIMITED,WELSPUN STAHL- ROHREN LIMITED,BRUSHMAN (INDIA) LIMITED,RPG TRANSMISSION LIMITED AND MURLI INDUSTRIES LIMITED |
DIRECTED BSE AND NSE TO PERMIT MEMBERS TO SQUARE OFF THEIR
EXISTING OPEN POSITIONS IF ANY, IN F&O SEGMENT AND ENSURE THAT NO FRESH
POSITIONS ARE CREATED |
DIRECTED VIDE ORDER DATED 05/02/2011 (1) NOT TO DISPOSED
OFF OR ALIENATE SHARES BELONGING TO VARIOUS SCRIPS. (2)NSDL TO FREEZE SHARES
LYING IN THE ACCOUNT OF IFSL. (3) BACKGROUND PURPOSE AND OTHER ATTENDANT
CIRCUMSTANCES RELATING TO OFF-MARKET TRANSFERS FROM THE ACCOUNT OF PCSL TO
IFSL AND SUBSEQUENT PART SALE OF TRANSFERRED SHARES SHALL BE INVESTIGATED |
|
WELSPUN-GUJARAT STAHL ROHREN LIMITED |
|
SEBI |
INDULGED IN CREATION OF ARTIFICIAL MARKET AND PRICE MANIPULATION TO INFLUENCE PRICE UPWARDS DURING PRICING PERIOD OF FCCB OF ACKRUTI CITY LIMITED,WELSPUN STAHL- ROHREN LIMITED,BRUSHMAN (INDIA) LIMITED,RPG TRANSMISSION LIMITED AND MURLI INDUSTRIES LIMITED |
DIRECTED BSE AND NSE TO PERMIT MEMBERS TO SQUARE OFF THEIR
EXISTING OPEN POSITIONS IF ANY, IN F&O SEGMENT AND ENSURE THAT NO FRESH
POSITIONS ARE CREATED |
DIRECTED VIDE ORDER DATED 05/02/2011 (1) NOT TO DISPOSED
OFF OR ALIENATE SHARES BELONGING TO VARIOUS SCRIPS. (2)NSDL TO FREEZE SHARES
LYING IN THE ACCOUNT OF IFSL. (3) BACKGROUND PURPOSE AND OTHER ATTENDANT
CIRCUMSTANCES RELATING TO OFF-MARKET TRANSFERS FROM THE ACCOUNT OF PCSL TO
IFSL AND SUBSEQUENT PART SALE OF TRANSFERRED SHARES SHALL BE INVESTIGATED |
PERFORMANCE
Production and processing highlights for the year under report on standalone basis are as under:
- Pipes: 631,133 MT (473,617 MT).
- Plates: 260,247 MT (399,135 MT). This shows lesser indigenous procurement of plates for manufacturing.
- H.R. Coils: 209,546 MT (107,880 MT). This shows more indigenous procurement of coils for manufacturing.
- Coating: 4,142 K sqm (2,096 K sqm). This shows more demand for coated pipes.
- Power: 122,585 MWH (173,117 MWH).
Depreciation charge for the year under Report increased as compared to the previous year mainly due to capitalization of Offline Pipeline Project at Mandya in Karnataka; full year depreciation effect in respect of LSAW Plant and on increased capital expenditure for enhancing productivity / debottlenecking at Plate and Coil Mill at Anjar.
Finance Costs increased mainly on account of interest on increased borrowings in the form of the External Commercial Borrowings and the Non-Convertible Debentures borrowed/ issued during the year under report and charging of interest on foreign currency convertible bonds which were capitalized earlier as per Accounting Standard 16 on borrowing cost.
Exceptional Items of Rs. 538.20 million is the write off of loan given to Welspun Natural Resources Private Limited (a wholly owned subsidiary of the Company) for contributing the Company’s share in the expenditure for Thailand Block of the joint venture Company viz. Adani Welspun Exploration Limited, which has been relinquished during the year after seismic studies and carrying out detailed diligence.
THE COMPANY OVERVIEW
Subject is one of the largest players globally in the large diameter line pipe segment. The Company has emerged as one of the leading names in the industry over the last 15 years and today offers a ‘one stop solution’ in line pipes with its wide product range and specifications. It has modern state-of-the-art global manufacturing facilities in India, USA and Saudi Arabia for Longitudinal (LSAW), Spiral (HSAW) and ERW/HFIW pipes, with its products manufactured under strict quality standards. Not only does Welspun’s list of clients include some of the biggest names from the Oil and Gas sectors, but the Company is also well known for supplying line pipes to some of the most challenging projects in the world like Deepest Pipe line, Longest Pipe Line, Heaviest Pipe line and Highest Pipe line.
The Company exports pipes to the global market including some of the most demanding markets in terms of quality and innovation, like the US and Middle East. With marketing offices in Houston (USA), Dubai (UAE), and Dammam (Saudi Arabia), the Company has established a strong presence in some of the key markets and is able to satisfy existing customers, and reach out to newer customers as well. The Company has become an approved supplier to over 50 major oil and gas companies across the world. This enables the Company to participate and bid in key projects across the world.
GLOBAL ECONOMIC
OVERVIEW
The global economic environment continued to be challenging in FY13. Global economic growth was harder to come by than anticipated, with growth in CY12 reported at 3.2 percent as against International Monetary Fund (IMF) projections of 3.5 percent in early 2012. This also implied a slowdown from the 4.0 per cent growth witnessed in CY11. The key challenges to more widespread global economic growth included a prolonged Euro zone crisis; and slowing growth in emerging economies on account of a sharp deceleration in demand from key advanced economies, domestic policy tightening, and the end of investment booms in some of the major emerging market economies. One of the key exceptions to the slowdown trend was the US economy which grew faster than in CY11, thanks to a strengthening private sector.
GLOBAL ENERGY DEMAND
The global energy landscape is changing, with potentially far-reaching consequences for energy markets and trade. It is being mapped by the resurgence in oil and gas production in the United States and could be further reshaped by a retreat from nuclear power in some countries, continued rapid growth in the use of wind and solar technologies and by the global spread of unconventional gas production. Increasing policy focus on energy efficiency in various countries is expected to be a game changer for the energy industry.
Global energy demand is expected to increase by over one‐third in the period to 2035. Emerging economies are expected to be at the forefront to drive global energy markets with the share of non‐OECD energy demand rising from 55% in 2010 to 65% in 2035. China would account for the largest share of the growth in global energy use, with its demand rising 60% by 2035, followed by India (where demand is expected to more than double) and the Middle East. OECD energy demand in 2035 is predicted to be just 3% higher than in 2010, but there are dramatic shifts in its energy mix as fuel substitution will see the collective share of oil and coal drop by fifteen percentage points to 42%.
Fossil fuels remain the principal sources of energy worldwide, though renewable energy is expected to grow rapidly. Demand for oil, gas and coal will grow in absolute terms through 2035, but their combined share of the global energy mix has been calculated to fall from 81% to 75% during that period. The unlocking of unconventional resources portends a very bright future for natural gas and is expected to overtake coal in the primary energy supply mix by 2035.
An energy renaissance in the United States is redrawing the global energy map, with implications for energy markets and trade. The United States, which currently imports around 20% of its total energy needs, is on its way to become self‐sufficient in net terms by 2035 thanks to rising production of oil, shale gas and bio-energy, and improved fuel efficiency in transport. Falling US oil imports mean that North America will become net oil exporter by approximately 2030, accelerating the ongoing shift in the international oil trade towards Asian markets, putting greater focus on the security of strategic routes that link them to the Middle East.
GLOBAL GAS SCENARIO
While the regional picture for natural gas varies, the global outlook over the coming decades looks to be bright, as demand increases by 50% to 169 trillion cubic feet in 2035. Unconventional gas accounts for nearly half of the increase in global gas production to 2035, with most of the increase coming from China, the United States and Australia. But the unconventional gas business is still in its formative years, with uncertainty in many countries about the extent and quality of the resource base and concerns about the environmental impact of production. Public confidence can be underpinned by robust regulatory frameworks and exemplary industry performance. By bolstering and diversifying sources of supply, tempering demand for imports (as in China) and fostering the emergence of new exporting countries (as in the United States), unconventional gas can accelerate movement towards more diversified trade flows, putting pressure on conventional gas suppliers and on traditional oil linked pricing mechanisms for gas.
NATURAL GAS
Global growth in natural gas use slowed in 2012 (2.0% vs. average of 2.8% in the past decade), although it still exceeded that of oil and total energy use. Among the headwinds facing gas are continuing weak demand in Europe, resilience of coal in North America as well as persistent bottlenecks and disruptions in the LNG value chain that in 2012 caused an exceptional global decline of LNG supply. At the same time, Asian demand for gas remains red-hot, and gas is beginning to gain traction as a transport fuel.
Natural Gas consumption was 111 trillion cubic feet in 2008 and would reach 169 trillion cubic feet by 2035 as per IEA estimates. The natural gas supply is becoming larger and is getting spread over many regions and locations, which shall continue to fuel the demand for pipeline infrastructure. Natural gas is the world's fastest-growing fossil fuel, with consumption expected to increase at an average rate of 1.6% per year from 2008 to 2035. Growth in consumption occurs in every region and is most concentrated in Non-OECD countries, where demand increases nearly three times as fast as in OECD countries. Increases in production in the Non-OECD regions more than meet their projected consumption growth, and as a result Non-OECD exports to OECD countries will grow through 2035. Non-OECD producers will account for more than 81 % of the total growth in world natural gas production from 2008 to 2035.
The largest production increases from 2008 to 2035 are projected for the Middle East (15.3 trillion cubic feet) and non-OECD Asia (11.8 trillion cubic feet). Iran and Qatar increase natural gas production by a combined 10.7 trillion cubic feet, or nearly one-fifth of the total increment in world gas production.
SHALE GAS
Shale gas has become an increasingly important source of natural gas and crude oil in not just the United States over the past decade, but also in other parts of the world like Canada, Europe, Asia and Australia. Shale gas has been referred to as “the biggest energy innovation of the decade” by world renowned energy economist Mr. Daniel Yergin.
The Initial assessment of shale gas resources in 48 major shale basins in 32 countries indicates a large potential of Shale gas finds all across the globe.
An analysis in the US Annual Energy Outlook 2013 indicates Shale gas production, which grows by 113 percent from 2011 to 2040, is the greatest contributor to natural gas production growth. Its share of total production increases from 34 percent in 2011 to 50 percent in 2040. Tight gas and coal-bed methane production also increase, by 25 percent and 24 percent, respectively, from 2011 to 2040, even as their shares of total production decline slightly. The growth in coalbed methane production is not realized until after 2035, when natural gas prices and demand levels are high enough to spur more drilling.
The availability of large shale gas reserves in the US has led some to propos e natural gas-fired power plants as lower-carbon emission replacements for coal plants, and as backup power sources for wind energy.
NATURAL GAS SCENARIO
– INDIA
Natural Gas contributes to about 10 per cent to the primary energy mix of the country, as compared to the global average share of gas of 24 per cent. With the country's primary energy consumption growing over 4% CAGR and natural gas expected to increase its share in the total energy mix, natural gas demand is expected to grow at more than 5% in the 13th five-year plan period.
Although the gas production in domestic fields has been falling in recent years, it is expected to pick up in coming years due to the recent policy changes in gas prices. The significant increase in gas prices from US$4.2/mmbtu to US$ 8.4/mmbtu (expected) from April 2014 should provide impetus for higher domestic production. The prospects for non conventional sources like shale and CBM are still at nascent stages. While four rounds of CBM block allocation has been completed with Raniganj (West Bengal) block starting commercial production to serve clients from the Durgapur-Asansol belt, bidding for shale gas exploration is expected to be launched towards the end of 2013. ONGC and OIL are aggressively implementing pilot projects to assess the shale gas potential in the country while Reliance Industries Limited (RIL) and GAIL have entered the US shale industry to gain technical expertise and may apply that expertise in developing shale gas reserves in India.
Import of gas is also expected to go up in spite of the anticipated increase in domestic production. Currently, more than a quarter of India's gas demand is met through LNG imports and spot gas. LNG regasification capacity in India is 12.5 mtpa which is expected to reach around 40-45 mtpa by 2016, if all proposed terminals are commissioned on time.
The $ 7.6 billion Turkmenistan-Afghanistan-Pakistan-India (TAPI) gas pipeline for supplying 3.2 billion cubic feet of natural gas per day, has already finalized the Gas Sale Purchase Agreement (GSPA) and the transit fee with all the participating countries. Gas Authority of India Limited (GAIL) has also tied up to commence shale gas imports from 2016-17 from the US. Under the initial contracts, the fuel is estimated to be priced at $10-11 per mmbtu. These developments are expected to accelerate the market share of natural gas in the country's energy mix.
GLOBAL STEEL PIPE
INDUSTRY
2012-13 was a challenging year for the global pipe industry. In the year, the industry continued to be characterized by excess capacity and low utilization levels. Part of the reason was a slowdown in oil and gas demand in Europe triggered by the economic crisis there. It was further exacerbated by end of some large projects as well as uncertainty in certain upcoming projects.
However, the outlook for the industry looks brighter. The global pipeline demand as per Simdex for the projects starting from 2013 to 2017 is about 673 projects resulting in an opportunity for supplies of more than US$ 356 billion across geographies as presented in Figure 14 Several large projects are in an advanced stage, which should convert to orders over the next couple of years.
WELSPUN’S FY13
HIGHLIGHTS
All Time high Sales ,
Production volume
The Company has achieved all time high sales and production volume of over 1 mn ton in FY13. This is despite the fire in the Little Rock facility in July 12, which disrupted close to 3 months of production. Sales volumes picked up in the second half of the year as the company executed a significant portion of its strong order book. Despite the challenging environment, the company managed to deliver performance as guided.
Strong order book
position at Rs. 52,140 million; Outstanding pipe order book over 757 K MT; Over
1 mn tonnes of orders booked during the year
The order book stands at stands at Rs. 52,140 million (US$ 956 million), 757 K MT in pipes as on 30th May 2013. 80% of pipe orders are from export markets like North America, Middle East, Europe, North Africa and South East Asia. During the financial year, the company has booked new orders over more than 1 mn tonne in Pipes. This demonstrates the Company’s leadership position in challenging market conditions, thanks to its quality and track record.
Completed the New
HFIW Mill at Little Rock, Arkansas USA and received the API certification
The boom in Shale gas in the US has spurred potential demand for small diameter pipes. To address this strong demand growth in the HFIW line pipe segment in North America, the Company has commissioned 175,000 MTPA HFIW mill and Coating Plant in Little Rock, US. The mill, which has already received the API certification, is likely to ramp up to optimal utilization in FY14.
Capacity addition in
Mandya, to cater the Domestic Water Pipe Demand
The Company has also completed the capacity expansion of 50,000 MTPA in Mandya this year taking the total capacity of the plant to 1,50,000 MTPA. The plant is primarily meant to cater to the water pipeline demand in India.
Saudi Plant receives
approvals from one of its large O and G customers
During the year the Company has received approval from Saudi Aramco, one of the oil and gas giants in the Middle East and one of the key clients for the pipe facility in Dammam. This has translated to significant orders from the client resulting in the Saudi facility moving towards optimal utilization levels.
World leader in line
pipe capacity
The Company’s total Global pipe capacity has reached 2.425 million MTPA with the commissioning of additional HSAW capacity in Mandya and HFIW capacity at Little Rock Arkansas. The LSAW line pipe capacity is at 0.70 million MTPA catering to the growing market of the deep offshore projects across the globe. With the Company’s investment in the Kingdom of Saudi Arabia in FY11 and the expansion at Mandya, the HSAW line pipe capacity today stands at 1.35 million MTPA. The current global capacity distribution of the Company is shown in Figure 20.
Expanded Global Reach
The Company has today its global presence in India, US and Saudi Arabia through its manufacturing facilities and marketing offices in Dubai and Houston. This helps the Company to be closer to the customers and provide them end to end pipe solutions. The Company serves clients in more than 30 countries globally.
Reorganisation of the
pipes business structure
For enhancing marketing capabilities and customer servicing, the management has reorganized the pipes business into a geographic business unit structure. Three business units- the Americas; Middle East, Africa and Europe; and India and APAC, have been formed to ensure focussed attention on major markets and clients. Each unit, under an independent Business Unit Head reporting to the MD, would own the marketing as well as production of pipes for their respective geographies. In order to accelerate entry into unexplored markets, an exploratory business unit “New markets” has also been formed, aimed at penetrating the untapped potential evident in these markets. These business units, three geographic and one exploratory, would be supported by global support organizations namely - Supply Chain, Quality, Technical, Human Resource and Finance.
Conversion of CCDs’
issued to Granele Limited in FY 12
The Compulsorily Convertibles Debenture (CCD’s) issued to Granele Limited in FY12 was fully converted to equity share at the pre determined price of Rs.225 per share during the year on February 18 2013. This represents 12.22% of the fully diluted equity capital of the Company. The CCD’s carried a coupon of 5% which was paid to Granele Limited on the conversion.
Buyback of FCCB’s of
USD 68.5 mn out of total of USD 150 mn
The Company has successfully bought back its Foreign Currency Convertible Bonds (FCCB) worth USD 68.5 mn out of USD 150 mn during the year in two tranches of USD 44.1 mn in October 2012 and USD24.4 mn in March 2013 at and earned as average discount of 7.4% on the accreted value of the bonds. This buyback has resulted an average USD yield of ~10%. The FCCB outstanding of USD 81.5 mn, is due in October 2014.
CONTINGENT
LIABILITIES
|
Contingent
liabilities |
As on 31.03.2013 |
|
Performance guarantees/Bid bond given by banks to company’s customers / government authorities etc. |
15630.870 |
|
Corporate guarantees given by the company (includes Rs.11998.220 million (Rs.6427.230 million)) for Loans/Liabilities taken by the subsidiaries. Loans /Liabilities outstanding against these guarantees are Rs.1772.890 million (Rs. 3172.340 million) |
18203.960 |
|
Letters of credit outstanding (net of liability provided) for company’s sourcing |
4087.020 |
|
Claims against the Company not acknowledged as debts |
450.540 |
|
Custom duty on pending export obligation against import of Raw Materials |
1387.250 |
|
Disputed direct taxes* |
2009.470 |
|
Disputed indirect taxes** |
100.730 |
*Income tax demands mainly include appeals filed by the Company before appellate authorities against disallowances i.e. depreciation/claims/deductions. The management is of the opinion that its tax disputes will be decided in its favour and no material tax liability is likely to be sustained, hence no provision is considered necessary.
**Demand notice received during the year for duty evasion of Rs. 8,609.820 million on account of alleged wrong classification of imported raw materials along with penalty of Rs. 8,609.820 million and penalty of Rs. 205.000 million on directors and officers of the company. In the opinion of management, without prejudice to overall merits, in any case Rs. 6,706.600 million is cenvatable duty which is revenue neutral and may not result into recoverable demand and accordingly relevant amount of penalty may not sustain. The matter is under dispute with appellate authority and thus whole amount of duty and penalty referred above is not considered as contingent liability.
INDEX OF CHARGES
|
S.No. |
Charge ID |
Date of Charge
Creation/Modification |
Charge amount
secured |
Charge Holder |
Address |
Service Request
Number (SRN) |
|
1 |
10449706 |
07/09/2013 |
2,171,400,000.00 |
IDBI TRUSTEESHIP SERVICES LIMITED |
ASIAN BUILDING, GROUND FLOOR, 17, R. KAMANI MARG, |
B85180818 |
|
2 |
10428917 |
14/05/2013 |
2,175,600,000.00 |
IDBI TRUSTEESHIP SERVICES LIMITED |
ASIAN BLDG., GROUND FLOOR, 17, R. KAMANI MARG, BALLARD ESTATE, MUMBAI, MAHARASHTRA - 400001, INDIA |
B76197706 |
|
3 |
10406011 |
19/02/2013 |
1,650,000,000.00 |
IDBI TRUSTEESHIP SERVICES LIMITED |
ASIAN BLDG., GROUND FLOOR, 17, R. KAMANI MARG, BALLARD ESTATE, MUMBAI, MAHARASHTRA - 400001, INDIA |
B68912336 |
|
4 |
10413075 |
21/01/2013 |
900,000,000.00 |
IDBI TRUSTEESHIP SERVICES LIMITED |
ASIAN BLDG., GROUND FLOOR, 17, R. KAMANI MARG, BALLARD ESTATE, MUMBAI, MAHARASHTRA - 400001, INDIA |
B67024976 |
|
5 |
10393281 |
09/11/2012 |
2,528,000,000.00 |
IDBI TRUSTEESHIP SERVICES LIMITED |
ASIAN BUILDING, GROUND FLOOR, 17, R. KAMANI MARG, |
B61857488 |
|
6 |
10385714 |
08/11/2012 |
816,000,000.00 |
EXPORT-IMPORT BANK OF INDIA |
CENTRE ONE BUILDING, FLOOR 21, WORLD TRADE CENTRE, |
B61818332 |
|
7 |
10385715 |
08/11/2012 |
1,360,000,000.00 |
EXPORT-IMPORT BANK OF INDIA |
CENTRE ONE BUILDING, FLOOR 21, WORLD TRADE CENTRE, |
B61818449 |
|
8 |
10246969 |
07/06/2011 * |
10,000,000,000.00 |
IDBI TRUSTEESHIP SERVICES LIMITED |
ASIAN BLDG., GROUND FLOOR, 17, R. KAMANI MARG, BALLARD ESTATE, MUMBAI, MAHARASHTRA - 400001, INDIA |
B17438524 |
|
9 |
10128701 |
10/10/2008 |
2,500,000,000.00 |
CANARA BANK |
DALAMAL TOWERS, B WING, 1ST FLOOR, 101, FREE PRESS JOURNAL MARG, NARIMAN POINT, MUMBAI, MAHARASHTRA - 400021, INDIA |
A49670318 |
|
10 |
10135059 |
01/10/2008 |
250,000,000.00 |
BANAK OF BARODA |
CORPORATE SERVICE BRANCH, WALCHAND HIRACHAND MARG, |
A50988716 |
|
11 |
10109394 |
07/07/2008 * |
6,000,000,000.00 |
IDBI TRUSTEESHIP SERVICES LIMITED |
ASIAN BLDG., GROUND FLOOR, 17, R. KAMANI MARG, BALLARD ESTATE, MUMBAI- 400 001, MAHARASHTRA - 400001, INDIA |
A41185323 |
|
12 |
10090903 |
14/03/2008 |
6,000,000,000.00 |
IDBI TRUSTEESHIP SERVICES LIMITED |
ASIAN BLDG., GROUND FLOOR, 17, R. KAMANI MARG, BALLARD ESTATE, MUMBAI- 400 001., MAHARASHTRA - 400001, INDIA |
A33847674 |
|
13 |
10006683 |
16/03/2013 * |
69,710,000,000.00 |
IDBI TRUSTEESHIP SERVICES LIMITED |
ASIAN BLDG., GROUND FLOOR, 17, R. KAMANI MARG, BALLARD ESTATE, MUMBAI, MAHARASHTRA - 400001, INDIA |
B72587421 |
|
14 |
80019253 |
23/08/2005 * |
18,278,400,000.00 |
BANKOFBARODA |
INDUSTRIAL FINANCE BRANCH, CAWASJI PATEL STREET, MUMBAI, MAHARASHTRA - 400001, INDIA |
- |
|
15 |
90102265 |
02/06/2003 |
50,000,000.00 |
ORIENTAL BANK OF COMMERCE |
CORPORATE GROUP FINANCE BRANCH, 181--A ; MAKER TOWER E 18 FLOOR CUFFE PARADE, MUMBAI, MAHARASHTRA -400005, INDIA |
- |
|
16 |
90102229 |
22/09/2003 * |
27,000,000.00 |
CENTRAL BANK OF INDIA |
C.BRANCH, MUMBAI, MAHARASHTRA, INDIA |
- |
|
17 |
80019214 |
15/03/2005 * |
27,000,000.00 |
CENTRALBANKOFINDIA |
CHURCHGATE BRANCH, MUMBAI, MAHARASHTRA - 400001, INDIA |
- |
|
18 |
90102227 |
26/04/2004 * |
153,400,000.00 |
ORIENTAL BANK OF COMMERCE |
CORPORATE GROUP FINANCE BRANCH 181--A, MAKER TOWER E 18 FLOOR CUFFE PARADE, MUMBAI, MAHARASHTRA - 400005, INDIA |
- |
|
19 |
80019216 |
15/03/2005 * |
153,400,000.00 |
ORIENTALBANKOFCOMMERCE |
CORPORATE GROUP FINANCE BRANCH, 181-A MAKER TOWER |
- |
|
20 |
90102226 |
18/12/2002 |
10,183,000.00 |
BANK OF BARODA |
INDUSTRIAL FINANCE BRANCH 42; CAWAJI PATEL STREET, MUMBAI, MAHARASHTRA - 400023, INDIA |
- |
|
21 |
80019211 |
15/03/2005 * |
10,183,000.00 |
BANKOFBARODA |
INDUSTRIAL FINANCE BRANCH, 42, CAWASJI PATEL STREET, MUMBAI, MAHARASHTRA - 400023, INDIA |
- |
|
22 |
80019257 |
03/06/2005 * |
21,934,100,000.00 |
BANKOFBARODA |
INDUSTRIAL FINANCE BRANCH, CAWASJI PATEL STREET, MUMBAI, MAHARASHTRA - 400001, INDIA |
- |
|
23 |
90102096 |
23/07/2001 * |
60,000,000.00 |
PUNJAB NATIONAL BANK |
IIIACO HOUSE ; P.M. ROAD FORT, MUMBAI, MAHARASHTRA - 400023, INDIA |
- |
|
24 |
90102030 |
03/07/2000 |
29,500,000.00 |
PUNJAB NATIONAL BANK |
ILLACO HOUSE, P.M. ROAD FORT, MUMBAI, MAHARASHTRA - 400023, INDIA |
- |
|
25 |
80019234 |
12/08/2002 * |
3,050,300,000.00 |
BANKOFBARODA |
INDUSTRIAL FINANCE BRANCH, CAWASJI PATEL STREET, MUMBAI, MAHARASHTRA - 400001, INDIA |
- |
|
26 |
80019184 |
04/10/1999 * |
131,000,000.00 |
BANKOFBARODA |
INDUSTRIAL FINANCE BRANCH, CAWASJI PATEL STREET, MUMBAI, MAHARASHTRA - 400001, INDIA |
- |
* Date of charge modification
Fixed Assets:
- Land and Buildings
- Plant and Machinery
- Office and other Equipments
- Furniture and Fixtures
- Leasehold Improvements
AS PER WEBSITE
PRESS RELEASE
WELSPUN TO EXIT FROM
JV WITH LEIGHTON FOR USD 99MN
December 30, 2013
Pipe maker Welspun Corp Limited (WCL) has decided to exit from its joint venture with Leighton Group by selling its entire 39.88 per cent stake for a net cash consideration of USD 99 million (Rs 6140.000 Millions). The company has entered into a pact with Leighton Group to sell the stake its subsidiary Welspun Infra Projects Private Limited (WIPPL) had in Leighton Welspun Contractors India Private Limited (LWIN), WCL said in a statement today.
"With this sale, LWIN will be renamed as Leighton India," it said adding the decision to exit LWIN was aimed at repositioning itself in the infrastructure space. WCL had in 2011 acquired 35 percent stake in LWIN for cash consideration of Rs 4700.000 Millions to cash in on opportunities in the Indian infrastructure sector especially Public-Private-Partnership projects.
Also Read: Welspun
Corp reports Rs 337.700 Millions loss in Q2
It bought additional stakes in the firm subsequently in a cash-less transaction worth Rs 1150.000 Millions. LWIN was established in 2010. "The net proceeds received by Welspun will primarily be utilised to deleverage its balance-sheet. Welspun Group intends to concentrate on businesses which have potential to give it scale consistent with its quest for being in leadership position," it said.
The transaction would be completed in the first quarter of 2014 once the procedural conditions are met. WCL is currently in four businesses - line pipes, energy, infrastructure and steel. It has already started streamlining its existing business structure.
Welspun Corp stock
price
On April 17, 2014, Welspun Corp closed at Rs 76.85, down Rs 1.2, or 1.54 percent. The 52-week high of the share was Rs 84.40 and the 52-week low was Rs 26.65.
The latest book value of the company is Rs 166.78 per share. At current value, the price-to-book value of the company was 0.46.
CMT REPORT (Corruption, Money Laundering & Terrorism]
The Public Notice information has been collected from various sources
including but not limited to: The Courts,
1] INFORMATION ON
DESIGNATED PARTY
No exist designating subject or any of its beneficial owners,
controlling shareholders or senior officers as terrorist or terrorist organization
or whom notice had been received that all financial transactions involving
their assets have been blocked or convicted, found guilty or against whom a
judgement or order had been entered in a proceedings for violating
money-laundering, anti-corruption or bribery or international economic or
anti-terrorism sanction laws or whose assets were seized, blocked, frozen or
ordered forfeited for violation of money laundering or international
anti-terrorism laws.
2] Court Declaration :
No exist to suggest that subject is or was
the subject of any formal or informal allegations, prosecutions or other
official proceeding for making any prohibited payments or other improper
payments to government officials for engaging in prohibited transactions or
with designated parties.
3] Asset Declaration :
No records exist to suggest that the property or assets of the subject
are derived from criminal conduct or a prohibited transaction.
4] Record on Financial
Crime :
Charges or conviction
registered against subject: None
5] Records on Violation of
Anti-Corruption Laws :
Charges or
investigation registered against subject: None
6] Records on Int’l
Anti-Money Laundering Laws/Standards :
Charges or
investigation registered against subject: None
7] Criminal Records
No
available information exist that suggest that subject or any of its principals
have been formally charged or convicted by a competent governmental authority
for any financial crime or under any formal investigation by a competent government
authority for any violation of anti-corruption laws or international anti-money
laundering laws or standard.
8] Affiliation with
Government :
No record
exists to suggest that any director or indirect owners, controlling
shareholders, director, officer or employee of the company is a government
official or a family member or close business associate of a Government
official.
9] Compensation Package :
Our market
survey revealed that the amount of compensation sought by the subject is fair
and reasonable and comparable to compensation paid to others for similar
services.
10] Press Report :
No press reports / filings exists on
the subject.
CORPORATE GOVERNANCE
MIRA INFORM as part of its Due Diligence do provide comments on
Corporate Governance to identify management and governance. These factors often
have been predictive and in some cases have created vulnerabilities to credit
deterioration.
Our Governance Assessment focuses principally on the interactions between
a company’s management, its Board of Directors, Shareholders and other
financial stakeholders.
CONTRAVENTION
Subject is not known to have contravened any existing local laws,
regulations or policies that prohibit, restrict or otherwise affect the terms
and conditions that could be included in the agreement with the subject.
FOREIGN EXCHANGE RATES
|
Currency |
Unit
|
Indian Rupees |
|
US Dollar |
1 |
Rs.60.05 |
|
|
1 |
Rs.101.32 |
|
Euro |
1 |
Rs.83.34 |
INFORMATION DETAILS
|
Information
Gathered by : |
NYA |
|
|
|
|
Analysis Done by
: |
DIV |
|
|
|
|
Report Prepared
by : |
NTH |
SCORE & RATING EXPLANATIONS
|
SCORE FACTORS |
RANGE |
POINTS |
|
HISTORY |
1~10 |
7 |
|
PAID-UP CAPITAL |
1~10 |
7 |
|
OPERATING SCALE |
1~10 |
8 |
|
FINANCIAL CONDITION |
|
|
|
--BUSINESS SCALE |
1~10 |
8 |
|
--PROFITABILIRY |
1~10 |
6 |
|
--LIQUIDITY |
1~10 |
7 |
|
--LEVERAGE |
1~10 |
7 |
|
--RESERVES |
1~10 |
8 |
|
--CREDIT LINES |
1~10 |
7 |
|
--MARGINS |
-5~5 |
- |
|
DEMERIT POINTS |
|
|
|
--BANK CHARGES |
YES/NO |
YES |
|
--LITIGATION |
YES/NO |
NO |
|
--OTHER ADVERSE INFORMATION |
YES/NO |
NO |
|
MERIT POINTS |
|
|
|
--SOLE DISTRIBUTORSHIP |
YES/NO |
NO |
|
--EXPORT ACTIVITIES |
YES/NO |
NO |
|
--AFFILIATION |
YES/NO |
YES |
|
--LISTED |
YES/NO |
YES |
|
--OTHER MERIT FACTORS |
YES/NO |
YES |
|
DEFAULTER |
|
|
|
--RBI |
YES/NO |
NO |
|
--EPF |
YES/NO |
NO |
|
TOTAL |
|
65 |
This score serves as a reference to assess
SC’s credit risk and to set the amount of credit to be extended. It is calculated
from a composite of weighted scores obtained from each of the major sections of
this report. The assessed factors and their relative weights (as indicated
through %) are as follows:
Financial
condition (40%) Ownership
background (20%) Payment record
(10%)
Credit history
(10%) Market trend (10%) Operational size
(10%)
RATING EXPLANATIONS
|
RATING |
STATUS |
PROPOSED CREDIT LINE |
|
|
>86 |
Aaa |
Possesses an extremely sound financial base with the strongest capability
for timely payment of interest and principal sums |
Unlimited |
|
71-85 |
Aa |
Possesses adequate working capital. No caution needed for credit
transaction. It has above average (strong) capability for payment of interest
and principal sums |
Large |
|
56-70 |
A |
Financial & operational base are regarded healthy. General
unfavourable factors will not cause fatal effect. Satisfactory capability for
payment of interest and principal sums |
Fairly Large |
|
41-55 |
Ba |
Overall operation is considered normal. Capable to meet normal
commitments. |
Satisfactory |
|
26-40 |
B |
Capability to overcome financial difficulties seems comparatively
below average. |
Small |
|
11-25 |
Ca |
Adverse factors are apparent. Repayment of interest and principal sums
in default or expected to be in default upon maturity |
Limited with
full security |
|
<10 |
C |
Absolute credit risk exists. Caution needed to be exercised |
Credit not
recommended |
|
-- |
NB |
New Business |
-- |
This report is issued at your request without any
risk and responsibility on the part of MIRA INFORM PRIVATE LIMITED (MIPL)
or its officials.