MIRA INFORM REPORT
|
Report Date : |
08.05.2014 |
IDENTIFICATION DETAILS
|
Name : |
FUJI ACE CO.,
LTD. |
|
|
|
|
Registered Office : |
487/1 Si Ayutthaya
Road, Thanon Phayathai, Ratchathewi, Bangkok
10400 |
|
|
|
|
Country : |
Thailand |
|
|
|
|
Financials (as on) : |
31.03.2013 |
|
|
|
|
Date of Incorporation : |
03.01.1995 |
|
|
|
|
Com. Reg. No.: |
0105538000175 |
|
|
|
|
Legal Form : |
Private Limited Company |
|
|
|
|
Line of Business : |
Engaged in manufacturing, distributing and exporting
of shrink sleeve
labels and flexible
packaging products for
various industries, including
pharmaceuticals, foods &
beverages, cosmetics, consumer
products |
|
|
|
|
No. of Employees |
500 |
RATING & COMMENTS
|
MIRA’s Rating : |
Ba |
|
RATING |
STATUS |
PROPOSED CREDIT LINE |
|
|
41-55 |
Ba |
Overall operation is considered normal. Capable to meet normal
commitments. |
Satisfactory |
|
Status : |
Satisfactory |
|
Payment Behaviour : |
No complaints |
|
Litigation : |
Clear |
NOTES :
Any query related to this report can be made
on e-mail : infodept@mirainform.com
while quoting report number, name and date.
ECGC Country Risk Classification List – March 31, 2014
|
Country Name |
Previous Rating (31.12.2013) |
Current Rating (31.03.2014) |
|
Thailand |
B1 |
B1 |
|
Risk Category |
ECGC
Classification |
|
Insignificant |
A1 |
|
Low Risk |
A2 |
|
Moderately Low Risk |
B1 |
|
Moderate Risk |
B2 |
|
Moderately High Risk |
C1 |
|
High Risk |
C2 |
|
Very High Risk |
D |
THAILAND - ECONOMIC OVERVIEW
With a well-developed
infrastructure, a free-enterprise economy, generally pro-investment policies,
and strong export industries, Thailand achieved steady growth due largely to
industrial and agriculture exports - mostly electronics, agricultural
commodities, automobiles and parts, and processed foods. Unemployment, at less
than 1% of the labor force, stands as one of the lowest levels in the world,
which puts upward pressure on wages in some industries. Thailand also attracts
nearly 2.5 million migrant workers from neighboring countries. The Thai
government in 2013 implemented a nation-wide 300 baht ($10) per day minimum
wage policy and deployed new tax reforms designed to lower rates on
middle-income earners. The Thai economy has weathered internal and external
economic shocks in recent years. The global economic recession severely cut
Thailand's exports, with most sectors experiencing double-digit drops. In late
2011 Thailand's recovery was interrupted by historic flooding in the industrial
areas in Bangkok and its five surrounding provinces, crippling the
manufacturing sector. The government approved flood mitigation projects worth
$11.7 billion, which were started in 2012, to prevent similar economic damage,
and an additional $75 billion for infrastructure over the following seven
years. This was expected to lead to an economic upsurge but growth has remained
slow, in part due to ongoing political unrest and resulting uncertainties.
Spending on infrastructure will require re-approval once a new government is
seated
|
Source
: CIA |
Company
name
FUJI
ACE CO., LTD.
SUMMARY
BUSINESS
ADDRESS : 487/1
SI AYUTTHAYA ROAD,
THANON PHAYATHAI,
RATCHATHEWI, BANGKOK
10400, THAILAND
TELEPHONE : [66] 2246-0828
FAX :
[66] 2246-0829
E-MAIL
ADDRESS : sales@fujiace.com
REGISTRATION
ADDRESS : SAME
AS BUSINESS ADDRESS
ESTABLISHED
: 1995
REGISTRATION
NO. : 0105538000175
TAX
ID NO. : 3011519387
CAPITAL REGISTERED : BHT. 500,000,000
CAPITAL PAID-UP : BHT.
500,000,000
SHAREHOLDER’S PROPORTION : THAI :
51.00%
JAPANESE :
49.00%
FISCAL YEAR CLOSING DATE : MARCH 31
LEGAL
STATUS : PRIVATE LIMITED
COMPANY
EXECUTIVE : MR. HIROMITSU KOBAYASHI,
JAPANESE
PRESIDENT
NO.
OF STAFF : 500
LINES
OF BUSINESS : SHRINK SLEEVE
LABELS AND FLEXIBLE
PACKAGING PRODUCTS
MANUFACTURER, DISTRIBUTOR
AND EXPORTER
CORPORATE
PROFILE
OPERATING
TREND : STABLE
PRESENT
SITUATION : OPERATING NORMALLY
REPUTATION : GOOD
WITH NORMAL BUSINESS
ENGAGEMENT
MANAGEMENT
STANDARD : MANAGEMENT WITH
GOOD PERFORMANCE
HISTORY
The
subject was established
on January 3,
1995 as a
private limited company under
the registered name FUJI ACE CO., LTD.,
by a joint
venture between Thai and
Japanese groups, with
the business objective
to manufacture and
distribute shrink sleeve
labels and flexible
packaging products for
various industries, as
well as importing
and distributing labeling
machine systems for
printing and packaging
industries. It currently
employs approximate 500
staff.
The
major shareholders are Ace Pack
[Thailand] Co., Ltd., and Fuji
Seal International Inc., Japan,
with holding around 50.99%
and 49.00% of
the subject’s shares
respectively.
The subject’s registered address
is 487/1 Si Ayutthaya Rd.,
Thanon Phayathai, Ratchathewi,
Bangkok 10400, and
this is the
subject’s current operation
address.
THE
BOARD OF DIRECTOR
|
Name |
|
Nationality |
Age |
|
|
|
|
|
|
Mr. Hiromitsu Kobayashi |
[x] |
Japanese |
56 |
|
Mr. Ryusuke Konishi |
[x] |
Japanese |
53 |
|
Mr. Ken Takeda |
|
Japanese |
67 |
|
Mr. Shigeko Okazaki |
|
Japanese |
57 |
|
Mr. Varong Prayoonpong |
[-] |
Thai |
47 |
|
Mr. Toshiyuki Nakane |
|
Japanese |
55 |
|
Mr. Yoshiyuki Miyaji |
|
Japanese |
49 |
|
Mrs. Bangornthip Lipikorn |
|
Thai |
53 |
AUTHORIZED
PERSON
Both of the
mentioned directors [x]
can jointly sign
or any of
the mentioned directors [x]
can jointly sign
with the mentioned
director [-] on
behalf of the
subject with company’s
affixed.
MANAGEMENT
Mr. Hiromitsu Kobayashi is
the President.
He
is Japanese nationality
with the age
of 56 years
old.
Mr. Ryusuke Konishi is
the Vice President.
He is Japanese
nationality with the
age of 53
years old.
Mr. Yoshiyuki Miyaki is
the Factory Manager.
He
is Japanese nationality.
BUSINESS
OPERATIONS
The subject
is engaged in
manufacturing, distributing and
exporting of shrink sleeve
labels and flexible
packaging products for
various industries, including
pharmaceuticals, foods &
beverages, cosmetics, consumer
products.
It is
also an importer and distributor
of labeling machine
systems, as well
as providing installation and
maintenance service for
printing and packaging
industries.
PURCHASE
Raw materials such
as PVC resin and
chemicals are purchased
from suppliers in
both domestic and
overseas, such as
Japan, Germany, U.S.A.,
Republic of China
and India, while
labeling machine is
imported from Japan.
MAJOR
SUPPLIER
Fuji
Seal International Inc. : Japan
SALES
80% of the
products is sold
locally to wholesalers,
manufacturers and end-users,
the remaining 20%
is exported to
Japan, U.S.A., Australia
and United Kingdom.
MAJOR
CUSTOMERS
Ajinomoto Co., Ltd. : Thailand
Oishi Group Public
Company Limited :
Thailand
Thai Namthip Co.,
Ltd. : Thailand
Unilever Thai Holding
Co., Ltd. :
Thailand
Bio Manufacturing Co.,
Ltd. : Thailand
Colgate-Palmolive [Thailand] Co.,
Ltd. : Thailand
SUBSIDIARY
AND AFFILIATED COMPANY
The subject is
not found to
have any subsidiary
or affiliated company
here in Thailand.
LITIGATION
Bankruptcy and Receivership
There are no
litigation on bankruptcy
and receivership cases
filed against the
subject found at
Legal Execution Department
for the past
five years.
Others
There are no
legal suits filed
against the subject
according for the
past two years.
CREDIT
Sales are by
cash or on
the credits term
of 30-60 days.
Local bills are
paid by cash
or on the
credits term of
30-60 days.
Imports are by
L/C at sight
or T/T.
Exports are against
T/T.
BANKING
Bangkok
Bank Public Co.,
Ltd.
Bank
of Tokyo-Mitsubishi UFJ
Ltd.
EMPLOYMENT
The
subject employs approximately
500 office staff
and factory workers.
LOCATION DETAILS
The premise is
owned for administrative office
at the heading
address. Premise is
located in a
prime commercial area.
Factory/Warehouse :
Factory
I : 242/2
Moo 1, Sukhumvit
Rd., T. Bangpoomai, A. Muang,
Samutprakarn 10280.
Tel.: [66] 2709-0545-8.
Factory
II : 30/38
Moo 1, Sinsakorn
Industrial Estate, Chetsadawithi
Rd.,
T. Kokkam, A. Muang,
Samutsakorn 74000. Tel.:
[66] 34 452-033-7.
COMMENT
The
company, based in
Thailand covers the
ASEAN region as
the sales area.
It started to produce
and sell shrink
sleeve labels, flexible
package and labeling
machine systems. It
provides products concerning
packaging mainly for beverages,
commodities and food
products by customer’s requests.
Subject has maintained its
solid business amid the economic crisis.
The upbeat outlook is
underpinned by strong
sales from promising
market.
FINANCIAL
INFORMATION
The
capital was registered
at Bht. 250,000,000 divided
into 25,000,000 shares
of Bht. 10
each with fully
paid.
On
November 19, 1997
the registered capital
was increased to
Bht. 500,000,000 divided into
50,000,000 shares of
Bht. 10 each
with fully paid.
THE
SHAREHOLDERS LISTED WERE
[as
at May 30,
2013]
|
NAME |
HOLDING |
% |
|
|
|
|
|
Ace Pack [Thailand] Co.,
Ltd. Nationality: Thai Address : 487/1
Si Ayutthaya Rd.,
Thanon Phayathai, Ratchathewi, Bangkok |
25,495,000 |
50.99 |
|
Fuji Seal International Inc. Nationality: Japanese Address : 5-3-18
Imasu-kita, Tsurumi-ku, Osaka-shi, Japan |
24,500,000 |
49.00 |
|
Ajinomoto Sales [Thailand] Co.,
Ltd. Nationality: Thai Address : 487/1
Si Ayutthaya Rd.,
Thanon
Phayathai, Ratchathewi, Bangkok |
1,000 |
|
|
AET Manufacturing Co.,
Ltd. Nationality: Thai Address : 487/1
Si Ayutthaya Rd.,
Thanon
Phayathai, Ratchathewi, Bangkok |
1,000 |
|
|
F D Green [Thailand]
Co., Ltd. Nationality: Thai Address : 487/1
Si Ayutthaya Rd.,
Thanon
Phayathai, Ratchathewi, Bangkok
|
1,000 |
= 0.01 |
|
Bangkok Animal Research
Center Co., Ltd. Nationality: Thai Address : 487/1
Si Ayutthaya Rd.,
Thanon
Phayathai, Ratchathewi, Bangkok |
1,000 |
|
|
Si Ayutthaya Real
Estate Co., Ltd. Nationality: Thai Address : 487/1
Si Ayutthaya Rd.,
Thanon
Phayathai, Ratchathewi, Bangkok |
1,000 |
|
Total Shareholders : 7
Share Structure [as
at May 30,
2013]
|
Nationality |
Shareholders |
No. of Share |
% Shares |
|
|
|
|
|
|
Thai |
6 |
25,500,000 |
51.00 |
|
Foreign-Japanese |
1 |
24,500,000 |
49.00 |
|
Total |
7 |
50,000,000 |
100.00 |
NAME OF AUDITOR & CERTIFIED PUBLIC ACCOUNTANT
NO.
Mr. Vichart Lokeskravee
No. 4451
BALANCE
SHEEt
The
latest financial figures
published for March
31, 2013, 2012
& 2011 were:
ASSETS
|
Current Assets |
2013 |
2012 |
2011 |
|
|
|
|
|
|
Cash in hand
& at Bank
|
44,236,100 |
66,975,993 |
48,256,593 |
|
Trade Account & Other
Receivable |
834,419,489 |
774,188,642 |
730,033,374 |
|
Inventories |
323,173,264 |
399,816,162 |
423,936,724 |
|
Other Current Assets Refundable Value
Added Tax |
46,661,932 |
43,737,484 |
31,877,054 |
|
Prepayment for
Goods |
5,901,416 |
9,474,898 |
29,367,969 |
|
Others |
6,461,588 |
7,870,821 |
3,218,941 |
|
|
|
|
|
|
Total Current Assets
|
1,260,853,789 |
1,302,064,000 |
1,266,690,655 |
|
Fixed Assets |
1,241,765,886 |
1,259,178,331 |
1,192,083,307 |
|
Deferred Income Tax
Assets |
5,340,978 |
831,703 |
26,165,320 |
|
Total Assets |
2,507,960,653 |
2,562,074,034 |
2,484,939,282 |
LIABILITIES &
SHAREHOLDERS' EQUITY [BAHT]
|
Current
Liabilities |
2013 |
2012 |
2011 |
|
|
|
|
|
|
Short-term Loan from Bank |
- |
460,000,000 |
535,000,000 |
|
Trade Accounts &
Other Payable |
480,505,839 |
479,595,716 |
471,574,152 |
|
Loan from Parent Company |
355,000,000 |
215,000,000 |
215,000,000 |
|
Current Portion of Finance
Lease Contract Liabilities |
6,076,192 |
9,027,633 |
6,150,641 |
|
Accrued Income Tax |
22,974,856 |
- |
- |
|
Other Current Liabilities |
2,142,557 |
5,106,915 |
3,609,795 |
|
|
|
|
|
|
Total Current Liabilities |
866,699,444 |
1,168,730,264 |
1,231,334,588 |
|
Finance Lease Contract
Liabilities, Net of
Current Portion |
4,296,766 |
4,791,900 |
6,458,583 |
|
Reserve for Long-term Employee
Benefit |
31,571,648 |
24,486,827 |
21,122,988 |
|
Total Liabilities |
902,567,858 |
1,198,008,991 |
1,258,916,159 |
|
|
|
|
|
|
Shareholders' Equity |
|
|
|
|
|
|
|
|
|
Share capital : Baht 10
par value authorized, issued
and fully paid share
capital 50,000,000 shares |
500,000,000 |
500,000,000 |
500,000,000 |
|
|
|
|
|
|
Capital Paid |
500,000,000 |
500,000,000 |
500,000,000 |
|
Unappropriated [Deficit] |
1,105,392,795 |
864,065,043 |
726,023,123 |
|
Total Shareholders' Equity |
1,605,392,795 |
1,364,065,043 |
1,226,023,123 |
|
Total Liabilities & Shareholders' Equity |
2,507,960,653 |
2,562,074,034 |
2,484,939,282 |
PROFIT &
LOSS ACCOUNT
|
Revenue |
2013 |
2012 |
2011 |
|
|
|
|
|
|
Sales |
3,818,291,340 |
3,548,840,085 |
3,212,324,359 |
|
Other Income |
43,001,800 |
73,250,257 |
45,601,595 |
|
Total Revenues |
3,861,293,140 |
3,622,090,342 |
3,257,925,954 |
|
Expenses |
|
|
|
|
|
|
|
|
|
Cost of Goods
Sold |
3,363,449,817 |
3,202,966,101 |
3,092,467,054 |
|
Selling Expenses |
145,655,852 |
141,938,683 |
127,610,470 |
|
Administrative Expenses |
70,426,982 |
78,897,887 |
83,712,257 |
|
Total Expenses |
3,579,532,651 |
3,423,802,671 |
3,303,789,781 |
|
|
|
|
|
|
Profit/[Loss] Financial Cost
& Income Tax |
281,760,489 |
198,287,671 |
[45,863,827] |
|
Financial Cost |
[17,800,436] |
[28,451,611] |
[16,691,361] |
|
Income Tax |
[22,632,301] |
[31,794,140] |
10,109,740 |
|
Net Profit / [Loss] |
241,327,752 |
138,041,920 |
[52,445,448] |
FINANCIAL
ANALYSIS
|
ITEM |
UNIT |
2013 |
2012 |
2011 |
|
|
|
|
|
|
|
LIQUIDITY RATIO |
|
|
|
|
|
CURRENT RATIO |
TIMES |
1.45 |
1.11 |
1.03 |
|
QUICK RATIO |
TIMES |
1.01 |
0.72 |
0.63 |
|
|
|
|
|
|
|
ACTIVITY RATIO |
|
|
|
|
|
FIXED ASSETS TURNOVER |
TIMES |
3.07 |
2.82 |
2.69 |
|
TOTAL ASSETS TURNOVER |
TIMES |
1.52 |
1.39 |
1.29 |
|
INVENTORY CONVERSION PERIOD |
DAYS |
35.07 |
45.56 |
50.04 |
|
INVENTORY TURNOVER |
TIMES |
10.41 |
8.01 |
7.29 |
|
RECEIVABLES CONVERSION PERIOD |
DAYS |
79.76 |
79.63 |
82.95 |
|
RECEIVABLES TURNOVER |
TIMES |
4.58 |
4.58 |
4.40 |
|
PAYABLES CONVERSION PERIOD |
DAYS |
52.14 |
54.65 |
55.66 |
|
CASH CONVERSION CYCLE |
DAYS |
62.69 |
70.53 |
77.33 |
|
|
|
|
|
|
|
PROFITABILITY
RATIO |
|
|
|
|
|
COST OF GOODS SOLD |
% |
88.09 |
90.25 |
96.27 |
|
SELLING & ADMINISTRATION |
% |
5.66 |
6.22 |
6.58 |
|
INTEREST |
% |
0.47 |
0.80 |
0.52 |
|
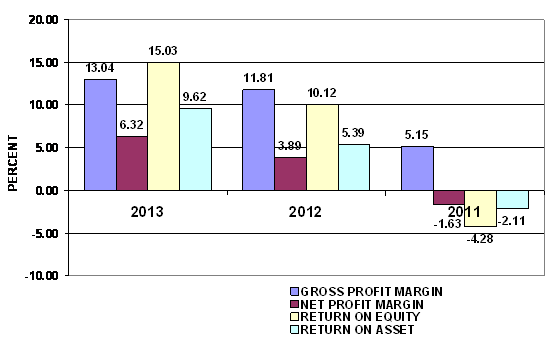
GROSS PROFIT MARGIN |
% |
13.04 |
11.81 |
5.15 |
|
NET PROFIT MARGIN BEFORE EX. ITEM |
% |
7.38 |
5.59 |
(1.43) |
|
NET PROFIT MARGIN |
% |
6.32 |
3.89 |
(1.63) |
|
RETURN ON EQUITY |
% |
15.03 |
10.12 |
(4.28) |
|
RETURN ON ASSET |
% |
9.62 |
5.39 |
(2.11) |
|
EARNING PER SHARE |
BAHT |
4.83 |
2.76 |
(1.05) |
|
|
|
|
|
|
|
LEVERAGE RATIO |
|
|
|
|
|
DEBT RATIO |
TIMES |
0.36 |
0.47 |
0.51 |
|
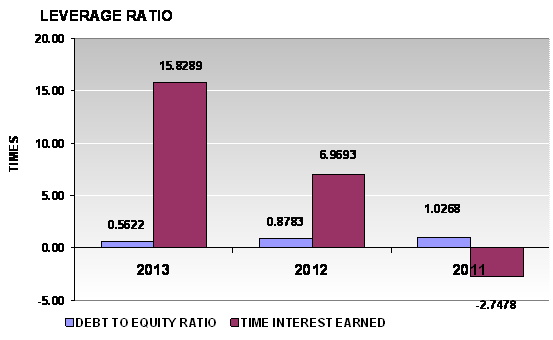
DEBT TO EQUITY RATIO |
TIMES |
0.56 |
0.88 |
1.03 |
|
TIME INTEREST EARNED |
TIMES |
15.83 |
6.97 |
(2.75) |
|
|
|
|
|
|
|
ANNUAL GROWTH |
|
|
|
|
|
SALES GROWTH |
% |
7.59 |
10.48 |
|
|
OPERATING PROFIT |
% |
42.10 |
(532.34) |
|
|
NET PROFIT |
% |
74.82 |
363.21 |
|
|
FIXED ASSETS |
% |
(1.38) |
5.63 |
|
|
TOTAL ASSETS |
% |
(2.11) |
3.10 |
|
ANNUAL GROWTH :
SATISFACTORY
An annual sales growth is 7.59%. Turnover has increased from THB
PROFITABILITY :
IMPRESSIVE
PROFITABILITY
RATIO
|
Gross Profit Margin |
13.04 |
Deteriorated |
Industrial
Average |
45.50 |
|
Net Profit Margin |
6.32 |
Impressive |
Industrial
Average |
3.41 |
|
Return on Assets |
9.62 |
Impressive |
Industrial
Average |
4.78 |
|
Return on Equity |
15.03 |
Impressive |
Industrial
Average |
12.07 |
Gross Profit Margin used to assess a firm's financial health by revealing
the proportion of money left over from revenues after accounting for the cost
of goods sold. Gross profit margin serves as the source for paying additional
expenses and future savings. The company's figure is 13.04%. When compared with
the industry average, the ratio of the company was lower, this indicated that
company may have problems with control over its costs.
Net Profit Margin is the indicator of the company's efficiency in that
net profit takes into consideration all expenses of the company. A low profit
margin indicates a low margin of safety, higher risk that a decline in sales
will erase profits and result in a net loss. The company's figure is 6.32%
compared with those of its average competitors in the same industry, indicated
that business was an efficient operator
in a dominant position within its industry.
Return on Assets measures how efficiently profits are being generated
from the assets employed in the business when compared with the ratios of firms
in a similar business. A low ratio in comparison with industry averages
indicates an inefficient use of business assets. Return on Assets ratio is
9.62%, higher figure when compared with those of its average competitors in the
same industry, indicated that business was an efficient profit in a dominant position within its industry.
Return on Equity indicates how profitable a company is by comparing its
net income to its average shareholders' equity, ROE measures how much the
shareholders earned for their investment in the company. Return on Equity ratio
is 15.03%, higher figure when compared with those of its average competitors in
the same industry, indicated that business was an efficient profit in a dominant position within its industry.
Trend of the
average competitors in the same industry for last 5 years
Return on Assets Uptrend
Return on Equity Uptrend
LIQUIDITY :
SATISFACTORY
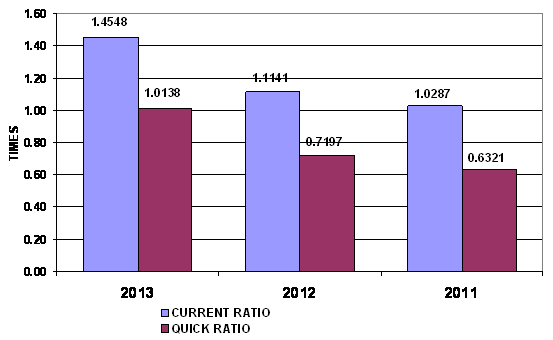
LIQUIDITY RATIO
|
Current Ratio |
1.45 |
Impressive |
Industrial Average |
1.40 |
|
Quick Ratio |
1.01 |
|
|
|
|
Cash Conversion Cycle |
62.69 |
|
|
|
The Current Ratio is to ascertain whether a company's short-term assets
are readily available to pay off its short-term liabilities. The company's figure
is 1.45 times in 2013, increased from 1.11 times, then it is generally
considered to have good short-term financial strength. When compared with the
industry average, the ratio of the company was higher, indicated that company
was an efficient operator in a dominant position within its industry.
The Quick Ratio is a liquidity indicator that further refines the
current ratio by measuring the amount of the most liquid current assets there
are to cover current liabilities. The company's figure is 1.01 times in 2013,
increased from 0.72 times, although excluding inventory so the company still
have good short-term financial strength.
The Cash Conversion Cycle measures the number of days a company's cash
is tied up in the production and sales process of its operations and the
benefit from payment terms from its creditors. It meant the company could
survive when no cash inflow was received from sale for 63 days.
Trend of the
average competitors in the same industry for last 5 years
Current Ratio Uptrend
LEVERAGE :
EXCELLENT
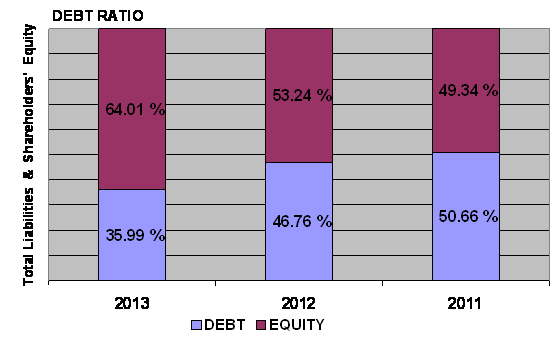
LEVERAGE RATIO
|
Debt Ratio |
0.36 |
Impressive |
Industrial
Average |
0.79 |
|
Debt to Equity Ratio |
0.56 |
Impressive |
Industrial
Average |
1.96 |
|
Times Interest Earned |
15.83 |
Impressive |
Industrial
Average |
- |
Debt to Equity Ratio a measurement of how much suppliers, lenders,
creditors and obligors have committed to the company versus what the shareholders
have committed. A lower the percentage means that the company is using less
leverage and has a stronger equity position.
Times Interest Earned measuring a company's ability to meet its debt
obligations. Ratio is 15.83 higher than 1, so the company can pay interest
expenses on outstanding debt.
Debt Ratio shows the proportion of a company's assets which are financed
through debt. The company's figure is 0.36 less than 0.5, most of the company's
assets are financed through equity.
Trend of the
average competitors in the same industry for last 5 years
Debt Ratio Uptrend
Times Interest Earned Stable
ACTIVITY :
IMPRESSIVE

ACTIVITY RATIO
|
Fixed Assets Turnover |
3.07 |
Impressive |
Industrial
Average |
- |
|
Total Assets Turnover |
1.52 |
Satisfactory |
Industrial
Average |
1.81 |
|
Inventory Conversion Period |
35.07 |
|
|
|
|
Inventory Turnover |
10.41 |
Impressive |
Industrial
Average |
8.14 |
|
Receivables Conversion Period |
79.76 |
|
|
|
|
Receivables Turnover |
4.58 |
Acceptable |
Industrial
Average |
6.37 |
|
Payables Conversion Period |
52.14 |
|
|
|
The company's Account Receivable Ratio is calculated as 4.58 and
Inventory Turnover in Days Ratio indicates the liquidity of inventory.
It estimates the number of days that it will take to sell the current
inventory. Inventory is particularly sensitive to change in business
activities. The inventory turnover in days has decreased from 46 days at the
end of 2012 to 35 days at the end of 2013. This represents a positive trend.
And Inventory turnover has increased from 8.01 times in year 2012 to 10.41
times in year 2013.
The company's Total Asset Turnover is calculated as 1.52 times and 1.39
times in 2013 and 2012 respectively. This ratio is determined by dividing total
assets into total sales turnover. The ratio measures the activity of the assets
and the ability of the firm to generate sales through the use of the assets.
Trend of the
average competitors in the same industry for last 5 years
Fixed Assets Turnover Stable
Total Assets Turnover Uptrend
Inventory Turnover Uptrend
Receivables Turnover Uptrend
FOREIGN EXCHANGE RATES
|
Currency |
Unit
|
Indian Rupees |
|
US Dollar |
1 |
Rs.60.03 |
|
|
1 |
Rs.101.96 |
|
Euro |
1 |
Rs.83.58 |
INFORMATION DETAILS
|
Analysis Done by
: |
RAS |
|
|
|
|
Report Prepared
by : |
PDT |
RATING EXPLANATIONS
|
RATING |
ST ATUS |
PROPOSED CREDIT LINE |
|
|
|
>86 |
Aaa |
Possesses an extremely sound financial base with the strongest capability
for timely payment of interest and principal sums |
Unlimited |
|
|
71-85 |
Aa |
Possesses adequate working capital. No caution needed for credit
transaction. It has above average (strong) capability for payment of interest
and principal sums |
Large |
|
|
56-70 |
A |
Financial & operational base are regarded healthy. General
unfavourable factors will not cause fatal effect. Satisfactory capability for
payment of interest and principal sums |
Fairly Large |
|
|
41-55 |
Ba |
Overall operation is considered normal. Capable to meet normal
commitments. |
Satisfactory |
|
|
26-40 |
B |
Capability to overcome financial difficulties seems comparatively
below average. |
Small |
|
|
11-25 |
Ca |
Adverse factors are apparent. Repayment of interest and principal sums
in default or expected to be in default upon maturity |
Limited with
full security |
|
|
<10 |
C |
Absolute credit risk exists. Caution needed to be exercised |
Credit not
recommended |
|
|
-- |
NB |
New Business |
-- |
|
This score serves as a reference to assess
SC’s credit risk and to set the amount of credit to be extended. It is
calculated from a composite of weighted scores obtained from each of the major sections
of this report. The assessed factors and their relative weights (as indicated
through %) are as follows:
Financial
condition (40%) Ownership
background (20%) Payment
record (10%)
Credit history
(10%) Market trend (10%) Operational size
(10%)
This report is issued at your request without any
risk and responsibility on the part of MIRA INFORM PRIVATE LIMITED (MIPL)
or its officials.