BUSINESS
INFORMATION REPORT
1. Summary Information
|
Country |
|
||
|
Company Name |
JINDAL SAW LIMITED |
Principal Name 1 |
Mrs. Savitri Devi Jindal |
|
Status |
Good |
Principal Name 2 |
Mr. Prithvi R. Jindal |
|
Registration # |
20-023979 |
||
|
Street Address |
A-1,
UPSIDC Industrial Area, Nandgaon Road, Kosi Kalan, District Mathura – 281403,
Uttar Pradesh, India |
||
|
Established Date |
31.10.1984 |
SIC Code |
-- |
|
Telephone# |
91-5662-252277 |
Business Style 1 |
Manufacturer |
|
Fax # |
91-5662-232577 |
Business Style 2 |
Supplier |
|
Homepage |
Product Name 1 |
Pipe Products for the Energy |
|
|
# of employees |
Not Divulged |
Product Name 2 |
Water Industry |
|
Paid up capital |
Rs. 552,458,000/- |
Product Name 3 |
other Industrial Applications |
|
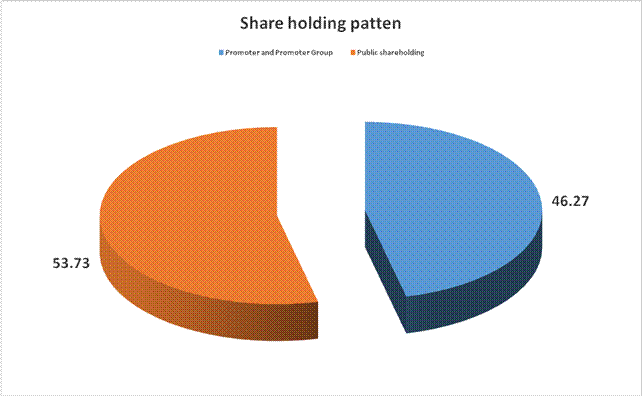
Shareholders |
Promoter And Promoter Group - 46.27 % Public Shareholding - 53.73 % |
Banking |
State Bank of Patiala |
|
Public Limited Corp. |
Yes |
Business Period |
30 Years |
|
IPO |
Yes |
International Ins. |
-- |
|
Public |
Yes |
Rating |
A (63) |
|
Related
Company |
|||
|
Relation
|
Country
|
Company
Name |
CEO |
|
Direct Subsidiaries |
-- |
Jindal ITF Limited |
-- |
|
Note |
--
|
||
2. Summary
Financial Statement
|
Balance Sheet as of |
31.03.2013 |
(Unit: Indian Rs.) |
|
|
Assets |
Liabilities |
||
|
Current Assets |
23,051,266,000
|
Current Liabilities |
9,537,897,000
|
|
Inventories |
14,711,052,000
|
Long-term Liabilities |
32,432,478,000 |
|
Fixed Assets |
25,562,314,000 |
Other Liabilities |
2,445,373,000
|
|
Deferred Assets |
0,000 |
Total Liabilities |
44,415,748,000
|
|
Invest& other Assets |
18,377,328,000 |
Retained Earnings |
36,733,754,000 |
|
|
|
Net Worth |
37,286,212,000 |
|
Total Assets |
81,701,960,000 |
Total Liab. & Equity |
81701,960,000 |
|
Total Assets |
75,800,107,000 |
|
|
|
P/L Statement as of |
31.03.2013 |
(Unit: Indian Rs.) |
|
|
Sales |
56,166,984,000 |
Net Profit |
1,934,140,000 |
|
Sales |
51,979,031,000 |
Net Profit
|
2,241,882,000 |
MIRA INFORM REPORT
|
Report Date : |
08.05.2014 |
IDENTIFICATION DETAILS
|
Name : |
JINDAL SAW LIMITED (w.e.f. 07.02.2005) |
|
|
|
|
Formerly Known
As : |
SAW PIPES LIMITED |
|
|
|
|
Registered
Office : |
A-1,
UPSIDC Industrial Area, |
|
|
|
|
Country : |
|
|
|
|
|
Financials (as
on) : |
31.03.2013 |
|
|
|
|
Date of
Incorporation : |
31.10.1984 |
|
|
|
|
Com. Reg. No.: |
20-023979 |
|
|
|
|
Capital
Investment / Paid-up Capital : |
Rs. 552.458 millions |
|
|
|
|
CIN No.: [Company Identification
No.] |
L27104UP1984PLC023979 |
|
|
|
|
TAN No.: [Tax Deduction &
Collection Account No.] |
AGRS10410B |
|
|
|
|
Legal Form : |
A
Public Limited Liability Company. The company’s shares are Listed on the
Stock Exchanges. |
|
|
|
|
Line of Business
: |
Manufacturer and Supplier of Pipe
Products for the Energy, Water Industry and other Industrial Applications. |
|
|
|
|
No. of Employees
: |
Not Divulged |
RATING & COMMENTS
|
MIRA’s Rating : |
A (63) |
|
RATING |
STATUS |
PROPOSED CREDIT LINE |
|
|
56-70 |
A |
Financial & operational base are regarded healthy. General unfavourable
factors will not cause fatal effect. Satisfactory capability for payment of
interest and principal sums |
Fairly Large |
|
Maximum Credit Limit : |
USD 149000000 |
|
|
|
|
Status : |
Good |
|
|
|
|
Payment Behaviour : |
Regular |
|
|
|
|
Litigation : |
Exist |
|
|
|
|
Comments : |
Subject is a flagship company of the Jindal Group. It is having good track record. Financial performance of the company
seems strong. Fundamental are healthy. Liquidity position is good. Trade relations are reported as fair. Business is active. Payment are
reported to be regular and as per commitments. The company can be considered normal for business dealings at usual
trade terms and condition. |
NOTES :
Any query related to this report can be made
on e-mail : infodept@mirainform.com
while quoting report number, name and date.
ECGC Country Risk Classification List – March 31, 2014
|
Country Name |
Previous Rating (31.12.2013) |
Current Rating (31.03.2014) |
|
India |
A1 |
A1 |
|
Risk Category |
ECGC
Classification |
|
Insignificant |
A1 |
|
Low |
A2 |
|
Moderate |
B1 |
|
High |
B2 |
|
Very High |
C1 |
|
Restricted |
C2 |
|
Off-credit |
D |
INDIAN ECONOMIC OVERVIEW
US investment bank
Goldman Sachs has upgraded its outlook on Indian markets as it expects
positive impact of the election cycle.
India’s economy may
grow 4.7 % in the current financial year, lower than the official estimate of
4.9 %, Fitch Rating said. The global rating agency expects the economy to pick
up in the next two financial years.
Global ratings
agency Standard & Poor said increasing focus by India Inc on lowering debt
is likely to improve their credit profiles.
Singapore (1.1 million
Indian tourists in 2012), Thailand (one million), the United Arab Emirates
().98 million) and Malaysia ().82 million) emerged as the preferred holidays
hotspots for Indians. The total figure is expected to increase to 1.93 million
by 2017, according to the latest Eurmonitor international report.
There is a $29.34 bn
outward foreign direct investment by domestic companies between April and
January of 2013/14 which has seen some signs of recovery according to a Care
Ratings report.
There are 264 number
of new companies being set up every day on average during 2014. Most of them
are registered in Mumbai. India had 1.38 million registered companies at the
end of January, 2014.
Twitter like
messaging service Weibo Corporation has filed to raise $ 500 million via a US
initial public offering. Alibaba, which owns a stake in Weibo is expected to
raise about $ 15 billion New York this year in the highest profile Internet IPO
since Facebook’s in 2012.
Bharti Airtel has
raised Rs.2,453.2 crore (350 million Swiss Francs) by selling six-year bonds at
a coupon rate of three per cent and maturing in 2020. This is the largest ever
bond offering by an Indian company in Swiss Francs. Bharat Petroleum
Corporation raised 175 million Swiss Francs by selling five year bonds at 2.98
% coupon rate in February.
Indian Oil
Corporation plans to invest Rs 7650 crore in setting up a petrochemical complex
at its almost complete Paradip refinery in Odhisha in three to four years. The
company board is set to consider the setting up of a 700000 tonne per annum
polypropylene plant at an estimated cost at Rs.3150 crore.
Global chief
information officers at gathering in Bangalore in April to meet Indian startups
at an event called Tech50 Watchout for Little Eye Labs-Facebook type deals in
the making.
EXTERNAL AGENCY RATING
|
Rating Agency Name |
ICRA |
|
Rating |
Non-fund based limits: “A1” |
|
Rating Explanation |
Have very strong degree of safety and carry lowest credit risk. |
|
Date |
05.05.2014 |
RBI DEFAULTERS’ LIST STATUS
Subject’s name is not enlisted as a defaulter
in the publicly available RBI Defaulters’ list.
EPF (Employee Provident Fund) DEFAULTERS’ LIST STATUS
Subject’s name is not enlisted as a defaulter
in the publicly available EPF (Employee Provident Fund) Defaulters’ list as of
31-03-2012.
INFORMATION DECLINED
MANAGEMENT NON-COOPERATIVE (Tel. No.: 91-11-26188360)
LOCATIONS
|
Registered Office/ Factory 1 : |
A-1 UPSIDC Industrial Area, |
|
Tel. No.: |
91-5662-252277/ 252224/ 232426/ 232001/ 02/ 03 |
|
Fax No.: |
91-5662-232577 |
|
E-Mail : |
|
|
Website : |
|
|
|
|
|
Corporate Office : |
‘Jindal Centre’, 12, |
|
Tel. No.: |
91-11-26188360–74/ 26188345 |
|
Fax No.: |
91-11-26170691/ 41659575 |
|
E-Mail : |
|
|
|
|
|
Factories : |
MUNDRA - IPU Village: Samaghogha, Pragpar - Phone : 91-2838-240755-756, 240773 Fax : 91-2838-240700 MUNDRA - JCO S.No. 94/1, 94/2 and 96, Village: Nanakapaya Taluka: Mundra, District
Kutch – 370415, Phone: 91-2838-287305-06 Fax : 91-2838-22700 NASHIK A-59-60 Fax : 91-2551-230967 |
|
|
|
|
Regional Offices : |
MUMBAI Phone : 91-22-23513000 Fax : 91-22-23521889 AHMEDABAD 601, Phone : 91-79-26431323 Fax : 91-79-26431433 H. No. 8-2-618/2/2/A, Plot No. 25, Road No. 10 , Classic Emerald Lane,
Near Rainbow Hospital, Banjara Hills, Hyderabad, Andhra Pradesh, India Phone : 91-40-55778694 / 95 6th Floor, East Wing, Phone : 91-80-25559869/ 73 Fax : 91-80-25598898 CHENNAI 4-B, Phone : 91-44-4213 2033/ 42043737 Fax : 91-44-4204 3737 |
DIRECTORS
As on 31.03.2013
|
Name : |
Mrs. Savitri Devi Jindal |
|
Designation : |
Chairperson |
|
Date of Birth/Age : |
20.03.1950 |
|
Qualification : |
Under Graduate |
|
Date of Appointment : |
28.04.2005 |
|
|
|
|
Name : |
Mr. Prithvi R. Jindal |
|
Designation : |
Vice Chairman (Non Executive) |
|
|
|
|
Name : |
Mr. Indresh Batra |
|
Designation : |
Managing Director |
|
Date of Birth/Age : |
27.12.1971 |
|
Qualification : |
MBA |
|
Date of Appointment : |
28.04.2007 |
|
Experience : |
17 Years |
|
|
|
|
Name : |
Ms. Sminu Jindal |
|
Designation : |
Managing Director |
|
Date of Birth/Age : |
40 Years |
|
Qualification : |
B.Com
(Hons.) MBA (Finance) |
|
Experience : |
20 Years |
|
|
|
|
Name : |
Mr. Devi Dayal |
|
Designation : |
Director |
|
Date of Birth/Age : |
02.07.1941 |
|
Qualification : |
LL. B., M. A. |
|
Date of Appointment : |
30.07.2004 |
|
Other Directorship : |
· Hotels Sun Air Limited · Omexe Limited · Sahara Prime City Limited |
|
|
|
|
Name : |
Dr. S.K. Gupta |
|
Designation : |
Director |
|
Date of Birth/Age : |
18.08.1938 |
|
Qualification : |
Technocrat |
|
Date of Appointment : |
22.11.2005 |
|
|
|
|
Name : |
Mr. Kuldip Bhargava |
|
Designation : |
Director |
|
Date of Birth/Age : |
22.04.1953 |
|
Qualification : |
Industrialist |
|
Date of Appointment : |
22.11.2001 |
|
Other Directorship : |
Hexa Tradex Limited |
|
|
|
|
Name : |
Mr. Raj Kamal Agarwal |
|
Designation : |
Director |
|
Date of Birth/Age : |
07.07.1952 |
|
Qualification : |
M.B.B.S. |
|
Date of Appointment : |
30.01.2006 |
|
Other Directorship : |
· Hexa Tradex Limited · Virtue Drilling PTE Limited |
|
|
|
|
Name : |
Mr. Ravinder Nath Leekha |
|
Designation : |
Director |
|
|
|
|
Name : |
M. Girish Sharma |
|
Designation : |
Director |
|
Date of Birth/Age : |
19.12.1951 |
|
Qualification : |
IRS (Retd.) |
|
Date of Appointment : |
30.05.2012 |
|
|
|
|
Name : |
Mr. H.S. Chaudhary |
|
Designation : |
Whole Time Director |
|
Date of Birth/Age : |
05.09.1954 |
|
Qualification : |
Graduate |
|
Date of Appointment : |
07.10.1988 |
|
|
|
|
Name : |
Mr. Neeraj Kumar |
|
Designation : |
Group Chief Executive Officer and Executive Director |
|
Date of Birth/Age : |
02.05.1963 |
|
Qualification : |
M. Sc. (Physics) and MBA |
|
Date of Appointment : |
01.07.2013 |
KEY EXECUTIVES
|
Name : |
Mr. Sunil K Jain |
|
Designation : |
Company Secretary |
MAJOR SHAREHOLDERS / SHAREHOLDING PATTERN
As on 31.03.2014
|
Category of
Shareholders |
No. of Shares |
Percentage of
Holding |
|
(A) Shareholding of Promoter and Promoter Group |
|
|
|
|
|
|
|
|
1635300 |
0.59 |
|
|
94573120 |
34.24 |
|
|
96208420 |
34.83 |
|
|
|
|
|
|
98700 |
0.04 |
|
|
31514985 |
11.41 |
|
|
31613685 |
11.44 |
|
Total shareholding of Promoter and Promoter Group (A) |
127822105 |
46.27 |
|
(B) Public Shareholding |
|
|
|
|
|
|
|
|
25277588 |
9.15 |
|
|
179435 |
0.06 |
|
|
7128562 |
2.58 |
|
|
47633015 |
17.24 |
|
|
80218600 |
29.04 |
|
|
|
|
|
|
44084505 |
15.96 |
|
|
|
|
|
|
19072532 |
6.90 |
|
|
2609757 |
0.94 |
|
|
2416022 |
0.87 |
|
|
1159083 |
0.42 |
|
|
1200239 |
0.43 |
|
|
56700 |
0.02 |
|
|
68182816 |
24.68 |
|
Total Public shareholding (B) |
148401416 |
53.73 |
|
Total (A)+(B) |
276223521 |
100.00 |
|
(C) Shares held by Custodians and against which Depository Receipts
have been issued |
|
|
|
|
0 |
0.00 |
|
|
0 |
0.00 |
|
|
0 |
0.00 |
|
Total (A)+(B)+(C) |
276223521 |
100.00 |
BUSINESS DETAILS
|
Line of Business : |
Manufacturer and Supplier of Pipe
Products for the Energy, Water Industry and other Industrial Applications. |
||||||||||||
|
|
|
||||||||||||
|
Products : |
|
GENERAL INFORMATION
|
No. of Employees : |
Not Divulged |
|||||||||||||||||||||||||||||||||
|
|
|
|||||||||||||||||||||||||||||||||
|
Bankers : |
· State Bank of Patiala · State Bank of India · Punjab National Bank · Canara Bank · Axis Bank Limited · Credit Agricole Corporate and Investment bank · HDFC Bank Limited · ICICI Bank Limited · ING Vysya Bank Limited · Standard Chartered Bank · State Bank of Mysore · State Bank of Travancore · Syndicate Bank · United Bank of India · Karnataka Bank Limited |
|||||||||||||||||||||||||||||||||
|
|
|
|||||||||||||||||||||||||||||||||
|
Facilities : |
NOTE Non-convertible Debentures include : (i) 10.75% Non-Convertible Debentures of Rs. 3000.000 Millions (Previous Year Rs. 3000.000 Millions) are secured by first pari passu charge by way of English mortgage on the Company's specific immovable properties located in the state of Gujarat and by way of equitable mortgage of Company's other immovable properties and hypothecation of moveable fixed assets both present and future in favour of Debenture Trustees. The same are repayable in three equal installments of Rs. 1000.000 Millions each on April 08, 2015, April 08, 2016 and April 08, 2017 (ii) 10.50% Non-Convertible Debentures of Rs. 1000.000 Millions (Previous Year Nil) in three series are secured by first pari passu charge by way of English mortgage on the Company's specific immovable properties located in the state of Gujarat and by way of equitable mortgage of Company's other immovable properties and hypothecation of moveable fixed assets both present and future in favour of Debenture Trustees. The same are repayable in three installments of Rs. 300.000 Millions (Series I), Rs. 300.000 Millions (Series II) and Rs. 400.000 Millions (Series III) on September 12, 2018, September 12, 2019 and September 12, 2020 respectively. There is a call option excercisable at the end of three years from the date of allotment (September 12, 2012) for all series of NCDs. The Call option is also available in every subsequent year for each series of NCD individually i.e.at the end of 4th, 5th, 6th and 7th year from the date of allotment upto their respective dates of maturity. (iii) 10.38% Non-Convertible Debentures of Rs. 3000.000 Millions (Previous Year Nil) in two series are secured by first pari passu charge by way of English mortgage on the Company's specific immovable properties located in the state of Gujarat and by way of equitable mortgage of Company's other immovable properties and hypothecation of moveable fixed assets both present and future in favour of Debenture Trustees. The same are repayable in single installment of Rs. 3000.000 Millions on December 26, 2021.There is a put/call option for Rs. 1500.000 Millions at the end of third year (December 26, 2015) and for Rs. 1500.000 Millions at the end of Fourth year (December 26, 2016) from the date of allotment i.e.December 26, 2012 Term Loans from Banks include : i) Term Loan of Rs. 1370.000 Millions (rate of interest 1.50% p.a.)(Previous Year Rs. 1370.000 Millions) is secured by way of second charge on all the assets of the Company both present and future and also by way of personal guarantee of Director. The same is repayable in three installments of Rs. 411.000 Millions, Rs. 411.000 Millions and Rs. 548.000 Millions on Jan 31, 2017, Jan 31, 2018 and Jan 31, 2019 respectively. ii) Term Loan of Rs. 500.000 Millions (rate of interest 10.75% p.a.) (Previous Year Nil) is secured by way of second charge on all the assets of the Company, both present and future and also by way of personal guarantee of a Director. The repayment is by way of a bullet payment of Rs. 500.000 Millions on May 23, 2017. iii) Term Loan of USD 8904719.50 (Rs. 484.321 Millions) (rate of interest 6 M Libor+400 bps p.a.) (Previous Year Nil) is secured by way of second charge on all the assets of the Company both present and future and also by way of personal guarantee of a Director. The repayment is by way of a bullet payment of USD 8904719.50 (Rs. 484.321 Millions) on May 23, 2017. iv) Term Loan includes Vehicle Loans of Rs. 0.846 million (Previous Year-nil) is secured by way of hyphothecation of Vehicles, which carries rate of interest ranging from 10.50% to 11.00% p.a. Secured Short Term
Borrowings Above short term borrowings of Rs.12645.476 Millions are secured by hypothecation of finished goods, raw materials, work-in-progress, stores and spares, book debts and second pari passu charge in respect of other moveable and immoveable properties of the Company and Rs. 951.813 Millions is secured by second charge pari passu on current assets of the Company. |
|
|
|
|
Banking
Relations : |
-- |
|
|
|
|
Statutory Auditors
: |
|
|
Name : |
N.C. Aggarwal and Company Chartered
Accountants |
|
Address : |
|
|
|
|
|
Internal Auditors :
|
· Singhi and Company Chartered Accountants · T.R. Chadha and Company Chartered Accountants |
|
|
|
|
Subsidiaries : |
Direct Subsidiaries: · Jindal ITF Limited · IUP Jindal Metal and Alloys Limited · S.V. Trading Limited · Jindal Fittings Limited · Quality Iron and Steel Limited · Ralael Holdings Limited · Jindal Saw Holdings FZE · Greenray Holdings Limited · Universal Tube Accessories Private Limited (w.e.f. 30th August 2012) · Jindal Saw Espana SL (w.e.f. 21st March 2013) Indirect Subsidiaries (Control Exist) · Jindal Saw USA, LLC · Jindal Saw Middle East FZC · Jindal Intellicom Limited · JITF Water Infrastructure Limited · JITF Urban Infrastructure Limited · JITF Shipyards Limited · Jindal Rail Infrastructure Limited · JITF Waterways Limited · JITF Infralogistics Limited · JITF Water Infra (Naya Raipur ) Limited · JITF ESIPL CETP (Sitarganj) Limited ·
Timarpur-Okhla Waste Management Company
Private Limited · Jindal Saw Gulf LLC · Jindal Saw Italia S.P.A. · JITF Urban Infrastucture Services Limited · Intellicom Insurance Advisors Limited · Derwant Sand SARL · JITF Coal Logistics Limited · JITF Shipping and Logistics ( Singapore) PTE. Limited · JITF Urban Waste Management (Ferozepur) Limited · JITF Urban Waste Management (Jalandhar) Limited · JITF Urban Waste Management (Bathinda) Limited · JITF Industrial Infrastructure Development Company Limited (w.e.f. 2nd May 2012) · Jindal ITF Kobelco Eco Limited (upto 31st October 2012) · JITF Manila Water Development Company Limited (upto 6th Feburuary 2013) · JITF Global Water Holding Pte. Limited · (Strike off application for closure is filed on 3rd January, 2013 with Accounting and Corporate Regulatory Authority, Singapore. Closure action is awaited) ·
JITF Water Infra (Rajkot) Limited (upto 29th
January, 2013) |
|
|
|
|
Joint Venture : |
· Jindal Sigma Limited · JWIL-SSIL JV (w.e.f. 28th Feb. 2012) · SMC-JWIL- JV (w.e.f. 24th Dec. 2012) ·
JWIL- Ranhill- JV (w.e.f. 27th Nov.
2012 ) |
|
|
|
|
Enterprise over which Key Management Personnel
having significant influence : |
· Sminu Jindal Charitable Trust · Hexa Securities and Finance Company Limited · Hexa Tradex Limited |
CAPITAL STRUCTURE
As on 31.03.2013
Authorised Capital :
|
No. of Shares |
Type |
Value |
Amount |
|
|
|
|
|
|
500000000 |
Equity Shares |
Rs.2/- each |
Rs.1000.000 millions |
|
10000000 |
Redeemable
Non-Convertible Cumulative Preference Shares |
Rs.100/- each |
Rs.1000.000 millions |
|
|
|
|
|
|
|
Total |
|
Rs.2000.000 millions |
Issued Capital:
|
No. of Shares |
Type |
Value |
Amount |
|
|
|
|
|
|
276230771 |
Equity Shares |
Rs.2/- each |
Rs.552.462
millions |
|
|
|
|
|
Subscribed & Paid-up Capital:
|
No. of Shares |
Type |
Value |
Amount |
|
|
|
|
|
|
276226771 |
Equity Shares |
Rs.2/- each |
Rs.552.454 millions |
|
|
Add: Forfeited
4000 Equity Shares of Rs.2/- each (Partly Paid up Re.1/- each) |
|
Rs.0.004 million |
|
|
|
|
|
|
|
Total |
|
Rs.552.458 millions |
:
(a)
Reconciliation of the number of shares:
|
Particulars |
31.03.2013 |
|
Equity Shares |
|
|
Shares outstanding as at the beginning of the year |
276,226,771 |
|
Shares outstanding as at the end of the year |
276,226,771 |
(b) Details of
shareholders holding more than 5% shares in the company:
|
Name of Shareholders |
31.03.2013 |
|
|
No. of
shares |
% of
holding as at
31.3.2013 |
|
|
Nalwa Sons Investments Limited |
53550000 |
19.39 |
|
Sigmatech Inc |
30120000 |
10.90 |
|
Reliance Capital Trustee Company Limited A/c Reliance Growth Fund |
15701387 |
5.68 |
|
Morgan Stanley Asia (Singapore) PTE |
14842975 |
5.37 |
|
Total |
114214362 |
41.34 |
(c) Aggregate number of bonus shares issued, shares issued for consideration other than cash and bought back
shares during the period of five years immediately preceding the reporting date. - Nil
(d) 3,250 Equity Shares have been held in abeyance as a result of attachment orders by Govt. authorities, lost
shares certificates and other disputes.
(e) Terms/Rights attached to Equity Shares The Company has only one class of equity shares having a par value of Rs. 2/- per equity share. Each equity shareholder is entitled to one vote per share.
FINANCIAL DATA
[all figures are
in Rupees Millions]
ABRIDGED BALANCE
SHEET
|
SOURCES OF FUNDS |
|
|
31.03.2013 |
|
I.
EQUITY
AND LIABILITIES |
|
|
|
|
(1)Shareholders' Funds |
|
|
|
|
(a) Share Capital |
|
|
552.458 |
|
(b) Reserves & Surplus |
|
|
36733.754 |
|
(c) Money
received against share warrants |
|
|
0.000 |
|
|
|
|
|
|
(2) Share Application money pending
allotment |
|
|
0.000 |
|
Total
Shareholders’ Funds (1) + (2) |
|
|
37286.212 |
|
|
|
|
|
|
(3)
Non-Current Liabilities |
|
|
|
|
(a) long-term borrowings |
|
|
14807.385 |
|
(b) Deferred tax liabilities (Net) |
|
|
1747.659 |
|
(c) Other long term
liabilities |
|
|
0.525 |
|
(d) long-term
provisions |
|
|
313.330 |
|
Total Non-current
Liabilities (3) |
|
|
16868.899 |
|
|
|
|
|
|
(4)
Current Liabilities |
|
|
|
|
(a) Short
term borrowings |
|
|
17625.093 |
|
(b) Trade
payables |
|
|
4687.630 |
|
(c) Other
current liabilities |
|
|
4849.742 |
|
(d) Short-term
provisions |
|
|
384.384 |
|
Total Current
Liabilities (4) |
|
|
27546.849 |
|
|
|
|
|
|
TOTAL |
|
|
81701.960 |
|
|
|
|
|
|
II.
ASSETS |
|
|
|
|
(1) Non-current
assets |
|
|
|
|
(a) Fixed
Assets |
|
|
|
|
(i)
Tangible assets |
|
|
25478.320 |
|
(ii)
Intangible Assets |
|
|
83.994 |
|
(iii)
Capital work-in-progress |
|
|
10112.046 |
|
(iv)
Intangible assets under development |
|
|
0.000 |
|
(b) Non-current Investments |
|
|
7565.282 |
|
(c) Deferred tax assets (net) |
|
|
0.000 |
|
(d) Long-term Loan and Advances |
|
|
2289.126 |
|
(e) Other
Non-current assets |
|
|
0.000 |
|
Total Non-Current
Assets |
|
|
45528.768 |
|
|
|
|
|
|
(2)
Current assets |
|
|
|
|
(a)
Current investments |
|
|
700.000 |
|
(b)
Inventories |
|
|
14711.052 |
|
(c) Trade
receivables |
|
|
12385.701 |
|
(d) Cash
and cash equivalents |
|
|
629.268 |
|
(e)
Short-term loans and advances |
|
|
7727.767 |
|
(f) Other
current assets |
|
|
19.404 |
|
Total
Current Assets |
|
|
36173.192 |
|
|
|
|
|
|
TOTAL |
|
|
81701.960 |
|
SOURCES OF FUNDS |
|
31.03.2012 |
31.03.2011 |
|
|
SHAREHOLDERS FUNDS |
|
|
|
|
|
1] Share Capital |
|
552.458 |
552.458 |
|
|
2] Share Application Money |
|
0.000 |
0.000 |
|
|
3] Reserves & Surplus |
|
34976.693 |
39659.416 |
|
|
4] (Accumulated Losses) |
|
0.000 |
0.000 |
|
|
NETWORTH |
|
35529.151 |
40211.874 |
|
|
LOAN FUNDS |
|
|
|
|
|
1] Secured Loans |
|
13445.016 |
7857.624 |
|
|
2] Unsecured Loans |
|
11408.568 |
8258.974 |
|
|
TOTAL BORROWING |
|
24853.584 |
16116.598 |
|
|
DEFERRED TAX LIABILITIES |
|
1025.159 |
2266.478 |
|
|
|
|
|
|
|
|
TOTAL |
|
61407.894 |
58594.950 |
|
|
|
|
|
|
|
|
APPLICATION OF FUNDS |
|
|
|
|
|
|
|
|
|
|
|
FIXED ASSETS [Net Block] |
|
20375.986 |
19255.181 |
|
|
Capital work-in-progress |
|
6914.080 |
4252.211 |
|
|
|
|
|
|
|
|
INVESTMENT |
|
6989.654 |
6543.084 |
|
|
DEFERRED TAX ASSETS |
|
0.000 |
0.000 |
|
|
Other Non Current Assets |
|
196.008 |
0.000 |
|
|
|
|
|
|
|
|
CURRENT ASSETS, LOANS & ADVANCES |
|
|
|
|
|
|
Inventories |
|
18035.025
|
16482.032
|
|
|
Sundry Debtors |
|
12896.217
|
12346.114
|
|
|
Cash & Bank Balances |
|
1722.158
|
932.328
|
|
|
Other Current Assets |
|
69.247
|
0.000
|
|
|
Loans & Advances |
|
8601.732
|
8510.325
|
|
Total Current Assets |
|
41324.379
|
38270.799
|
|
|
Less : CURRENT LIABILITIES & PROVISIONS |
|
|
|
|
|
|
Sundry Creditors |
|
4368.885
|
2533.868
|
|
|
Other Current Liabilities |
|
9351.704
|
6601.152
|
|
|
Provisions |
|
671.624
|
591.305
|
|
Total Current Liabilities |
|
14392.213
|
9726.325
|
|
|
Net Current Assets |
|
26932.166
|
28544.474
|
|
|
|
|
|
|
|
|
MISCELLANEOUS EXPENSES |
|
0.000 |
0.000 |
|
|
|
|
|
|
|
|
TOTAL |
|
61407.894 |
58594.950 |
|
PROFIT & LOSS
ACCOUNT
|
|
PARTICULARS |
31.03.2013 |
31.03.2012 |
31.03.2011 |
|||
|
|
SALES |
|
|
|
|||
|
|
|
Income |
56166.984 |
51979.031 |
41879.465 |
||
|
|
|
Other Income |
824.056 |
933.311 |
363.513 |
||
|
|
|
TOTAL (A) |
56991.040 |
52912.342 |
42242.978 |
||
|
|
|
|
|
|
|||
|
Less |
EXPENSES |
|
|
|
|||
|
|
|
Cost of material consumed |
35766.935 |
38906.067 |
25003.927 |
||
|
|
|
Manufacturing Expenses |
-- |
-- |
4344.075 |
||
|
|
|
Purchase of stock-in-trade |
213.793 |
318.595 |
--- |
||
|
|
|
Selling Expenses |
-- |
-- |
1783.914 |
||
|
|
|
Changes in inventories of finished goods, work-in-progress and
stock-in-trade |
2308.049 |
(4687.800) |
(180.436) |
||
|
|
|
Employee benefit Expenses |
2522.608 |
2374.616 |
2050.179 |
||
|
|
|
Administrative and Other Expenses |
-- |
-- |
584.678 |
||
|
|
|
Other Expenses |
9327.697 |
8727.254 |
-- |
||
|
|
|
Exceptional Items |
1142.420 |
1408.060 |
-- |
||
|
|
|
Excise Duty on Increase/ Decrease in Stock |
-- |
-- |
44.746 |
||
|
|
|
TOTAL (B) |
51281.502 |
47046.792 |
33631.083 |
||
|
|
|
|
|
|
|||
|
Less |
PROFIT
BEFORE INTEREST, TAX, DEPRECIATION AND AMORTISATION (A-B) (C) |
5709.538 |
5865.550 |
8611.895 |
|||
|
|
|
|
|
|
|||
|
Less |
FINANCIAL
EXPENSES (D) |
1500.779 |
1139.289 |
1190.665 |
|||
|
|
|
|
|
|
|||
|
|
PROFIT
BEFORE TAX, DEPRECIATION AND AMORTISATION (C-D) (E) |
4208.759 |
4726.261 |
7421.230 |
|||
|
|
|
|
|
|
|||
|
Less/ Add |
DEPRECIATION/
AMORTISATION (F) |
1549.519 |
1496.579 |
1366.644 |
|||
|
|
|
|
|
|
|||
|
|
PROFIT BEFORE
TAX (E-F) (G) |
2659.240 |
3229.682 |
6054.586 |
|||
|
|
|
|
|
|
|||
|
Less |
TAX (H) |
725.100 |
987.800 |
1413.925 |
|||
|
|
|
|
|
|
|||
|
|
PROFIT AFTER TAX
(G-H) (I) |
1934.140 |
2241.882 |
4640.661 |
|||
|
|
|
|
|
|
|||
|
Add |
PREVIOUS YEAR
ADJUSTMENT |
(5.310) |
20.134 |
(25.055) |
|||
|
|
|
|
|
|
|||
|
Add |
FOREIGN EXCHANGE
TRANSLATION DIFFERENCE |
(0.512) |
(1.328) |
0.092 |
|||
|
|
|
|
|
|
|||
|
Add |
PREVIOUS
YEARS’ BALANCE BROUGHT FORWARD |
1687.881 |
1444.231 |
2191.203 |
|||
|
|
|
|
|
|
|||
|
Less |
APPROPRIATIONS |
|
|
|
|||
|
|
|
Transfer to General Reserve |
1000.000 |
1500.000 |
4000.000 |
||
|
|
|
Dividend |
276.227 |
276.227 |
276.228 |
||
|
|
|
Tax on Dividend |
46.945 |
44.811 |
44.811 |
||
|
|
|
Debenture Redemption Reserve |
315.200 |
196.000 |
0.000 |
||
|
|
|
Capital Redemption Reserve |
0.000 |
0.000 |
1000.000 |
||
|
|
|
Interim Dividend paid on Preference Shares |
0.000 |
0.000 |
35.701 |
||
|
|
|
Corporate dividend tax on above |
0.000 |
0.000 |
5.930 |
||
|
|
BALANCE CARRIED
TO THE B/S |
1977.827 |
1687.881 |
1444.231 |
|||
|
|
|
|
|
|
|||
|
|
EARNINGS IN
FOREIGN CURRENCY |
|
|
|
|||
|
|
|
F.O.B. Value of Exports |
31986.888 |
26887.101 |
15792.493 |
||
|
|
|
Interest |
15.430 |
17.235 |
22.413 |
||
|
|
|
Conversion Charges |
0.000 |
0.000 |
2.780 |
||
|
|
|
Carbon Credits |
13.072 |
44.788 |
59.952 |
||
|
|
|
Others |
85.604 |
28.780 |
0.780 |
||
|
|
TOTAL EARNINGS |
32100.994 |
26977.904 |
15878.418 |
|||
|
|
|
|
|
|
|||
|
|
IMPORTS |
|
|
|
|||
|
|
|
Raw Materials |
20381.822 |
21221.886 |
21385.261 |
||
|
|
|
Stores & Spares |
690.110 |
727.598 |
391.650 |
||
|
|
|
Capital Goods |
3019.894 |
1111.616 |
507.355 |
||
|
|
TOTAL IMPORTS |
24091.826 |
23061.100 |
22284.266 |
|||
|
|
|
|
|
|
|||
|
|
Earnings Per
Share (Rs.) |
|
|
|
|||
|
|
- Basic |
6.98 |
8.12 |
16.57 |
|||
|
|
- Diluted |
6.98 |
8.12 |
16.00 |
|||
QUARTERLY RESULTS
|
PARTICULARS |
30.06.2013 Unaudited |
30.09.2013 Unaudited |
31.12.2013 Unaudited |
|
Type |
1st
Quarter |
2nd
Quarter |
3rd
Quarter |
|
Net Sales |
1,2070.100 |
1,2293.900 |
1,7096.100 |
|
Total Expenditure |
1,0646.500 |
1,0811.900 |
1,5438.800 |
|
PBIDT (Excl OI) |
1423.600 |
1482.000 |
1657.300 |
|
Other Income |
187.600 |
207.500 |
173.200 |
|
Operating Profit |
1611.200 |
1689.500 |
1830.500 |
|
Interest |
429.800 |
547.000 |
691.600 |
|
Exceptional Items |
(521.000) |
(330.800) |
0.000 |
|
PBDT |
660.400 |
811.700 |
1138.900 |
|
Depreciation |
453.900 |
512.600 |
538.600 |
|
Profit Before Tax |
206.500 |
299.100 |
600.300 |
|
Tax |
54.400 |
79.500 |
99.900 |
|
Provisions and contingencies |
0.000 |
0.000 |
0.000 |
|
Profit After Tax |
152.100 |
219.600 |
500.400 |
|
Extraordinary Items |
0.000 |
0.000 |
0.000 |
|
Prior Period Expenses |
0.000 |
0.000 |
0.000 |
|
Other Adjustments |
0.000 |
0.000 |
0.000 |
|
Net Profit |
152.100 |
219.600 |
500.400 |
KEY RATIOS
|
PARTICULARS |
|
31.03.2013 |
31.03.2012 |
31.03.2011 |
|
PAT / Total Income |
(%) |
3.39 |
4.24 |
10.99 |
|
|
|
|
|
|
|
Net Profit Margin (PBT/Sales) |
(%) |
4.73 |
6.21 |
14.46 |
|
|
|
|
|
|
|
Return on Total Assets (PBT/Total Assets} |
(%) |
4.15
|
5.23
|
10.52
|
|
|
|
|
|
|
|
Return on Investment (ROI) (PBT/Networth) |
|
0.07
|
0.09
|
0.15
|
|
|
|
|
|
|
|
Debt Equity Ratio (Total Debt/Networth) |
|
0.87
|
0.70
|
0.40
|
|
|
|
|
|
|
|
Current Ratio (Current Asset/Current Liability) |
|
1.31
|
2.87
|
3.93
|
FINANCIAL ANALYSIS
[all figures are in
Rupees Millions]
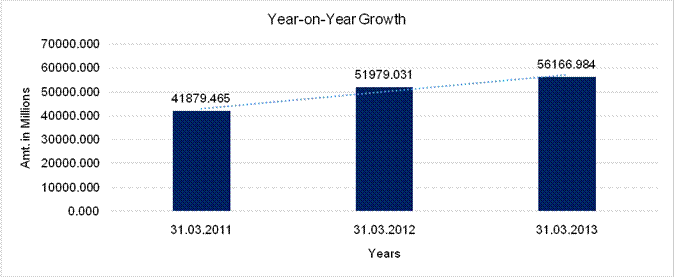
YEAR-ON-YEAR GROWTH
|
Year
on Year Growth |
31.03.2011 |
31.03.2012 |
31.03.2013 |
|
|
(Rs.
In Millions) |
(Rs.
In Millions) |
(Rs.
In Millions) |
|
Sales |
41879.465 |
51979.031 |
56166.984 |
|
|
|
24.116 |
8.057 |
NET PROFIT MARGIN
|
Net
Profit Margin |
31.03.2011 |
31.03.2012 |
31.03.2013 |
|
|
(Rs.
In Millions) |
(Rs.
In Millions) |
(Rs.
In Millions) |
|
Sales |
41879.465 |
51979.031 |
56166.984 |
|
Profit |
4640.661 |
2241.882 |
1934.140 |
|
|
11.08% |
4.31% |
3.44% |
LOCAL AGENCY FURTHER INFORMATION
|
Sr. No. |
Check List by Info Agents |
Available in
Report (Yes / No) |
|
1] |
Year of Establishment |
Yes |
|
2] |
Locality of the firm |
Yes |
|
3] |
Constitutions of the firm |
Yes |
|
4] |
Premises details |
No |
|
5] |
Type of Business |
Yes |
|
6] |
Line of Business |
Yes |
|
7] |
Promoter's background |
Yes |
|
8] |
No. of employees |
No |
|
9] |
Name of person contacted |
No |
|
10] |
Designation of contact
person |
No |
|
11] |
Turnover of firm for last
three years |
Yes |
|
12] |
Profitability for last
three years |
Yes |
|
13] |
Reasons for variation
<> 20% |
----- |
|
14] |
Estimation for coming
financial year |
No |
|
15] |
Capital in the business |
Yes |
|
16] |
Details of sister
concerns |
Yes |
|
17] |
Major suppliers |
No |
|
18] |
Major customers |
No |
|
19] |
Payments terms |
No |
|
20] |
Export / Import details
(if applicable) |
No |
|
21] |
Market information |
----- |
|
22] |
Litigations that the firm
/ promoter involved in |
Yes |
|
23] |
Banking Details |
Yes |
|
24] |
Banking facility details |
Yes |
|
25] |
Conduct of the banking
account |
----- |
|
26] |
Buyer visit details |
----- |
|
27] |
Financials, if provided |
Yes |
|
28] |
Incorporation details, if
applicable |
Yes |
|
29] |
Last accounts filed at
ROC |
Yes |
|
30] |
Major Shareholders, if
available |
Yes |
|
31] |
Date of Birth of
Proprietor/Partner/Director, if available |
Yes |
|
32] |
PAN of Proprietor/Partner/Director,
if available |
No |
|
33] |
Voter ID No of
Proprietor/Partner/Director, if available |
No |
|
34] |
External Agency Rating,
if available |
Yes |
LITIGATION DETAIL
IN THE HIGH COURT OF DELHI AT NEW DELHI
12
O.M.P. 410/2009
GAIL (INDIA) LIMITED..... Petitioner
Through Mr. Rajiv Tyagi, Advocate
versus
JINDAL SAW LIMITED .. Respondent
Through Mr. Arun Kumar Varma with Ms. Mansi Wadhera, Advocates
CORAM: JUSTICE S. MURALIDHAR
ORDER
22.11.2011
1. Learned counsel for the Petitioner states that the
arbitral record has been collected and will positively be placed in
a sealed cover in the Court within one week.
2. The Registry will thereafter de-seal original record in
accordance with rules to enable learned counsel for the parties to
flag the relevant documents in the arbitral record on which they
seek to rely. The parties will file their respective compilation of
documents and written submissions within eight weeks.
3. List in due course in the category of finals.
S. MURALIDHAR, J
NOVEMBER 22, 2011
INDEX OF CHARGES
|
S.NO. |
CHARGE ID |
DATE OF CHARGE
CREATION/MODIFICATION |
CHARGE AMOUNT
SECURED |
CHARGE HOLDER |
ADDRESS |
SERVICE REQUEST
NUMBER (SRN) |
|
1 |
10482837 |
24/02/2014 |
47,000,000,000.00 |
STATE BANK OF
PATIALA |
COMMERCIAL
BRANCH, CHANDRALOK BULIDING, 36, JANPATH, NEW DELHI - 110001, INDIA |
B98591951 |
|
2 |
10464618 |
10/12/2013 |
1,000,000,000.00 |
STATE BANK OF
MYSORE |
INDUSTRIAL FINANCE
BRANCH, 15/17,, SHAHEED BHAGAT |
B91312777 |
|
3 |
10467360 |
27/11/2013 |
4,000,000,000.00 |
STATE BANK OF
INDIA |
CORPORATE
ACCOUNTS GROUP BRANCH, JAWAHAR VYAPAR, |
B92446202 |
|
4 |
10414412 |
21/03/2013 |
1,000,000,000.00 |
DEUTSCHE BANK |
4TH FLOOR, DLF
SQUARE, JACARANDA MARG, DLF PHASE |
B71674378 |
|
5 |
10411946 |
19/03/2013 * |
3,000,000,000.00 |
AXIS TRUSTEE
SERVICES LIMITED |
AXIS HOUSE, 2ND
FLR, BOMBAY DYEING MILLS COMPOUND, PANDURANG BUDHKAR MARG, WORLI, MUMBAI -
400025, MAHARASHTRA, INDIA |
B70931746 |
|
6 |
10397818 |
03/06/2013 * |
1,000,000,000.00 |
AXIS TRUSTEE
SERVICES LIMITED |
AXIS HOUSE, 2ND
FLR, BOMBAY DYEING MILLS COMPOUND, PANDURANG BUDHKAR MARG, WORLI, MUMBAI -
400025, MAHARASHTRA, INDIA |
B77248375 |
|
7 |
10375391 |
14/09/2012 |
2,370,000,000.00 |
ICICI BANK
LIMITED |
LANDMARKRACE COURCE
CIRCLE, ALKAPURI, BARODA - 390015, GUJARAT, INDIA |
B57641730 |
|
8 |
10360631 |
23/05/2012 |
500,000,000.00 |
KARNATAKA BANK
LIMITED |
K - BLOCK,
OVERSEAS BRANCH,, CONNAUGHT PLACE, NEW |
B41628355 |
|
9 |
10360634 |
23/05/2012 |
500,000,000.00 |
KARNATAKA BANK
LIMITED |
K - BLOCK,
OVERSEAS BRANCH, CONNAUGHT PLACE, NEW |
B41629742 |
|
10 |
10360642 |
08/05/2012 |
1,370,000,000.00 |
KARNATAKA BANK
LIMITED |
K-2, CHOUDHRY BUILDING,
CANNAUGHT PLACE, NEW DELHI - 110001, INDIA |
B41632894 |
|
11 |
10298410 |
25/07/2011 |
6,500,000,000.00 |
STATE BANK OF
INDIA |
CORPORATE
ACCOUNTS GROUP BARANCH, JAWAHAR VYAPAR, |
B17282294 |
|
12 |
10297075 |
06/07/2011 * |
3,000,000,000.00 |
AXIS TRUSTEE
SERVICES LIMITED |
AXIS HOUSE, 2ND
FLR, BOMBAY DYEING MILLS COMPOUND, PANDURANG BUDHKAR MARG, WORLI, MUMBAI -
400025, MAHARASHTRA, INDIA |
B17593559 |
|
13 |
10286630 |
29/04/2011 |
40,000,000,000.00 |
ICICI BANK
LIMITED |
LANDMARKRACE
COURCE CIRCLE, ALKAPURI, BARODA - 390015, GUJARAT, INDIA |
B12859559 |
|
14 |
10250853 |
24/10/2013 * |
39,100,000,000.00 |
STATE BANK OF
PATIALA (LEAD BANK) |
COMMERCIAL BRANCH,
CHANDRALOK BUILDING, 2ND FLOOR, 36, JANPATH, NEW DELHI - 110001, INDIA |
B88609029 |
|
15 |
10152604 |
21/03/2009 |
37,000,000,000.00 |
STATE BANK OF
PATIALA (LEAD BANK) |
COMMERCIAL BRANCH,
CHANDRALOK BUILDING, 2ND FLOOR, 36, JANPATH, NEW DELHI - 110001, INDIA |
A60327673 |
|
16 |
10118974 |
13/08/2011 * |
1,900,000,000.00 |
AXIS BANK
LIMITED |
4/10, OPG HOUSE,
ASAF ALI ROAD, NEW DELHI, DELHI |
B22554810 |
|
17 |
10022913 |
31/10/2006 |
37,000,000,000.00 |
STATE BANK OF
PATIALA |
COMMERCIAL
BRANCH, 2ND FLOOR, CHANDRALOK BUILDIN |
A05687629 |
|
18 |
90280740 |
13/12/2004 |
250,000,000.00 |
BANK OF
RAJASTHAN LTD. |
82, JANPATH, NEW
DELHI, DELHI - 110001, INDIA |
- |
|
19 |
90280699 |
08/11/2004 |
9,200,000,000.00 |
STATE BANK OF
PATIALA |
C0MMERCIAL
BRANCH, CHANDRALOK BUILDING; JANPATH, NEW DELHI, DELHI, INDIA |
- |
|
20 |
90275824 |
29/03/2004 * |
250,000,000.00 |
BANK OF
MAHARASHTRA |
19/21, AMBALAL
DOSHI MARG; FORT, MUMBAI - 400023, MAHARASHTRA, INDIA |
- |
|
21 |
90275797 |
07/10/2003 |
150,000,000.00 |
IDBI BANK LTD. |
11TH FLOOR;
SURYA KIRAN BUILDING, 19; K.G. MARG, |
- |
|
22 |
90277561 |
30/04/2005 * |
100,000,000.00 |
IDBI TRUSTEESHIP
SERVICES LTD. |
10TH FLOOR;
NARIMAN BHAVAN, 227; VINAY K. SHAH MA |
- |
|
23 |
90277560 |
30/09/2003 * |
100,000,000.00 |
IDBI TRUSTEESHIP
SERVICES LIMITED |
10TH FLOOR;
NARIMAN BHAVAN, 227; VINAY K. SHAH MA |
- |
|
24 |
90275728 |
11/09/2003 * |
1,330,000,000.00 |
STATE BANK OF
PATIALA |
COMMERCIAL
BRANCH, CHANDRALOP BUILDING; JANPATH, |
- |
|
25 |
90275441 |
11/09/2003 * |
200,000,000.00 |
INDUSTRIAL BANK
OF INDIA |
INDIAN RED CROSS
SOCIETY BLDG., 1; RED CROSS ROAD, NEW DELHI, DELHI, INDIA |
- |
|
26 |
90279928 |
07/08/2001 |
200,000,000.00 |
INDUSTRIAL DEVELOPMENT
BANK OF INDIA |
INDIAN RED CROSS
SOCIETY BLDG., 1; RED CROSS ROAD, NEW DELHI, DELHI, INDIA |
- |
|
27 |
90275099 |
21/07/1999 |
1,151,500,000.00 |
STATE BANK OF
PATIALA |
30; REGAL
BUILDING, PARLIAMENT STREET, NEW DELHI, DELHI, INDIA |
- |
|
28 |
90275088 |
30/06/1999 |
150,000,000.00 |
INDUSTRIAL
DEVELOPMENT BANK OF INDIA |
IDBI TOWER,
CUFFE PARADE; COLABA, MUMBAI - 400005, MAHARASHTRA, INDIA |
- |
|
29 |
90277049 |
11/09/2003 * |
100,000,000.00 |
INDUSTRAIL
DEVELOPMENT BANK OF INDIA |
IDBI TOWER, CUFFE
PARADE; COLABA, MUMBAI - 400005, MAHARASHTRA, INDIA |
- |
|
30 |
90277037 |
18/03/1999 * |
150,000,000.00 |
INDUSTRIAL
DEVELOPMENT BANK OF INDIA |
IDBI TOWER,
CUFFE PARADE; COLABA, MUMBAI - 400005, MAHARASHTRA, INDIA |
- |
|
31 |
90275001 |
28/12/1998 |
100,000,000.00 |
INDUSTRIAL
DEVELOPMENT BANK OF INDIA |
IDBI TOWER,
CUFFE PARADE; COLABA, MUMBAI - 400005, MAHARASHTRA, INDIA |
- |
* Date of charge modification
UNSECURED LOANS
|
PARTICULAR |
31.03.2013 (Rs.
in Millions) |
31.03.2012 (Rs.
in Millions) |
|
LONG TERM
BORROWINGS |
|
|
|
i) External Commercial Borrowings from Banks |
5004.813 |
4707.336 |
|
ii) Deferred Sales Tax Loans |
355.008 |
434.248 |
|
iii) Deposits from Public |
92.397 |
175.153 |
|
|
|
|
|
SHORT TERM BORROWINGS |
|
|
|
iv) From Banks |
|
|
|
- Short Term loan |
2175.572 |
2097.417 |
|
- Buyers' credit |
1851.495 |
3993.010 |
|
v) Deposits from Public |
0.737 |
1.404 |
|
Total |
9480.022 |
11408.568 |
|
NOTE: Deposits from public includes
deposits from related parties Rs.
27.937 Millions (Previous Year Rs. 13.490 Millions). Terms
of repayment of Unsecured Term Loans – i) External Commercial Borrowing
of USD 73,018,334 (Rs. 3971.416 Millions) (Previous Year
USD73,018,334- Rs. 3735.362 Millions) is repayable
in three installments of USD 24,096,050 (Rs.
1310.567 Millions), USD
24,096,050 (Rs. 1310.567 Millions) and USD 24,826,234 (Rs. 1350.282 Millions) on June 30, 2015, June 30, 2016 and
June 30, 2017, respectively. Rate of Interest is 6 months USD LIBOR plus
2.55% p.a. ii) External Commercial
Borrowings of USD 19,000,000 (Rs.
1033.397 Millions) (Previous Year
USD 19,000,000- Rs. 971.974 Millions) is repayable in
three installments of USD 5,700,000 (Rs.
310.019 Millions), USD 5,700,000
(Rs. 3,100.19 Millions) and USD 7,600,000 (Rs. 413.359 Millions) on Nov 27, 2015, Nov 27, 2016 and
Nov 27, 2017, respectively. Rate of Interest is 6 months USD LIBOR plus 2.30%
p.a. Deposits from public are
repayable between one to three years. There is no default in repayment
of Principal loans and interest. |
||
REVIEW OF
OPERATIONS
The Company
produced 8,80,822 MT pipes in 2012-13 as against 854,880 MT in 2011-12.
Saw Pipe Segment : Sale under this segment
remained volatile from quarter to quarter on account of the delivery schedules
of the buyers as well as lower order book. The operating profit remained under
pressure largely due to significant competition and poor demand conditions in
domestic and international markets.
DI Pipe Segment : Ductile Iron (DI) pipes segment has seen
improved performance which is likely to continue. Small DI pipe facility with
blast furnace capacity of approx. 2,00,000 MTPA was put to commercial operation
in the quarter ended 31st March 2013. Production has started and the capacity
is being gradually ramped up as the production process gets stabilised. The
Coke Oven facility and the incremental captive power generation facility
related to the DI plant will be commissioned in 2013-14. These facilities are
expected to stabilise in the coming months.
Seamless Segment : This segment has
witnessed weaker demand, production and sales. The situation is expexted to
improve gradually in domestic and export market. Mining : Operations have
commenced in FY 2012-13 and they produced 212,487 MT of concentrate, a part of
which was used captively. The beneficiation has resulted in improvement in Fe
content. However, the material still needs stability in composition. Mining
operation along with pellets expected to bring benefits from the year 2013-14.
MANAGEMENT
DISCUSSIONS AND ANALYSIS
COMPANY OVERVIEW
They are India’s
most diversified manufacturer and supplier of pipe products for the energy,
water industry and other industrial applications. Their customers include most
of the world’s leading oil and gas companies, municipal corporations as well as
engineering companies engaged in constructing oil and gas gathering, water transportation
system, power and automobiles facilities. Their principal products include (a)
large diameter SAW pipes (Longitudinal Submerged Arc Welded (LSAW) and
Helically Submerged Arc Welded (Spiral/ HSAW), (b) Seamless Tubes, and (c)
Ductile Iron (DI) pipes. Their manufacturing facilities are located in western,
northern and southern part of India. Their Indian production facilities produce
pipes to meet global specifications and standards. They sell appox.50% of their
products in global markets. They are one of the largest global producers of
Ductile Iron pipes with manufacturing facilities in India, UAE and Europe.
They have secured
Iron Ore Mines in Rajasthan on a 30 years lease and has set up facilities at
the mine head for preparation of Iron Ore Concentrate and production of Iron
Ore Pellets. Iron Ore Pellets are currently in demand for manufacture of Sponge
Iron and other products. They expects to set up facilities to produce Steel
Ingot and Sponge Iron as a forward integration and further value addition. The
new facilities are expected to go into production in 2014-15.
OIL AND GAS SECTOR REVIEW
The Oil and Gas
business is a global industry with many dimensions impacting their day to day
lives. The industry serves the 7 billion populations with nearly 60% of their
energy requirements. Globally the energy market is growing continuously and
rapidly with Oil and Gas firms investing significantly in maintaining and
increasing their share in the market. This has a direct relevance with the
increasing energy demand by the developing nations like China and India; hence
deep water, arctic regions, etc are being explored for new finds.
International
policies and political disturbances are bringing in a new dimension to the
business. Oil and Gas are flowing continuously through tankers and pipelines
from Middle East, Latin America, Africa, etc to various other developed,
developing and under developed nations. Water ways being the preferred route
for transporting Crude oil and petroleum products, pipelines see their own
importance for the transfer of Natural Gas across geographies owing to the
uninterrupted supply and being economical.
The International
Energy Outlook 2011 (IEO2011), released by the U.S. Energy Information
Administration (EIA), shows world energy use increasing 53% by 2035 with China
and India accounting for half of the total growth. Other key findings in the
Outlook indicate that the economies of China and India are among those least
affected by the prolonged global recession.
With strong economic
growth projected in both countries, their combined energy use will more than
double by 2035, when they account for 31% of energy consumption. In 2035 the
report indicates that China's energy demand will be 68% higher than in the U.S.
The per capita oil and gas consumption has grown significantly in India and
China while Europe has seen a drop in oil and gas consumption. This demand has
seen the Oil prices go beyond $100 mark. Also the increase in Gas Pipelines has
seen a surge in consumption centers for Natural Gas and Shale Gas across the
globe. Natural gas is emerging as a better fuel for domestic as well as
industrial consumption. This along with high transportation costs is prompting
new pipelines to be established.
The Outlook notes
that world natural gas trade, both by pipeline and by LNG, is expected to rise.
Most of the projected increase in LNG supply comes from the Middle East and
Australia where several projects should become operational in the next decade.
World liquefaction capacities will more than double in 2035. Pipelines under
construction or planned will increase natural gas exports from Africa to
European markets and from Eurasia to China.
In India, Oil and Gas industry has
been growing at the rate of 9% over FY 2009-12. While India’s Crude Oil
consumption has grown at CAGR of 4.3% for the last ten years, Natural Gas
consumption has also increased from 2.7 to 5.9 bcf per day in the last ten
years. The government has been keen on securing energy needs by increasing
international footprints in the upstream sector and developing domestic gas
infrastructure. The demand of petroleum products is expected to increase at a
CAGR of 4.7% while that of Natural Gas will see a CAGR of 19.2%. Also, the
natural gas demand would rise to 115 to 135 bcm by 2020 of this 70- 90 bcm
could be produced within nation and rest has to be imported; pipelines would
then play a vital role to bridge this gap.
LARGE DIA
WELDED PIPES
Pipelines are the backbone of a nation’s
infrastructure. Pipes are used in Automobiles, airports, metros, malls, Oil
exploration, crude oil, product and gas transportation and for water and
sanitation purposes. Owing to growing energy demand and cost of transporting
hydrocarbons through other sources like rail and road becoming expensive,
pipeline networks are laid to make hydrocarbons reach its users let it be
domestic or industrial. These pipes see a varied application across various Oil
and Gas and Non Oil sectors. The location of use (over-ground, below ground or
under water), pressure and temperature of fluid flowing, volume of fluid are
some of the major parameters that decide the class of pipe to be used. Based on
the type of fluid flowing through the pipelines and the surroundings, relevant
coating is also done internally and externally to increase the life of the
pipelines with robust economic recovery expected to continue in China, India,
and other non-OECD nations, it is no surprise the Asia/ Pacific accounts for
the highest number of new and planned pipeline miles. India has announced plans
to double its natural gas pipeline network over the next five years including
development of a national gas grid by 2017. Middle East is also seeing
substantial increases in energy demand which could lead to more pipelines.
Welded pipes (LSaw and Spiral)
market, though encountering overcapacity conditions particularly in North
America, is expected to witness steady growth in the upcoming years driven by
the implementation of new pipeline projects. Investments in oil and gas
exploration and production, which are influenced by prevailing crude oil and
gas prices, have a considerable impact on the demand for LSaw and HSaw Pipes,
Resurgent world economy and consequent increase in the demand for industrial
natural gas is expected to drive up momentum of the welded pipes market.
Global demand for HSaw pipes, which
are primarily used in the transportation of oil and gas and in water
transportation projects, is closely linked to the investments in the energy
sector. The energy sector makes use of HSaw pipes with diameters of up to 60”
and up to 80 feet in length. Another factor that is expected to fuel demand for
HSaw is new pipeline construction activity due to the shift of population from
traditional centers that would necessitate development of infrastructure for
delivering oil and natural gas to the new locations.
Despite the prevailing conditions,
potential opportunities areexpected primarily from the implementation of new
pipelineprojects in the upcoming years, resurgent growth of the USeconomy, and
increased demand from natural gas exploration operations. Also, overcapacity
conditions are expected to fade away in the coming years, as several
megaprojects are set to be taken up across the world, particularly in regions
such as Southeast Asia, Australia, Middle East, Africa, and West Asia.
SEAMLESS
PIPES AND TUBES
As per a comprehensive global
report by Global Industry Analyst INC (GIA) on the Seamless Pipes and Tubes
markets. Global market for Seamless Pipes and Tubes is projected to reach 113.8
million tons by 2018, with demand growth mirroring the dynamics of the energy
sector and gains led by the rise in rig count and increasing prices of oil and
gas, particularly in North America, the Middle East and Latin America.
Oil and gas industry generally
exhibit resilience to periods of economic slump due to the fact that energy
demand continues to rise even when conventional reserves of oil and gas are
rapidly shrinking. Apart from the energy sector the demand for seamless pipes
and tubes also emerges from automobile, power generation and fertilizers
markets, among others. Demand growth for seamless steel pipes and tubes is
expected from high energy-consuming countries across Middle East, Asia, Australia,
and Latin America, which are intensifying oil and gas exploration activity to
meet the escalating demand from respective domestic markets. In North America
and Europe, increased focus on developing shale gas reserves for ensuring
energy security is expected to offer opportunities for seamless pipe makers.
High potential also exists for products such as oil country tubular goods
(OCTG) and structural tubes, due to new offshore drilling and exploration
activity, and installation of pipelines for transporting petrochemicals.
Escalating demand for energy from emerging nations and the subsequent increase
in the number of crude oil and gas development projects are expected to enhance
the demand for seamless pipes and tubes. Increase in offshore drilling operations
and anticipated rise in refinery and chemical plant activity levels are also
expected to augur well for the seamless pipes market. Seamless OCTG segment
continues to benefit from the intensifying activity in the energy exploration
industry, and increased emphasis on tapping shale gas. Further, increasing
complexity of drillingoperations, due to the fact that most of the remaining
oil and gas reserves are largely found in difficult-to-reach areas or in areas
that require digging to greater depths, are driving demand
for seamless OCTG products.
As per the report, Asia-Pacific
represents the largest regional market worldwide with the energy sector
accounting for significant proportion of the sales. Increased activity in
various end-use sectors such as oil and gas, power, and refineries, and
resurgent growth in automobile sector is expected to fuel demand for steel
pipes and tubes in the region. The demand for seamless pipes and tubes in
Middle East and Latin America is expected to post the fastest growth over the
analysis period. In the Middle East, strong economic growth particularly in
countries such as Saudi Arabia and UAE, rising oil prices and the increasing
rig count are contributing to the enhanced demand for seamless pipes and tubes.
In the near future, the region is expected to witness intensified demand for
line pipes of smaller diameters, in view of the growth in refining operations.
The US market for seamless pipes, particularly OCTG pipes, remains favorable
owing to the strong rise in rig count, which has offset the decline in the gas
rig count as a result of fall in gas prices.
WATER SECTOR
REVIEW
Globally 70% of fresh water is used
for agriculture, 20% for Industrial and 10% for domestic consumption. Fresh
water consumption has grown three folds in the last 50 years. The present water
consumption stands at around 1850 billion cum per year. The population is
growing by around 80 million every year which accounts for increase in demand
for water at 64 billion cum a year.
Global demand for water pipe is
forecast to increase 6.8 percent per year through 2017 to almost 14 billion
meters, an acceleration from the pace of the 2007- 2012 period. Advances will
result from two key factors: in developing nations, access to water supply and
sanitation will be increased; in developed nations, a rebound in construction
spending will boost demand for building pipe.
In India, the water-piping sector
mainly caters to the irrigation and drinking purposes, as water requirement is
the highest for these two sectors. Various schemes of Government of India have
opened new avenues and opportunities in this sector where there is already an requirement
of developing water infrastructure. The country’s vast population makes
infrastructure and sewage system development a necessity, supporting demand by
households that previously did not have a piped water supply.
SUBSIDIARIES
The Company has
operations through subsidiaries in India and offshore. In India,the company has
presence and operations in Infrastructure space through its subsidiary company
names JITF Infrastructure Limited. Besides, the Company also another subsidiary
named, IUP Jindal Metals and Alloys Limited which is engaged in manufacturing
of rerolling of stainless steel,
The Company has
operations in Abu Dhabi (UAE) and Italy (Europe) through 100% subsidiaries
designated as special purpose vehicles. These subsidiaries deals in
manufacturing of Ductile Iron Pipes. The businesses are being streamlined at
these locations.
Jindal Saw
Limited, has made forays into some niche infrastructure segments, through its
wholly owned subsidiary Jindal ITF Limited (JITF). Few of these niche areas
directly concerning the general masses are Water Infrastructure, Waste Water Management
and reuse, Municipal Solid Waste management, Clean and Renewable Energy
generation, Environment friendly Cargo transportation, which JITF is doing on
its own (NTPC Water borne coal handling Project at Farrakka, and through JITF
Water Infrastructure Ltd, and JITF Urban Infrastructure Ltd. JITF’s other
foreys are also maiden initiatives in country’s Manufacturing sector – Jindal
Rail Limited, and Eco-Friendly and Cost Effective large scale Cargo movement -
JITF Waterways Limited.
During the year, Jindal
ITF Ltd, has shown distinctive project execution skills in terms of high
technology oriented projects, being implemented for the first time in the
country, successfully. Some of its major achievements are as
under:
1. JITF Water Infrastructure Limited- Implementing
Country’s first green field Water Infra Project in Naya Raipur, comprising of
Intake system at the river, pumping in large dia pipes to Water Treatment
plant, taking treated water to scores of Underground reservoirs (UGRs),
Overhead Tanks ( OHTs), networking of distribution pipelines including local
pumping stations, eventually leading to Metering/Billing and Collection. These
works hitherto managed by Municipal Corporations, PWD, CPWD, Jal Boards etc,
were executed with complete in house Design and Engg by JITF Water Infra. It
actually resulted in a Water being transported for several kilometers by a 60
inch Dia pipe to eventually a 1 inch Dia pipe. It has been completed
successfully and O and M being managed for 7 years.
Besides, JITF Water
Infra is executing projects from Pondicherry to Guwahati, including several in
other parts like Bihar, U P, Odissa, Karnataka etc.
2. JITF Urban Infrastructure Limited- Waste
Management- JITF achieved COD in country’s first Waste to Energy Plant at Delhi.
It is fully operational and running successfully. JITF claims to be having
country’s only operational Waste management Plant, where 1950 MTPD of MSW is
being reduced both in weight and Volume on daily basis and is also generating
Renewable energy of 17MW on continuous basis. Plant has been visited by various
Corporations, ULBs, Urban development Depts., to emulate its example in their
area/state. In a country of Low Land Mass and High Population Density, such a
Waste to Energy plant has proven a boon.
It is now involved
in serious execution of Few Waste management Projects in Punjab, Augmentation
in the generation capacity at Okhla.
3. Jindal Rail Limited- Stainless Steel
Railway Wagon manufacturing : Jindal Rail has successfully achieved the COD of
country’s first fully atomized Stainless Steel railway Wagon manufacturing
facility at Karjan, Vadodara, in
Gujarat. RDSO has
to develop a new standard for giving approval for its Product and manufacturing
Process. RDSO discarded the old Wagon Standard of G-93 to adopt new standard of
G-105. The plant is fully automated and Robotic controlled, akin to a modern
automobile manufacturing unit.
4. Jindal ITF Limited- NTPC Project-
Water Borne Coal Transportation : For the first time in the country, Jindal ITF
Limited, has started completely water borne imported coal transportation from
High Seas to Coal Stock yard of NTPC , where the coal will not touch the land
route after being exported by the exporting country. A fleet of mid size ships,
River – Sea worthy barges, and a Transhipper will operate to significantly
reduce the cost of local transportation of imported coal for NTPC. Buoyed by
seeing the meticulous implementation of the project by JITF, NTPC has come up
with another similar tender for another such project on the stretch of Ganges,
where JITF is a strong contender.
5. JITF Waterways Limited- is successfully
sailing Coastal vessels both on the east coast as well as on the west coast.
During the year, JITF Waterways has sold off couple of old vessels and has
procured a large capacity panama vessel, to add to the overall capacity. JITF
Waterways continues to provide low cost, reliable, alternate mode of
transportation option to Industry. It is also planning to utilize its Bulk
Vessel fleet to economize of Cost of Coal Transportation for NTPC Coal handling
project in Farrakka.
JITF is now
involved in bidding process for another water borne Coal Transportation project
for NTPC in Barh, Bihar All the above initiatives were first in terms of
technology as well as discovery of a Revenue Model in the country, and have
since been successfully implemented.
CONTINGENT
LIABILITIES:
(Rs. in millions)
|
PARTICULARS |
31.03.2013 |
31.03.2012 |
|
a) Guarantees issued by the Company's
bankers on behalf of the Company |
8772.140 |
8740.313 |
|
b) Letter of Credit Outstanding |
2451.321 |
9290.142 |
|
c) Claims against the company not
acknowledged as debt |
8.122 |
49.521 |
|
d)
Corporate guarantees/ undertaking issued to lenders of subsidiary companies |
9159.656 |
4360.991 |
|
e) Disputed Excise duty, Custom
Duty and service tax |
22.927 |
21.213 |
|
f) Income tax demands against
which company has preferred appeals |
260.959 |
195.058 |
|
g) Disputed Sales Tax |
58.541 |
65.000 |
|
h)
Liability in respect of Corporate Guarantee/Duty Saved for availing various
export based incentive schemes |
1147.981 |
1147.951 |
UNAUDITED
FINANCIAL RESULTS FOR THE QUARTER AND NINE MONTHS ENDED 31ST
DECEMBER, 2013
PART I
(Rs. In Millions)
|
S. No. |
Particulars |
Quarter Ended |
Nine Months Ended |
|
|
31.12.2013 |
30.09.2013 |
31.12.2013 |
||
|
Unaudited |
Unaudited |
Unaudited |
||
|
1 |
Income from Operations |
|
|
|
|
|
(a) Net Sales /Income from Operations (Net of excise
duty) |
17094.500 |
12237.100 |
41398.600 |
|
|
(b) Other Operating Income |
1.600 |
56.800 |
61.500 |
|
|
Total Income from Operations (net) |
17096.100 |
12293.900 |
41460.100 |
|
2 |
Expenses |
|
|
|
|
|
(a) Cost of materials consumed |
9163.100 |
8408.300 |
25165.300 |
|
|
(b) Purchases of Stock-in-Trade |
-- |
-- |
-- |
|
|
(c) Changes in inventories of finished goods,
work-in-progress and Stock-in-Trade |
1908.800 |
(703.800) |
1492.700 |
|
|
(d) Employee benefits expense |
787.300 |
767.000 |
2234.500 |
|
|
(e) Depreciation and amortization expense |
538.600 |
512.600 |
1505.100 |
|
|
(f) Other expenses |
3579.600 |
2340.400 |
8004.700 |
|
|
Total expenses |
15977.400 |
11324.500 |
38402.300 |
|
3 |
Profit/(Loss) from Operations before other Income,
finance costs and Exceptional Items (1-2) |
1118.700 |
969.400 |
3057.800 |
|
4 |
Other Income |
145.200 |
207.500 |
540.300 |
|
5 |
Profit/(Loss) from ordinary activities before finance
costs and Exceptional Items (3+4) |
1263.900 |
1176.900 |
3598.100 |
|
6 |
Financial costs |
691.600 |
547.000 |
1668.400 |
|
7 |
Profit/(Loss) from ordinary activities after finance
costs but before Exceptional Items (5-6) |
572.300 |
629.900 |
1929.700 |
|
8 |
Exceptional Items |
(28.000) |
330.800 |
823.800 |
|
9 |
Profit/(Loss) from Ordinary Activities before tax
(7-8) |
600.300 |
299.100 |
1105.900 |
|
10 |
Tax expense |
99.900 |
79.500 |
233.800 |
|
11 |
Net Profit/(Loss) from Ordinary Activities after tax
(9-10) |
500.400 |
219.600 |
872.100 |
|
12 |
Extraordinary Items (Net of Tax expense) |
-- |
-- |
-- |
|
13 |
Net Profit/(Loss) for the period (11-12) |
500.400 |
219.600 |
872.100 |
|
14 |
Paid up equity share capital (?2 per share) |
552.500 |
552.500 |
552.500 |
|
15 |
Reserves excluding Revaluation Reserves |
|
|
|
|
16 |
Debenture Redemption Reserve |
|
|
|
|
17.i |
Earnings Per Share before Extraordinary items (on Face Value of Rs. 2/- each) (not annualized): |
|
|
|
|
|
Basic |
1.81 |
0.79 |
3.15 |
|
|
Diluted |
1.81 |
0.79 |
3.15 |
|
17.ii |
Earnings Per Share after Extraordinary items (on Face Value of Rs. 2/- each) (not annualized): |
|
|
|
|
|
Basic |
1.81 |
0.79 |
3.15 |
|
|
Diluted |
1.81 |
0.79 |
3.15 |
|
PART II |
|
|
|
|
|
A |
PARTICULARS OF SHAREHOLDING |
|
|
|
|
1 |
Public shareholding |
|
|
|
|
|
— Number of shares |
148401416 |
148401416 |
148401416 |
|
|
— Percentage of shareholding |
53.73 |
53.73 |
53.73 |
|
2 |
Promoters and promoter group Shareholding |
|
|
|
|
|
a) Pledged/Encumbered |
|
|
|
|
|
— Number of shares |
-- |
-- |
-- |
|
|
— Percentage of shares (as a % of the total |
-- |
-- |
-- |
|
|
shareholding of promoter and
promoter group) |
|
|
|
|
|
— Percentage of shares (as a % of the total |
-- |
-- |
-- |
|
|
share capital of company) |
|
|
|
|
|
b) Non-encumbered |
|
|
|
|
|
— Number of shares |
127822105 |
127822105 |
127822105 |
|
|
— Percentage of shares (as a % of the total |
100.00 |
100.00 |
100.00 |
|
|
shareholding of promoter and
promoter group) |
|
|
|
|
|
— Percentage of shares (as a % of the total |
46.27 |
46.27 |
46.27 |
|
|
share capital of company) |
|
|
|
|
|
Particulars |
Quarter Ended (31.12.2013) |
|
B |
INVESTOR COMPLAINTS (Nos.) |
|
|
|
Pending at the beginning of the quarter |
Nil |
|
|
Received during the quarter |
2 |
|
|
Disposed of during the quarter |
2 |
|
|
Remaining unresolved at the end of the quarter |
Nil |
NOTES:
Exceptional items:
1.Due to significant movement and volatility in the value of Indian rupee against foreign currencies, the net foreign exchange gain /(loss) on account of differences and reinstatement in foreign exchange transactions is considered by the company as "exceptional" in nature which primarily relates to finance, sales and purchase of raw materials.
Hower, such differences, related to sales and purchase of raw materials, amounting to Rs. 488.600 Millions (gain) and Rs. 723.300 Millions (Loss) for the quarter ended 31st December, 2012 and Rs. 134.600 Millions (gain) and Rs. 33.600 Millions (gain) for the nine months ended 31st December, 2012 were included under the respective heads.
The company is a net exporter and follows natural hedging policy to manage its foreign exchange exposure.
2.Tax Expense consists of Income Tax and Deferred Tax.
3.The Company has only one business segment namely 'Iron and Steel Products" as primary segment.
4.Previous period/ year figures have been re-grouped/re-arranged wherever considered necessary.
5.These results were reviewed by the Audit Committee and approved by the Board of Directors in their meeting heald on 30th January, 2014. The Statutory Auditors have carried out Limited Review of these financial results
FIXED ASSETS
v
Tangible
Assets
· Free Hold Land
· Lease Hold Land
· Building
· Plant and Equipment
· Furniture and Fixtures
· Mine Development
· Vehicles
· Office Equipment
v
Intangible
Assets
· Computer Software
· Mining Properties (Stripping Cost)
PRESS RELEASE
JINDAL SAW APPOINTS MR. NEERAJ KUMAR AS GROUP CEO AND WHOLE TIME
DIRECTOR
New Delhi, 1st July, 2013: Jindal SAW Limited, a part of O.P. Jindal Group, announced the appointment of Mr. Neeraj Kumar as Group Chief Executive Officer and Whole Time Director with effect from July 1, 2013.
Prior to joining Jindal SAW, Mr. Kumar was working as MD and CEO of ORIX Auto Infrastructure Services Ltd (OAIS), a joint venture company of Infrastructure Leasing and Financial Services Ltd. (ILandFS). He has been associated with large Indian business houses, top multinationals and financial institutions across core infrastructure, commodity, service and financial sectors in the past. Mr. Kumar has earlier worked with Jindal SAW Limited as Director (Finance) and CFO from the year 2002 to 2006.
An MBA in Finance and International Finance, Mr. Kumar has represented private sector companies at Euro Money and CLSA Global and Asia conferences. He has featured regularly in business journals like Asia Risk and Business India.
JINDAL SAW LIMITED ANNOUNCES THE UNAUDITED FINANCIAL RESULTS
(STANDALONE) FOR THE 2ND QUARTER ENDED 30TH SEPTEMBER 2012
30 OCT 2012
Jindal SAW Limited, a total pipe solutions company in the country, announced its Unaudited Financial Results for the 2nd quarter ended September 30th, 2012 as adopted by the Board of Directors in the meeting held today.
The Net Turnover for the second quarter stands at Rs. 16352.000
millions in comparison to Rs. 14459.000 millions in the corresponding quarter
last year. Blended EBITDA of the second quarter ended September 30th, 2012, is
approximately Rs. 8595 PMT of total pipes sold whereas the EBITDA for the 2nd
quarter ended September 30th 2011 was approximately Rs. 7313 PMT of pipes sold.
Company is witnessing a progressive demand along with a healthy trend in
medium to long term but currently the demand is witnessing a weaker trend due
to mismatch in demand and supply leading to pressure on realization and
profitability. Further, the company is expected to get benefits of the
investments made / to be made in various projects including iron ore and pallet
plant which would add to the turnover and profitability of the company in
future.
CMT REPORT (Corruption, Money Laundering & Terrorism]
The Public Notice information has been collected from various sources
including but not limited to: The Courts,
1] INFORMATION ON
DESIGNATED PARTY
No records exist designating subject or any of its beneficial owners, controlling
shareholders or senior officers as terrorist or terrorist organization or whom
notice had been received that all financial transactions involving their assets
have been blocked or convicted, found guilty or against whom a judgement or
order had been entered in a proceedings for violating money-laundering,
anti-corruption or bribery or international economic or anti-terrorism sanction
laws or whose assets were seized, blocked, frozen or ordered forfeited for
violation of money laundering or international anti-terrorism laws.
2] Court Declaration :
No records exist to suggest that subject is
or was the subject of any formal or informal allegations, prosecutions or other
official proceeding for making any prohibited payments or other improper payments
to government officials for engaging in prohibited transactions or with
designated parties.
3] Asset Declaration :
No records exist to suggest that the property or assets of the subject
are derived from criminal conduct or a prohibited transaction.
4] Record on Financial
Crime :
Charges or conviction
registered against subject: None
5] on Violation of
Anti-Corruption Laws :
Charges or
investigation registered against subject: None
6] Records on Int’l
Anti-Money Laundering Laws/Standards :
Charges or
investigation registered against subject: None
7] Criminal Records
No
available information exist that suggest that subject or any of its principals
have been formally charged or convicted by a competent governmental authority
for any financial crime or under any formal investigation by a competent
government authority for any violation of anti-corruption laws or international
anti-money laundering laws or standard.
8] Affiliation with
Government :
No record
exists to suggest that any director or indirect owners, controlling
shareholders, director, officer or employee of the company is a government
official or a family member or close business associate of a Government
official.
9] Compensation Package :
Our market
survey revealed that the amount of compensation sought by the subject is fair
and reasonable and comparable to compensation paid to others for similar
services.
10] Press Report :
No press reports / filings exists on
the subject.
CORPORATE GOVERNANCE
MIRA INFORM as part of its Due Diligence do provide comments on
Corporate Governance to identify management and governance. These factors often
have been predictive and in some cases have created vulnerabilities to credit
deterioration.
Our Governance Assessment focuses principally on the interactions
between a company’s management, its Board of Directors, Shareholders and other
financial stakeholders.
CONTRAVENTION
Subject is not known to have contravened any existing local laws,
regulations or policies that prohibit, restrict or otherwise affect the terms
and conditions that could be included in the agreement with the subject.
FOREIGN EXCHANGE RATES
|
Currency |
Unit
|
Indian Rupees |
|
US Dollar |
1 |
Rs.60.04 |
|
|
1 |
Rs.101.97 |
|
Euro |
1 |
Rs.83.58 |
INFORMATION DETAILS
|
Information
Gathered by : |
PLK |
|
|
|
|
Analysis Done by
: |
RAS |
|
|
|
|
Report Prepared
by : |
MRI |
SCORE & RATING EXPLANATIONS
|
SCORE FACTORS |
RANGE |
POINTS |
|
HISTORY |
1~10 |
7 |
|
PAID-UP CAPITAL |
1~10 |
7 |
|
OPERATING SCALE |
1~10 |
7 |
|
FINANCIAL CONDITION |
|
|
|
--BUSINESS SCALE |
1~10 |
7 |
|
--PROFITABILIRY |
1~10 |
7 |
|
--LIQUIDITY |
1~10 |
7 |
|
--LEVERAGE |
1~10 |
7 |
|
--RESERVES |
1~10 |
7 |
|
--CREDIT LINES |
1~10 |
7 |
|
--MARGINS |
-5~5 |
-- |
|
DEMERIT POINTS |
|
|
|
--BANK CHARGES |
YES/NO |
YES |
|
--LITIGATION |
YES/NO |
YES |
|
--OTHER ADVERSE INFORMATION |
YES/NO |
NO |
|
MERIT POINTS |
|
|
|
--SOLE DISTRIBUTORSHIP |
YES/NO |
NO |
|
--EXPORT ACTIVITIES |
YES/NO |
NO |
|
--AFFILIATION |
YES/NO |
YES |
|
--LISTED |
YES/NO |
YES |
|
--OTHER MERIT FACTORS |
YES/NO |
YES |
|
DEFAULTER |
|
|
|
--RBI |
YES/NO |
NO |
|
--EPF |
YES/NO |
NO |
|
TOTAL |
|
63 |
This score serves as a reference to assess SC’s
credit risk and to set the amount of credit to be extended. It is calculated
from a composite of weighted scores obtained from each of the major sections of
this report. The assessed factors and their relative weights (as indicated
through %) are as follows:
Financial
condition (40%) Ownership
background (20%) Payment
record (10%)
Credit history
(10%) Market trend (10%) Operational size
(10%)
RATING EXPLANATIONS
|
RATING |
STATUS |
PROPOSED CREDIT LINE |
|
|
>86 |
Aaa |
Possesses an extremely sound financial base with the strongest
capability for timely payment of interest and principal sums |
Unlimited |
|
71-85 |
Aa |
Possesses adequate working capital. No caution needed for credit transaction.
It has above average (strong) capability for payment of interest and
principal sums |
Large |
|
56-70 |
A |
Financial & operational base are regarded healthy. General
unfavourable factors will not cause fatal effect. Satisfactory capability for
payment of interest and principal sums |
Fairly Large |
|
41-55 |
Ba |
Overall operation is considered normal. Capable to meet normal
commitments. |
Satisfactory |
|
26-40 |
B |
Capability to overcome financial difficulties seems comparatively below
average. |
Small |
|
11-25 |
Ca |
Adverse factors are apparent. Repayment of interest and principal sums
in default or expected to be in default upon maturity |
Limited with
full security |
|
<10 |
C |
Absolute credit risk exists. Caution needed to be exercised |
Credit not
recommended |
|
-- |
NB |
New Business |
-- |
This report is issued at your request without any
risk and responsibility on the part of MIRA INFORM PRIVATE LIMITED (MIPL) or
its officials.