MIRA INFORM REPORT
|
Report Date : |
08.05.2014 |
IDENTIFICATION DETAILS
|
Name : |
LUBRIZOL ADVANCED MATERIALS MANUFACTURING SPAIN SL |
|
|
|
|
Registered Office : |
Cami Can Calders, Numero 13, Sant Cugat Del Valles, Barcelona |
|
|
|
|
Country : |
Spain |
|
|
|
|
Financials (as on) : |
31.12.2012 |
|
|
|
|
Date of Incorporation : |
20.05.1996 |
|
|
|
|
Legal Form : |
Private Company |
|
|
|
|
Line of Business : |
Manufacture of plastics in primary forms |
|
|
|
|
No. of Employees : |
Not Available |
RATING & COMMENTS
|
MIRA’s Rating : |
Ba |
|
RATING |
STATUS |
PROPOSED CREDIT LINE |
|
|
41-55 |
Ba |
Overall operation is considered normal. Capable to meet normal
commitments. |
Satisfactory |
|
Status : |
Satisfactory |
|
Payment Behaviour : |
No complaints |
|
Litigation : |
Clear |
NOTES :
Any query related to this report can be made
on e-mail : infodept@mirainform.com
while quoting report number, name and date.
ECGC Country Risk Classification List – March 31, 2014
|
Country Name |
Previous Rating (31.12.2013) |
Current Rating (31.03.2014) |
|
Spain |
A2 |
A2 |
|
Risk Category |
ECGC
Classification |
|
Insignificant |
A1 |
|
Low Risk |
A2 |
|
Moderately Low Risk |
B1 |
|
Moderate Risk |
B2 |
|
Moderately High Risk |
C1 |
|
High Risk |
C2 |
|
Very High Risk |
D |
SPAIN - ECONOMIC OVERVIEW
Spain experienced a prolonged
recession in the wake of the global financial crisis. GDP contracted by 3.7% in
2009, ending a 16-year growth trend, and continued contracting through most of
2013. Economic growth resumed in late 2013, albeit only modestly, as credit
contraction in the private sector, fiscal austerity, and high unemployment
continued to weigh on domestic consumption and investment. Exports, however,
have been resilient throughout the economic downturn, partially offsetting
declines in domestic consumption and helped to bring Spain's current account
into surplus in 2013 for the first time since 1986. The unemployment rate rose
from a low of about 8% in 2007 to more than 26% in 2013, straining Spain's
public finances as spending on social benefits increased while tax revenues
fell. Spain’s budget deficit peaked at 11.4% of GDP in 2009. Spain gradually reduced
the deficit to just under 7% of GDP in 2013, slightly above the 6.5% target
negotiated between Spain and the EU. Public debt has increased substantially –
from 60.1% of GDP in 2010 to 93.4% in 2013. Rising labor productivity,
moderating labor costs, and lower inflation have helped to improve foreign
investor interest in the economy and to reduce government borrowing costs. The
government's ongoing efforts to implement reforms - labor, pension, health,
tax, and education - are aimed at supporting investor sentiment. The government
also has shored up struggling banks exposed to Spain's depressed domestic
construction and real estate sectors by successfully completing an EU-funded
restructuring and recapitalization program in December 2013.
|
Source
: CIA |
EXECUTIVE
SUMMARY
|
Name: |
LUBRIZOL ADVANCED MATERIALS MANUFACTURING SPAIN SL |
|
NIF / Fiscal code: |
B61125795 |
|
Status: |
ACTIVE WITH PARTIAL DIVISION OF CAPITAL |
|
Incorporation Date: |
20/05/1996 |
|
Register Data |
Register Section 8 Sheet 154443 |
|
Last Publication
in BORME: |
28/01/2014 [Appointments] |
|
Last Published Account Deposit: |
2012 |
|
Share Capital: |
17.976.952 |
|
|
|
|
Localization: |
CAMI CAN CALDERS, NUMERO 13 - SANT CUGAT DEL VALLES - 08173 -
BARCELONA |
|
Telephone - Fax - Email - Website: |
Ph.:. 935902929 Email.
ALBERT.JORDI@BAR.BFG.COM Website. WWW.BFG.COM |
|
|
|
|
Activity: |
|
|
NACE: |
2016 - Manufacture of plastics in primary forms |
|
Registered Trademarks: |
|
|
|
|
|
Defaults, Legal
Claims and Insolvency Proceedings : |
|
|
|
|
|
|
|
Number |
Amount (€) |
Most Recent Entry |
|
Insolvency Proceedings, Bankruptcy and Suspension of Payments |
|
Unpublished |
--- |
--- |
|
Defaults on debt with Financial Institutions and Large Companies |
|
None |
--- |
--- |
|
Judicial Claims (Notices, Executive Proceedings, Attachments, Auctions,
Bad Debt) |
|
None |
0 |
--- |
|
Proceedings heard by the Civil Court |
|
Unpublished |
0 |
--- |
|
Proceedings heard by the Labour Court |
|
Unpublished |
0 |
--- |
|
|
|
Partners: |
|
|
|
LUBRIZOL ADVANCED MATERIALS HOLDINGS SPAIN SL |
100 % |
|
|
Shares: |
0 |
|
|
Other Links: |
13 |
|
|
No. of Active Corporate Bodies: |
CHIEF EXECUTIVE OFFICER 1 |
|
|
Ratios |
2012 |
2011 |
Change |
|
|
|
|
|
Guarantees: |
|
|
Properties Registered: |
Company NO, Administrator NO |
|
Financing / Guarantee Sources : |
Sources YES, Guarantees YES |
|
|
|
|
|
|
|
INVESTIGATION
SUMMARY |
|
|
Belonging to an international company of chemical products for specialised
applications, today Lubrizol is pioneer and recognized leader in the
provision of complex chemical products to improve the performance of
vehicles. Also, it is considered international leading producer of polymers
and advanced additives that improve the performance of industrial products
and for the consumer. It meets normal payment commitments. |
|
Identification
|
Social
Denomination: |
LUBRIZOL ADVANCED MATERIALS MANUFACTURING SPAIN SL |
|
NIF / Fiscal
code: |
B61125795 |
|
Corporate
Status: |
ACTIVE WITH PARTIAL DIVISION OF CAPITAL |
|
Start of
activity: |
1996 |
|
Registered
Office: |
CAMI CAN CALDERS, NUMERO 13 |
|
Locality: |
SANT CUGAT DEL VALLES |
|
Province: |
BARCELONA |
|
Postal Code: |
08173 |
|
Telephone: |
935902929 |
|
Fax: |
935902900 |
|
Website: |
WWW.BFG.COM |
|
Email: |
ALBERT.JORDI@BAR.BFG.COM |
Activity
|
NACE: |
2016 |
|
CNAE Obtaining
Source: |
2016 |
|
Additional
Information: |
It is dedicated to the manufacture of chemical products for specialized
applications in additives and ingredients for the markets of personal care,
coatings, high performance and engineering polymers, as well as the global
transportation, industrial markets and the consumer. It belongs to the Group
LUBRIZOL CORPORATION. |
|
Additional
Address: |
Registered office located in CAMI CAN CALDERS, NUMERO 13, 08173 SANT
CUGAT DEL VALLES ( BARCELONA). GRAN VIAL 17 E, 08160 MONTMELO (BARCELONA). |
|
Import / export: |
IMPORTS / EXPORTS |
|
Future
Perspective: |
Consolidation |
|
Industry
situation: |
Maturity |
Chronological
Summary
|
|
|
|
|
|
|
Year |
Act |
|
|
|
1996 |
Appointments/ Re-elections (2) Company Formation (1) |
|
|
|
1997 |
Accounts deposit (ejer. 1996) Appointments/ Re-elections (2)
Cessations/ Resignations/ Reversals (2) Other Concepts/ Events (3) Take-over
Merger (4) |
|
|
|
1998 |
Accounts deposit (ejer. 1997) Appointments/ Re-elections (1) Capital Reduction
(1) Cessations/ Resignations/ Reversals (1) Change of Social address (1)
Increase of Capital (1) Take-over Merger (1) |
|
|
|
1999 |
Accounts deposit (ejer. 1998) Appointments/ Re-elections (3)
Cessations/ Resignations/ Reversals (3) |
|
|
|
2000 |
Accounts deposit (ejer. 1999) Cessations/ Resignations/ Reversals (1) |
|
|
|
2001 |
Accounts deposit (ejer. 2000) Appointments/ Re-elections (3) Capital
Reduction (1) Cessations/ Resignations/ Reversals (3) Change of Social Denomination
(1) Company Transformation (1) Statutory Modifications (1) |
|
|
|
2002 |
Accounts deposit (ejer. 2001) Appointments/ Re-elections (2)
Cessations/ Resignations/ Reversals (2) Increase of Capital (1) |
|
|
|
2003 |
Accounts deposit (ejer. 2002) Appointments/ Re-elections (2) Capital
Reduction (3) Cessations/ Resignations/ Reversals (3) Change of Social
Denomination (1) Declaration of Sole Propietorship (1) Loss of the sole
propietorship condition (1) Other Concepts/ Events (1) Partial split (5) |
|
|
|
2004 |
Accounts deposit (ejer. 2003) Appointments/ Re-elections (2)
Cessations/ Resignations/ Reversals (2) |
|
|
|
2005 |
Appointments/ Re-elections (2) Cessations/ Resignations/ Reversals (2) |
|
|
|
2006 |
Accounts deposit (ejer. 2004, 2005) Appointments/ Re-elections (1)
Cessations/ Resignations/ Reversals (1) |
|
|
|
2007 |
Accounts deposit (ejer. 2006) Appointments/ Re-elections (1) Change of
Social Denomination (1) |
|
|
|
2008 |
Accounts deposit (ejer. 2007) Appointments/ Re-elections (1)
Cessations/ Resignations/ Reversals (1) Modification of Powers (1) |
|
|
|
2009 |
Appointments/ Re-elections (2) Cessations/ Resignations/ Reversals (1) |
|
|
|
2010 |
Accounts deposit (ejer. 2008, 2009) Appointments/ Re-elections (2)
Cessations/ Resignations/ Reversals (1) Modification of Powers (1) |
|
|
|
2011 |
Accounts deposit (ejer. 2010) Appointments/ Re-elections (2)
Cessations/ Resignations/ Reversals (1) |
|
|
|
2012 |
Accounts deposit (ejer. 2011) Appointments/ Re-elections (4)
Cessations/ Resignations/ Reversals (2) Other Concepts/ Events (1) |
|
|
|
2013 |
Accounts deposit (ejer. 2012) Appointments/ Re-elections (1) |
|
|
|
2014 |
Appointments/ Re-elections (1) |
|
Breakdown
of Owners' Equity
|
Registered
Capital: |
17.976.952 |
|
Paid up capital: |
17.976.952 |
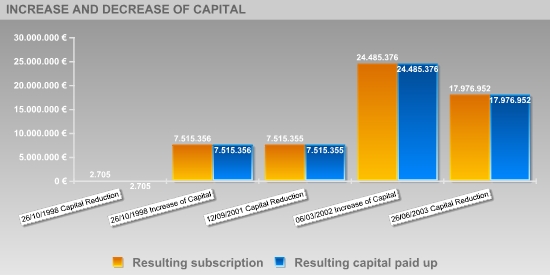
Updated
Evolution of the Subscribed and Paid-in Capital
|
|
|
|
|
|
|
|
|
|||||
|
|
|
|
|
|
|
|
Publishing Date |
Registration Type |
Capital Subscribed |
Paid up capital |
Underwritten result |
Disbursed Result |
|
26/08/1996 |
Company Formation |
2.704.554 |
2.704.554 |
2.704.554 |
2.704.554 |
|
26/10/1998 |
Capital Reduction |
-2.701.850 |
-2.701.850 |
2.705 |
2.705 |
|
26/10/1998 |
Increase of Capital |
7.512.651 |
7.512.651 |
7.515.356 |
7.515.356 |
|
12/09/2001 |
Capital Reduction |
-1 |
-1 |
7.515.355 |
7.515.355 |
|
06/03/2002 |
Increase of Capital |
16.970.021 |
16.970.021 |
24.485.376 |
24.485.376 |
|
26/06/2003 |
Capital Reduction |
-6.508.424 |
-6.508.424 |
17.976.952 |
17.976.952 |
Active
Social Bodies
|
Post published |
Social Body's Name |
Appointment Date |
Other Positions in this Company |
|
SINGLE PARTNER |
NOVEON HOLDINGS SPAIN SL |
26/06/2003 |
1 |
|
PRESIDENT |
MARC MARTHA JOSEPH VERTHONGEN |
10/07/2012 |
8 |
|
VICE CHAIRMAN |
HIPOLA RUIZ FERNANDO |
10/07/2012 |
2 |
|
MEMBER OF THE BOARD |
NICOLAS DANIEL CLAUDE BUQUET |
10/07/2012 |
1 |
|
|
MARC MARTHA JOSEPH VERTHONGEN |
21/02/2003 |
8 |
|
PROXY |
FERNANDEZ CASTAÑE GEMMA |
06/09/2012 |
5 |
|
|
MARTINEZ ROCAMORA DIDAC |
06/09/2012 |
6 |
|
|
MARC MARTHA JOSEPH VERTHONGEN |
06/09/2012 |
8 |
|
|
RODRIGUEZ ELVIRA MARIA ASCENSION |
06/09/2012 |
5 |
|
|
LAJOS TOLNAY |
06/09/2012 |
1 |
|
|
BRIAN ANTHONY VALENTINE |
06/09/2012 |
2 |
|
|
BEVERLY JEAN FOWLER |
06/09/2012 |
2 |
|
|
LUC FRANS SOPHIA BOLS |
06/09/2012 |
4 |
|
|
PASCAL CHRISTIAN MARIE DEVOUASSOUX |
06/09/2012 |
3 |
|
|
PANO SERRA ARNAU |
12/01/2012 |
1 |
|
|
DAVID ARNOLD MATTSON |
09/01/2009 |
1 |
|
|
BELA BERNARDUS FUDALA |
09/01/2009 |
1 |
|
|
JOSEPH CHAI |
09/01/2009 |
1 |
|
|
MARC M VERTHONGEN |
05/07/2006 |
1 |
|
|
GRAHAM ARTHUR BALL |
05/07/2006 |
1 |
|
|
MARGARET MARITZ |
05/07/2006 |
1 |
|
CHIEF EXECUTIVE OFFICER |
MARC MARTHA JOSEPH VERTHONGEN |
10/07/2012 |
8 |
|
NON CONSELLOR SECRETARY |
RODRIGUEZ ELVIRA MARIA ASCENSION |
09/01/2009 |
5 |
|
ACCOUNTS' AUDITOR / HOLDER |
DELOITTE SL |
21/01/2014 |
8 |
Historical
Social Bodies
|
Social Body's Name |
Post published |
End Date |
Other Positions in this Company |
|
BARNILS RODRIGUEZ GONZALEZ MARIA CLOE |
PROXY |
17/06/2008 |
1 |
|
BEVERLY JEAN FOWLER |
PROXY |
06/09/2012 |
2 |
|
BRIAN ANTHONY VALENTINE |
PROXY |
06/09/2012 |
2 |
|
BRIZ PUERTAS MARIA DE LAS NIEVES |
NON CONSELLOR SECRETARY |
23/02/2001 |
1 |
|
BRIZ PUERTAS NIEVES |
PROXY |
17/06/2008 |
2 |
|
|
NON CONSELLOR SECRETARY |
13/08/2002 |
|
|
BUSQUETS ALTED FRANCISCA |
PROXY |
03/07/2001 |
2 |
|
|
PROXY |
29/05/2002 |
|
|
BUSQUETS VIÑALLONGA FRANCISCO |
MEMBER OF THE BOARD |
23/02/2001 |
7 |
|
|
MEMBER OF THE BOARD |
21/02/2003 |
|
|
|
PROXY |
13/01/1999 |
|
|
|
CHIEF EXECUTIVE OFFICER |
23/02/2001 |
|
|
|
VICE CHAIRMAN |
23/02/2001 |
|
|
|
VICE CHAIRMAN |
21/02/2003 |
|
|
|
CHIEF EXECUTIVE OFFICER |
21/02/2003 |
|
|
CHARLES PARSONS COOLEY |
MEMBER OF THE BOARD |
28/12/2011 |
1 |
|
CHRISTOPHER ROBERT CLEGG |
MEMBER OF THE BOARD |
30/08/2004 |
1 |
|
CRUISER DRIVE SL |
SINGLE PARTNER |
26/06/2003 |
1 |
|
DELOITTE SL |
ACCOUNTS' AUDITOR / HOLDER |
14/12/2007 |
8 |
|
|
ACCOUNTS' AUDITOR / HOLDER |
09/01/2009 |
|
|
|
ACCOUNTS' AUDITOR / HOLDER |
27/01/2010 |
|
|
|
ACCOUNTS' AUDITOR / HOLDER |
14/09/2011 |
|
|
|
ACCOUNTS' AUDITOR / HOLDER |
26/01/2012 |
|
|
|
ACCOUNTS' AUDITOR / HOLDER |
07/02/2013 |
|
|
|
ACCOUNTS' AUDITOR / HOLDER |
21/01/2014 |
|
|
DONALD WILLIAM BOGUS |
MEMBER OF THE BOARD |
09/01/2009 |
3 |
|
|
CHIEF EXECUTIVE OFFICER |
09/01/2009 |
|
|
|
PRESIDENT |
09/01/2009 |
|
|
ERIC ROBERT SCHNUR |
MEMBER OF THE BOARD |
10/07/2012 |
3 |
|
|
CHIEF EXECUTIVE OFFICER |
10/07/2012 |
|
|
|
PRESIDENT |
10/07/2012 |
|
|
ERNST AND YOUNG SA |
ACCOUNTS' AUDITOR / HOLDER |
19/01/2005 |
1 |
|
FERNANDEZ CASTAÑE GEMMA |
PROXY |
06/09/2012 |
5 |
|
|
PROXY |
16/06/2010 |
|
|
|
PROXY |
17/06/2008 |
|
|
|
PROXY |
21/02/2003 |
|
|
FONTBUTE COSCOJUELA MONTSERRAT |
NON CONSELLOR ASSISTANT SECRETARY |
23/02/2001 |
1 |
|
GARCIA RUIZ MARIA JOSE |
PROXY |
17/06/2008 |
2 |
|
|
PROXY |
16/06/2010 |
|
|
GASTON DE IRIARTE GARCIA ORMAECHEA GUILLERMO |
NON CONSELLOR ASSISTANT SECRETARY |
05/07/2006 |
1 |
|
GONZALEZ LOPEZ GUILLERMO MIGUEL |
NON CONSELLOR ASSISTANT SECRETARY |
09/01/2009 |
1 |
|
HIPOLA RUIZ FERNANDO |
MEMBER OF THE BOARD |
10/07/2012 |
2 |
|
JEAN PIERRE HENRI ROGER VERBEECK |
MEMBER OF THE BOARD |
23/02/2001 |
2 |
|
|
MEMBER OF THE BOARD |
01/09/2003 |
|
|
JOHN ALBERT WEAVER |
MEMBER OF THE BOARD |
16/02/1999 |
4 |
|
|
PRESIDENT |
16/02/1999 |
|
|
|
PRESIDENT |
07/10/1999 |
|
|
|
MEMBER OF THE BOARD |
07/10/1999 |
|
|
JOHN ROLAND SENESE |
PROXY |
31/07/2000 |
1 |
|
JORDI GOMEZ ALBERT |
PROXY |
03/07/2001 |
1 |
|
KENNETH JOSEPH WILLINGS |
MEMBER OF THE BOARD |
21/03/2005 |
1 |
|
KERRY ALAN SHIBA |
PROXY |
31/07/1997 |
1 |
|
LESLIE CHODROW VINNEY |
PROXY |
31/07/2000 |
1 |
|
LUC FRANS SOPHIA BOLS |
PROXY |
06/09/2012 |
4 |
|
|
PROXY |
16/06/2010 |
|
|
|
PROXY |
17/06/2008 |
|
|
MARC MARTHA JOSEPH VERTHONGEN |
PROXY |
16/06/2010 |
8 |
|
|
VICE CHAIRMAN |
10/07/2012 |
|
|
|
PROXY |
06/09/2012 |
|
|
|
PROXY |
17/06/2008 |
|
|
MARTINEZ ROCAMORA DIDAC |
PROXY |
05/07/2006 |
6 |
|
|
NON CONSELLOR SECRETARY |
21/02/2003 |
|
|
|
PROXY |
06/09/2012 |
|
|
|
PROXY |
16/06/2010 |
|
|
|
PROXY |
17/06/2008 |
|
|
MICHAEL D FRIDAY |
MEMBER OF THE BOARD |
30/08/2004 |
3 |
|
|
CHIEF EXECUTIVE OFFICER |
30/08/2004 |
|
|
|
PRESIDENT |
30/08/2004 |
|
|
NATACHA JANINE ANNA VERRON |
PROXY |
06/09/2012 |
2 |
|
|
PROXY |
16/06/2010 |
|
|
NOVEON EUROPE B.V.B.A |
SINGLE PARTNER |
26/06/2003 |
1 |
|
ONTIVEROS NIETO NATALIA |
NON CONSELLOR ASSISTANT SECRETARY |
13/08/2002 |
2 |
|
|
PROXY |
17/06/2008 |
|
|
PASCAL CHRISTIAN MARIE DEVOUASSOUX |
PROXY |
06/09/2012 |
3 |
|
|
PROXY |
16/06/2010 |
|
|
PATRICK GEORGE POTY |
MEMBER OF THE BOARD |
16/02/1999 |
5 |
|
|
PRESIDENT |
23/02/2001 |
|
|
|
MEMBER OF THE BOARD |
23/02/2001 |
|
|
|
MEMBER OF THE BOARD |
23/04/2004 |
|
|
|
PRESIDENT |
23/04/2004 |
|
|
PATRICK GEORGES LEO G POTY |
CHIEF EXECUTIVE OFFICER |
23/04/2004 |
1 |
|
ROBERT ALLAN MC MILLAN |
PROXY |
13/03/1997 |
1 |
|
ROBERT FRANZ GULKIN |
MEMBER OF THE BOARD |
23/02/2001 |
2 |
|
|
PROXY |
03/07/2001 |
|
|
RODRIGUEZ ELVIRA ASCENSION |
PROXY |
05/07/2006 |
2 |
|
|
PROXY |
06/09/2012 |
|
|
RODRIGUEZ ELVIRA MARIA ASCENSION |
PROXY |
16/06/2010 |
5 |
|
|
PROXY |
06/09/2012 |
|
|
|
PROXY |
17/06/2008 |
|
|
SCOTT ERNEST KUECHLE |
PROXY |
03/07/2001 |
1 |
|
STEVEN ROY BARBANEL |
MEMBER OF THE BOARD |
16/02/1999 |
3 |
|
|
CHIEF EXECUTIVE OFFICER |
16/02/1999 |
|
|
|
VICE CHAIRMAN |
16/02/1999 |
|
|
THOMAS EDWARD WILLIAMS |
PROXY |
31/07/2000 |
1 |
|
VARA VAREA MANUEL |
NON CONSELLOR SECRETARY |
09/01/2009 |
1 |
|
VELASCO CABRE JUAN LUIS |
PROXY |
05/07/2006 |
4 |
|
|
PROXY |
17/06/2008 |
|
|
|
PROXY |
16/06/2010 |
|
|
|
PROXY |
06/09/2012 |
|
|
VIÑALLONGA ERAUSQUIN GERMAN |
PROXY |
21/11/1998 |
1 |
Executive
board
|
Post |
NIF |
Name |
|
FINANCIAL DIRECTOR |
|
GEMA FERNANDEZ CASTAÑE |
|
MANAGING DIRECTOR |
|
ELENA MARTIN |
Defaults,
Legal Claims and Insolvency Proceedings
Section enabling assessment of the degree of compliance of the company
queried with its payment obligations. It provides information on the existence
and nature of all stages of Insolvency and Legal Proceedings published with
reference to the Company in the country's various Official Bulletins and
national newspapers, as well Defaults Registered in the main national credit
bureaus (ASNEF Industrial and RAI ).
> Summary
Chronological summary
|
|
|
Number of Publications |
Amount (_) |
Start date |
End date |
|
Insolvency Proceedings, Bankruptcy and Suspension of Payments |
|
Unpublished |
--- |
--- |
--- |
|
Request/Declaration |
|
0 |
--- |
date |
|
|
Proceedings |
|
--- |
--- |
|
--- |
|
Resolution |
|
--- |
--- |
|
--- |
|
Defaults on debt with Financial Institutions and Large Companies |
Bank and Commercial Delinquency |
None |
0 |
|
|
|
Status: Friendly |
|
--- |
|
|
|
|
Status: Pre-Litigation |
|
--- |
|
|
|
|
Status: Litigation |
|
--- |
|
|
|
|
Status: Non-performing |
|
--- |
|
|
|
|
Status: insolvency proceedings, bankruptcy and suspension of payments |
|
--- |
|
|
|
|
Other status |
|
--- |
|
|
|
|
Legal and Administrative Proceedings |
|
Unpublished |
--- |
|
|
|
Notices of defaults and enforcement |
|
--- |
--- |
|
--- |
|
Seizures |
|
--- |
--- |
|
--- |
|
Auctions |
|
--- |
--- |
|
--- |
|
Declarations of insolvency and bad debt |
|
--- |
--- |
|
--- |
|
Proceedings heard by the Civil Court |
|
Unpublished |
--- |
|
|
|
Proceedings heard by the Labour Court |
|
Unpublished |
--- |
|
|
> Details
Probability of default
> Probabilidad Estimada de Impago para los próximos 12 meses:
0.245 %
|
Sector in which comparison is carried out : 201 Manufacture of basic chemicals, fertilisers and nitrogen
compounds, plastics and synthetic rubber in primary forms |
|
|
Relative Position:
|
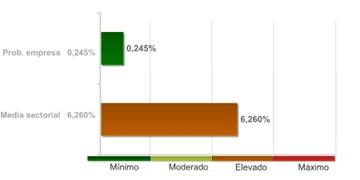
The company's comparative analysis with the rest of the companies that
comprise the sector, shows the company holds a better position with regard to
the probability of non-compliance.
The 98.00% of the companies of the sector LUBRIZOL ADVANCED MATERIALS
MANUFACTURING SPAIN SL belongs to show a higher probability of non-compliance.
The probability of the company's non-compliance with its payment obligations
within deadlines estimated by our qualifications models is 0.245%.
In the event they fail to comply with the payment, the seriousness of
the loss will depend on factors such as the promptness of the commencement of
the charging management, the existence of executive documents which match the
credit or the existence of guarantees and free debt assets under the name of
the debtor. Therefore, the probability of non-compliance should not be solely
interpreted as the total loss of the owed amount.
LEGAL CLAIMS
|
Summary of Judicial Claims |
|
|
|
|
|
|
|
|
||
|
|
|
No se han publicado |
|
|
|
|
No se han publicado |
|
|
|
|
||
|
|
|
No se han publicado |
|
|
|
|
No se han publicado |
|
|
|
|
No se han publicado |
|
|
|
|
No se han publicado |
|
|
|
|
||
|
|
|
No se han publicado |
|
|
|
|
No se han publicado |
|
|
|
|
||
|
|
|
No se han publicado |
|
Link
List
|
ABSORBS TO: |
2 Entities |
|
IS RELATED WITH: |
10 Entities |
|
SE ESCINDE PARCIALMENTE EN: |
1 Entities |
|
SHAREHOLDERS: |
1 Entities |
> Shareholders
|
Relationship |
Entity |
Province |
Shareholding stake |
|
SHAREHOLDERS |
LUBRIZOL ADVANCED MATERIALS HOLDINGS SPAIN SL |
BARCELONA |
100 |
> Other relationships
|
Relationship |
Entity |
Province |
Shareholding stake |
|
IS RELATED WITH |
| | |
|
|
|
|
LUBRIZOL CORPORATE |
|
|
|
|
LUBRIZOL LUXEMBOURG SARL |
|
|
|
|
THE LUBRIZOL CORPORATION (ESTADOS UNIDOS) |
|
|
|
|
LUBRIZOL AM EUROPE BVBA |
|
|
|
|
LUBRIZOL COORDINATION CENTER BVBA |
|
|
|
|
LUBRIZOL CORPORATION |
|
|
|
|
LIPOTEC SA |
BARCELONA |
|
|
|
MERCURY CAPITAL SL |
BARCELONA |
|
|
IS RELATED WITH |
LIPOTEC SA |
BARCELONA |
|
|
|
LUBRIZOL ADVANCED MATERIALS HOLDINGS SPAIN SL |
BARCELONA |
|
|
ABSORBS TO |
ALBUS SA |
BARCELONA |
|
|
|
INMOIBER, S.A. |
BARCELONA |
|
|
SE ESCINDE PARCIALMENTE EN |
NOVEON SALES SPAIN SL |
BARCELONA |
|
Turnover
|
Total Sales 2013 |
63.000.000 |
Financial
Accounts and Balance Sheets
Financial Years
Presented
|
Ejercicio |
Tipo de Cuentas Anuales |
Fecha Presentacion |
|
2012 |
Normales |
September 2013 |
|
2011 |
Normales |
November 2012 |
|
2010 |
Normales |
September 2011 |
|
2009 |
Normales |
August 2010 |
|
2008 |
Normales |
December 2009 |
|
2007 |
Normales |
July 2008 |
|
2006 |
Normales |
June 2007 |
|
2005 |
Normales |
September 2006 |
|
2004 |
Normales |
June 2006 |
|
2003 |
Normales |
October 2004 |
|
2002 |
Normales |
September 2003 |
|
2001 |
Normales |
August 2002 |
|
2000 |
Normales |
July 2001 |
|
1999 |
Normales |
October 2000 |
|
1998 |
Normales |
November 1999 |
|
1997 |
Normales |
November 1998 |
|
1996 |
Normales |
September 1997 |
The data in the
report regarding the last Company Accounts submitted by the company is taken from
the TRADE REGISTER serving the region in which the company's address is located
31/12/2012
> Balance en formato Normal de acuerdo al Nuevo Plan General
Contable 2007
Information
corresponding to the fiscal year
2012 2011 2010 2009 2008 is taken from information
submitted to the TRADE REGISTER. Data corresponding to fiscal years before
2012 2011 2010 2009 2008 has been compiled based on
the equivalence criteria stipulated in Act JUS/206/2009. Where the provisions
of the Act did not establish relevant equivalence criteria, created such
criteria using its own methodology. To view details on the methodology.
|
|
ORIGINAL |
ORIGINAL |
ORIGINAL |
ORIGINAL |
ORIGINAL |
|
|
Assets |
2012 |
2011 |
2010 |
2009 |
2008 |
|
|
A) NON-CURRENT ASSETS: 11000 |
78.605.000,00 |
81.105.000,00 |
13.356.000,00 |
14.739.000,00 |
15.485.000,00 |
|
|
I. Intangible fixed assets : 11100 |
41.495.000,00 |
41.319.000,00 |
510.000,00 |
613.000,00 |
14.000,00 |
|
|
1. Development: 11110 |
0,00 |
0,00 |
0,00 |
0,00 |
0,00 |
|
|
2. Concessions: 11120 |
0,00 |
0,00 |
0,00 |
0,00 |
0,00 |
|
|
3. Patents, licencing, trade
marks and similar: 11130 |
0,00 |
0,00 |
0,00 |
0,00 |
0,00 |
|
|
4. Goodwill: 11140 |
33.965.000,00 |
32.836.000,00 |
0,00 |
0,00 |
0,00 |
|
|
5. IT applications:
11150 |
323.000,00 |
423.000,00 |
510.000,00 |
613.000,00 |
14.000,00 |
|
|
6. Investigation: 11160 |
0,00 |
0,00 |
0,00 |
0,00 |
0,00 |
|
|
7. Other intangible fixed
assets: 11170 |
7.207.000,00 |
8.060.000,00 |
0,00 |
0,00 |
0,00 |
|
|
II. Tangible fixed assets : 11200 |
37.106.000,00 |
39.430.000,00 |
12.402.000,00 |
13.381.000,00 |
14.367.000,00 |
|
|
1. Land and buildings:
11210 |
18.024.000,00 |
18.345.000,00 |
4.455.000,00 |
4.510.000,00 |
4.516.000,00 |
|
|
2. Technical installations and
other tangible fixed assets: 11220 |
17.678.000,00 |
20.405.000,00 |
7.663.000,00 |
8.036.000,00 |
9.338.000,00 |
|
|
3. Tangible asset in
progress and advances: 11230 |
1.404.000,00 |
680.000,00 |
284.000,00 |
835.000,00 |
513.000,00 |
|
|
III. Real estate investment: 11300 |
0,00 |
0,00 |
0,00 |
0,00 |
0,00 |
|
|
1. Land: 11310 |
0,00 |
0,00 |
0,00 |
0,00 |
0,00 |
|
|
2. Buildings: 11320 |
0,00 |
0,00 |
0,00 |
0,00 |
0,00 |
|
|
IV. Long-term investments in Group companies and
associates : 11400 |
0,00 |
0,00 |
0,00 |
0,00 |
0,00 |
|
|
1. Equity instruments:
11410 |
0,00 |
0,00 |
0,00 |
0,00 |
0,00 |
|
|
2. Credits to businesses:
11420 |
0,00 |
0,00 |
0,00 |
0,00 |
0,00 |
|
|
3. Debt securities:
11430 |
0,00 |
0,00 |
0,00 |
0,00 |
0,00 |
|
|
4. Derivatives : 11440 |
0,00 |
0,00 |
0,00 |
0,00 |
0,00 |
|
|
5. Other financial assets :
11450 |
0,00 |
0,00 |
0,00 |
0,00 |
0,00 |
|
|
6. Other investments:
11460 |
0,00 |
0,00 |
0,00 |
0,00 |
0,00 |
|
|
V. Long-term financial investments: 11500 |
4.000,00 |
4.000,00 |
2.000,00 |
2.000,00 |
2.000,00 |
|
|
1. Equity instruments:
11510 |
0,00 |
0,00 |
0,00 |
0,00 |
0,00 |
|
|
2. Credits to third parties
: 11520 |
0,00 |
0,00 |
0,00 |
0,00 |
0,00 |
|
|
3. Debt securities: 11530 |
0,00 |
0,00 |
0,00 |
0,00 |
0,00 |
|
|
4. Derivatives : 11540 |
0,00 |
0,00 |
0,00 |
0,00 |
0,00 |
|
|
5. Other financial assets :
11550 |
4.000,00 |
4.000,00 |
2.000,00 |
2.000,00 |
2.000,00 |
|
|
6. Other investments:
11560 |
0,00 |
0,00 |
0,00 |
0,00 |
0,00 |
|
|
VI. Assets for deferred tax : 11600 |
0,00 |
352.000,00 |
442.000,00 |
743.000,00 |
1.102.000,00 |
|
|
VII. Non-current trade debts : 11700 |
0,00 |
0,00 |
0,00 |
0,00 |
0,00 |
|
|
B) CURRENT ASSETS: 12000 |
17.527.000,00 |
33.983.000,00 |
18.489.000,00 |
16.169.000,00 |
14.400.000,00 |
|
|
I. Non-current assets held for sale : 12100 |
0,00 |
0,00 |
0,00 |
0,00 |
0,00 |
|
|
II. Stocks: 12200 |
7.617.000,00 |
10.540.000,00 |
63.000,00 |
27.000,00 |
0,00 |
|
|
1. Commercial: 12210 |
0,00 |
0,00 |
0,00 |
0,00 |
0,00 |
|
|
2. Primary material and
other supplies: 12220 |
1.525.000,00 |
3.576.000,00 |
63.000,00 |
27.000,00 |
0,00 |
|
|
3. Work in progress:
12230 |
1.507.000,00 |
979.000,00 |
0,00 |
0,00 |
0,00 |
|
|
a) Of
long-term production cycle : 12231 |
0,00 |
0,00 |
0,00 |
0,00 |
0,00 |
|
|
b) Of
short-term production cycle : 12232 |
1.507.000,00 |
979.000,00 |
0,00 |
0,00 |
0,00 |
|
|
4. Finished goods:
12240 |
4.585.000,00 |
5.985.000,00 |
0,00 |
0,00 |
0,00 |
|
|
a) Of long-term
production cycle : 12241 |
0,00 |
0,00 |
0,00 |
0,00 |
0,00 |
|
|
b) Of
short-term production cycle : 12242 |
0,00 |
5.985.000,00 |
0,00 |
0,00 |
0,00 |
|
|
5. By-products, residues and
recycled materials: 12250 |
0,00 |
0,00 |
0,00 |
0,00 |
0,00 |
|
|
6. Advances to suppliers:
12260 |
0,00 |
0,00 |
0,00 |
0,00 |
0,00 |
|
|
III. Trade debtors and others receivable
accounts: 12300 |
9.650.000,00 |
20.633.000,00 |
726.000,00 |
996.000,00 |
1.342.000,00 |
|
|
1. Trade debtors / accounts
receivable: 12310 |
5.316.000,00 |
4.636.000,00 |
0,00 |
0,00 |
1.000,00 |
|
|
a) Long-term
receivables from sales and services supplied : 12311 |
0,00 |
0,00 |
0,00 |
0,00 |
0,00 |
|
|
b)
Customers for sales and provisions of services : 12312 |
5.316.000,00 |
4.636.000,00 |
0,00 |
0,00 |
1.000,00 |
|
|
2. Customers, Group
companies and associates : 12320 |
3.157.000,00 |
1.153.000,00 |
664.000,00 |
980.000,00 |
1.314.000,00 |
|
|
3. Other accounts
receivable: 12330 |
704.000,00 |
980.000,00 |
22.000,00 |
16.000,00 |
27.000,00 |
|
|
4. Personnel: 12340 |
0,00 |
0,00 |
0,00 |
0,00 |
0,00 |
|
|
5. Assets for deferred tax:
12350 |
0,00 |
0,00 |
0,00 |
0,00 |
0,00 |
|
|
6. Other debtors, including tax
and social security: 12360 |
473.000,00 |
13.864.000,00 |
40.000,00 |
0,00 |
0,00 |
|
|
7. Called up share capital:
12370 |
0,00 |
0,00 |
0,00 |
0,00 |
0,00 |
|
|
IV. Short-term investments in Group companies and
associates: 12400 |
242.000,00 |
2.787.000,00 |
17.677.000,00 |
15.108.000,00 |
12.685.000,00 |
|
|
1. Equity instruments:
12410 |
0,00 |
0,00 |
0,00 |
0,00 |
0,00 |
|
|
2. Credits to businesses:
12420 |
242.000,00 |
2.787.000,00 |
17.677.000,00 |
15.108.000,00 |
12.685.000,00 |
|
|
3. Debt securities:
12430 |
0,00 |
0,00 |
0,00 |
0,00 |
0,00 |
|
|
4. Derivatives : 12440 |
0,00 |
0,00 |
0,00 |
0,00 |
0,00 |
|
|
5. Other financial assets :
12450 |
0,00 |
0,00 |
0,00 |
0,00 |
0,00 |
|
|
6. Other investments:
12460 |
0,00 |
0,00 |
0,00 |
0,00 |
0,00 |
|
|
V. Short-term financial investments : 12500 |
0,00 |
0,00 |
0,00 |
0,00 |
0,00 |
|
|
1. Equity instruments:
12510 |
0,00 |
0,00 |
0,00 |
0,00 |
0,00 |
|
|
2. Credits to businesses:
12520 |
0,00 |
0,00 |
0,00 |
0,00 |
0,00 |
|
|
3. Debt securities:
12530 |
0,00 |
0,00 |
0,00 |
0,00 |
0,00 |
|
|
4. Derivatives : 12540 |
0,00 |
0,00 |
0,00 |
0,00 |
0,00 |
|
|
5. Other financial assets :
12550 |
0,00 |
0,00 |
0,00 |
0,00 |
0,00 |
|
|
6. Other investments:
12560 |
0,00 |
0,00 |
0,00 |
0,00 |
0,00 |
|
|
VI. Short-term accruals: 12600 |
17.000,00 |
22.000,00 |
19.000,00 |
35.000,00 |
15.000,00 |
|
|
VII. Cash and other equivalent liquid assets :
12700 |
1.000,00 |
1.000,00 |
4.000,00 |
3.000,00 |
358.000,00 |
|
|
1. Treasury: 12710 |
1.000,00 |
1.000,00 |
4.000,00 |
3.000,00 |
358.000,00 |
|
|
2. Other equivalent liquid
assets: 12720 |
0,00 |
0,00 |
0,00 |
0,00 |
0,00 |
|
|
TOTAL ASSETS (A + B) : 10000 |
96.132.000,00 |
115.088.000,00 |
31.845.000,00 |
30.908.000,00 |
29.885.000,00 |
|
|
|
ORIGINAL |
ORIGINAL |
ORIGINAL |
ORIGINAL |
ORIGINAL |
|
|
Liabilities and Net Worth |
2012 |
2011 |
2010 |
2009 |
2008 |
|
|
A) NET WORTH: 20000 |
32.148.000,00 |
30.792.000,00 |
30.390.000,00 |
29.495.000,00 |
28.367.000,00 |
|
|
A-1) Shareholders' equity: 21000 |
32.017.000,00 |
30.724.000,00 |
30.311.000,00 |
29.405.000,00 |
28.266.000,00 |
|
|
I. Capital: 21100 |
17.977.000,00 |
17.977.000,00 |
17.977.000,00 |
17.977.000,00 |
17.977.000,00 |
|
|
1. Registered capital :
21110 |
17.977.000,00 |
17.977.000,00 |
17.977.000,00 |
17.977.000,00 |
17.977.000,00 |
|
|
2. (Uncalled capital):
21120 |
0,00 |
0,00 |
0,00 |
0,00 |
0,00 |
|
|
II. Share premium: 21200 |
7.180.000,00 |
7.180.000,00 |
7.180.000,00 |
7.180.000,00 |
7.180.000,00 |
|
|
III. Reserves: 21300 |
5.567.000,00 |
5.154.000,00 |
4.249.000,00 |
3.109.000,00 |
1.958.000,00 |
|
|
1. Legal y estatutarias:
21310 |
810.000,00 |
768.000,00 |
678.000,00 |
564.000,00 |
437.000,00 |
|
|
2. Other reserves:
21320 |
4.757.000,00 |
4.386.000,00 |
3.571.000,00 |
2.545.000,00 |
1.521.000,00 |
|
|
IV. (Common stock equity): 21400 |
0,00 |
0,00 |
0,00 |
0,00 |
0,00 |
|
|
V. Results from previous periods: 21500 |
0,00 |
0,00 |
0,00 |
0,00 |
-122.000,00 |
|
|
1. Brought forward:
21510 |
0,00 |
0,00 |
0,00 |
0,00 |
0,00 |
|
|
2. (Negative results from
previous periods): 21520 |
0,00 |
0,00 |
0,00 |
0,00 |
-122.000,00 |
|
|
VI. Other shareholders' contributions:
21600 |
0,00 |
0,00 |
0,00 |
0,00 |
0,00 |
|
|
VII. Result of the period: 21700 |
1.293.000,00 |
413.000,00 |
905.000,00 |
1.139.000,00 |
1.273.000,00 |
|
|
VIII. (Interim dividend): 21800 |
0,00 |
0,00 |
0,00 |
0,00 |
0,00 |
|
|
IX. Other net worth instruments: 21900 |
0,00 |
0,00 |
0,00 |
0,00 |
0,00 |
|
|
A-2) Adjustments due to changes in value:
22000 |
0,00 |
0,00 |
0,00 |
0,00 |
0,00 |
|
|
I. Financial assets held for sale: 22100 |
0,00 |
0,00 |
0,00 |
0,00 |
0,00 |
|
|
II. Hedge operations: 22200 |
0,00 |
0,00 |
0,00 |
0,00 |
0,00 |
|
|
III. Linked non-current assets and liabilities
held for sale : 22300 |
0,00 |
0,00 |
0,00 |
0,00 |
0,00 |
|
|
IV. Exchange rate difference: 22400 |
0,00 |
0,00 |
0,00 |
0,00 |
0,00 |
|
|
V. Other: 22500 |
0,00 |
0,00 |
0,00 |
0,00 |
0,00 |
|
|
A-3) Received subsidies, donations and legacies:
23000 |
131.000,00 |
68.000,00 |
79.000,00 |
90.000,00 |
101.000,00 |
|
|
B) NON-CURRENT LIABILITIES: 31000 |
58.056.000,00 |
78.029.000,00 |
34.000,00 |
38.000,00 |
61.000,00 |
|
|
I. Long-term provisions: 31100 |
0,00 |
0,00 |
0,00 |
0,00 |
0,00 |
|
|
1. Long-term employee
benefits liability: 31110 |
0,00 |
0,00 |
0,00 |
0,00 |
0,00 |
|
|
2. Environmental actions:
31120 |
0,00 |
0,00 |
0,00 |
0,00 |
0,00 |
|
|
3. Restructuring provisions:
31130 |
0,00 |
0,00 |
0,00 |
0,00 |
0,00 |
|
|
4. Other provisions:
31140 |
0,00 |
0,00 |
0,00 |
0,00 |
0,00 |
|
|
II Long-term creditors: 31200 |
0,00 |
0,00 |
0,00 |
0,00 |
18.000,00 |
|
|
1. Liabilities and other securities:
31210 |
0,00 |
0,00 |
0,00 |
0,00 |
0,00 |
|
|
2. Amounts owed to credit
institutions: 31220 |
0,00 |
0,00 |
0,00 |
0,00 |
18.000,00 |
|
|
3. Creditors from financial
leasing: 31230 |
0,00 |
0,00 |
0,00 |
0,00 |
0,00 |
|
|
4. Derivatives : 31240 |
0,00 |
0,00 |
0,00 |
0,00 |
0,00 |
|
|
5. Other financial
liabilities : 31250 |
0,00 |
0,00 |
0,00 |
0,00 |
0,00 |
|
|
III. Long-term debts with Group companies and
associates: 31300 |
58.000.000,00 |
78.000.000,00 |
0,00 |
0,00 |
0,00 |
|
|
IV. Liabilities for deferred tax: 31400 |
56.000,00 |
29.000,00 |
34.000,00 |
38.000,00 |
43.000,00 |
|
|
V. Long-term accruals: 31500 |
0,00 |
0,00 |
0,00 |
0,00 |
0,00 |
|
|
VI. Non-current trade creditors : 31600 |
0,00 |
0,00 |
0,00 |
0,00 |
0,00 |
|
|
VII. Special long-term debts : 31700 |
0,00 |
0,00 |
0,00 |
0,00 |
0,00 |
|
|
C) CURRENT LIABILITIES : 32000 |
5.928.000,00 |
6.267.000,00 |
1.421.000,00 |
1.375.000,00 |
1.457.000,00 |
|
|
I. Liabilities linked to non-current assets held
for sale: 32100 |
0,00 |
0,00 |
0,00 |
0,00 |
0,00 |
|
|
II. Short-term provisions: 32200 |
0,00 |
0,00 |
0,00 |
0,00 |
0,00 |
|
|
III. Short-term creditors : 32300 |
0,00 |
0,00 |
0,00 |
18.000,00 |
18.000,00 |
|
|
1. Liabilities and other
securities: 32310 |
0,00 |
0,00 |
0,00 |
0,00 |
0,00 |
|
|
2. Amounts owed to credit
institutions: 32320 |
0,00 |
0,00 |
0,00 |
18.000,00 |
18.000,00 |
|
|
3. Creditors from financial
leasing: 32330 |
0,00 |
0,00 |
0,00 |
0,00 |
0,00 |
|
|
4. Derivatives : 32340 |
0,00 |
0,00 |
0,00 |
0,00 |
0,00 |
|
|
5. Other financial
liabilities : 32350 |
0,00 |
0,00 |
0,00 |
0,00 |
0,00 |
|
|
IV. Short-term debts with Group companies and
associates: 32400 |
407.000,00 |
149.000,00 |
0,00 |
0,00 |
0,00 |
|
|
V. Trade creditors and other accounts payable:
32500 |
5.521.000,00 |
6.118.000,00 |
1.421.000,00 |
1.357.000,00 |
1.439.000,00 |
|
|
1. Suppliers: 32510 |
3.684.000,00 |
4.605.000,00 |
710.000,00 |
517.000,00 |
705.000,00 |
|
|
a)
Long-term debts : 32511 |
0,00 |
0,00 |
0,00 |
0,00 |
0,00 |
|
|
b)
Short-term debts : 32512 |
3.684.000,00 |
4.605.000,00 |
710.000,00 |
517.000,00 |
705.000,00 |
|
|
2. Suppliers, Group
companies and associates: 32520 |
31.000,00 |
326.000,00 |
28.000,00 |
12.000,00 |
22.000,00 |
|
|
3. Other creditors:
32530 |
0,00 |
0,00 |
0,00 |
0,00 |
0,00 |
|
|
4. Personnel (remuneration
due): 32540 |
1.160.000,00 |
952.000,00 |
528.000,00 |
631.000,00 |
501.000,00 |
|
|
5. Liabilities for current
tax: 32550 |
215.000,00 |
0,00 |
0,00 |
0,00 |
0,00 |
|
|
6. Otras deudas con las
Administraciones Públicas. : 32560 |
431.000,00 |
235.000,00 |
155.000,00 |
197.000,00 |
211.000,00 |
|
|
7. Advances from clients:
32570 |
0,00 |
0,00 |
0,00 |
0,00 |
0,00 |
|
|
VI. Short-term accruals: 32600 |
0,00 |
0,00 |
0,00 |
0,00 |
0,00 |
|
|
VII. Special short-term debts : 32700 |
0,00 |
0,00 |
0,00 |
0,00 |
0,00 |
|
|
TOTAL NET WORTH AND LIABILITIES (A + B + C) : 30000 |
96.132.000,00 |
115.088.000,00 |
31.845.000,00 |
30.908.000,00 |
29.885.000,00 |
|
|
|
ORIGINAL |
ORIGINAL |
ORIGINAL |
ORIGINAL |
ORIGINAL |
|
|
Profit and Loss |
2012 |
2011 |
2010 |
2009 |
2008 |
|
|
1. Net turnover: 40100 |
59.859.000,00 |
9.124.000,00 |
8.466.000,00 |
9.676.000,00 |
9.546.000,00 |
|
|
a) Sales: 40110 |
51.324.000,00 |
432.000,00 |
0,00 |
0,00 |
0,00 |
|
|
b) Rendering of services: 40120 |
8.535.000,00 |
8.692.000,00 |
8.466.000,00 |
9.676.000,00 |
9.546.000,00 |
|
|
2. Changes in stocks of finished goods and work in progress:
40200 |
-653.000,00 |
-331.000,00 |
0,00 |
0,00 |
0,00 |
|
|
3. Works carried out by the company for its assets: 40300 |
140.000,00 |
90.000,00 |
-12.000,00 |
9.000,00 |
87.000,00 |
|
|
4. Supplies : 40400 |
-32.603.000,00 |
75.000,00 |
0,00 |
0,00 |
0,00 |
|
|
a) Stock consumption: 40410 |
0,00 |
0,00 |
0,00 |
0,00 |
0,00 |
|
|
b) Consumption of raw materials and miscellaneous
consumable ones: 40420 |
-32.507.000,00 |
75.000,00 |
0,00 |
0,00 |
0,00 |
|
|
c) Works carried out by other companies:
40430 |
-96.000,00 |
0,00 |
0,00 |
0,00 |
0,00 |
|
|
d) Impairment of stock, primary material and other
supplies: 40440 |
0,00 |
0,00 |
0,00 |
0,00 |
0,00 |
|
|
5. Other operating income: 40500 |
1.037.000,00 |
28.000,00 |
48.000,00 |
30.000,00 |
61.000,00 |
|
|
a) Auxiliary income and other from current
management: 40510 |
813.000,00 |
28.000,00 |
48.000,00 |
30.000,00 |
61.000,00 |
|
|
b) Operation subsidies included in the
Period's result: 40520 |
224.000,00 |
0,00 |
0,00 |
0,00 |
0,00 |
|
|
6. Personnel costs: 40600 |
-9.618.000,00 |
-4.165.000,00 |
-3.762.000,00 |
-4.398.000,00 |
-3.891.000,00 |
|
|
a) Wages, salaries et al.: 40610 |
-7.979.000,00 |
-3.494.000,00 |
-3.124.000,00 |
-3.654.000,00 |
-3.079.000,00 |
|
|
b) Social security costs: 40620 |
-1.639.000,00 |
-671.000,00 |
-638.000,00 |
-744.000,00 |
-812.000,00 |
|
|
c) Provisions : 40630 |
0,00 |
0,00 |
0,00 |
0,00 |
0,00 |
|
|
7. Other operating costs: 40700 |
-9.567.000,00 |
-2.851.000,00 |
-1.989.000,00 |
-2.297.000,00 |
-3.041.000,00 |
|
|
a) External services: 40710 |
-9.322.000,00 |
-2.671.000,00 |
-1.841.000,00 |
-2.154.000,00 |
-2.901.000,00 |
|
|
b) Taxes: 40720 |
-262.000,00 |
-150.000,00 |
-148.000,00 |
-143.000,00 |
-140.000,00 |
|
|
c) Losses, impairments and variation in
provisions from trade operations : 40730 |
17.000,00 |
0,00 |
0,00 |
0,00 |
0,00 |
|
|
d) Other current management expenditure :
40740 |
0,00 |
-30.000,00 |
0,00 |
0,00 |
0,00 |
|
|
8. Amortisation of fixed assets: 40800 |
-4.687.000,00 |
-1.492.000,00 |
-1.619.000,00 |
-1.579.000,00 |
-1.514.000,00 |
|
|
9. Allocation of subsidies of non-financial fixed assets and other:
40900 |
16.000,00 |
16.000,00 |
16.000,00 |
16.000,00 |
15.000,00 |
|
|
10. Excess provisions : 41000 |
0,00 |
0,00 |
0,00 |
0,00 |
0,00 |
|
|
11. Impairment and result of transfers of fixed assets: 41100 |
-45.000,00 |
-36.000,00 |
-12.000,00 |
-4.000,00 |
-22.000,00 |
|
|
a) Impairment and losses : 41110 |
0,00 |
0,00 |
0,00 |
0,00 |
0,00 |
|
|
b) Results for transfers and other : 41120 |
-45.000,00 |
-36.000,00 |
-12.000,00 |
-4.000,00 |
-22.000,00 |
|
|
12. Negative difference in combined businesses: 41200 |
0,00 |
0,00 |
0,00 |
0,00 |
0,00 |
|
|
13. Other results : 41300 |
-31.000,00 |
0,00 |
0,00 |
0,00 |
0,00 |
|
|
A.1) OPERATING INCOME (1 + 2 + 3 + 4 + 5 + 6 + 7 + 8 + 9 + 10 + 11 + 12
+ 13) : 49100 |
3.848.000,00 |
458.000,00 |
1.136.000,00 |
1.453.000,00 |
1.241.000,00 |
|
|
14. Financial income : 41400 |
211.000,00 |
181.000,00 |
70.000,00 |
48.000,00 |
452.000,00 |
|
|
a) Of shares in equity instruments : 41410 |
0,00 |
0,00 |
0,00 |
0,00 |
0,00 |
|
|
a 1) In Group companies and
associates: 41411 |
0,00 |
0,00 |
0,00 |
0,00 |
0,00 |
|
|
a 2) In third parties:
41412 |
0,00 |
0,00 |
0,00 |
0,00 |
0,00 |
|
|
b) From negotiable securities and other financial
instruments : 41420 |
211.000,00 |
181.000,00 |
70.000,00 |
48.000,00 |
452.000,00 |
|
|
b 1) From Group companies
and associates : 41421 |
211.000,00 |
181.000,00 |
70.000,00 |
48.000,00 |
452.000,00 |
|
|
b 2) From third parties :
41422 |
0,00 |
0,00 |
0,00 |
0,00 |
0,00 |
|
|
c) Allocation of financial subsidies, donations
and legacies : 41430 |
0,00 |
0,00 |
0,00 |
0,00 |
0,00 |
|
|
15. Financial expenditure: 41500 |
-2.420.000,00 |
-149.000,00 |
0,00 |
0,00 |
0,00 |
|
|
a) Amounts owed to Group companies and associates
: 41510 |
-2.420.000,00 |
-149.000,00 |
0,00 |
0,00 |
0,00 |
|
|
b) For debts with third parties : 41520 |
0,00 |
0,00 |
0,00 |
0,00 |
0,00 |
|
|
c) Stock renewal : 41530 |
0,00 |
0,00 |
0,00 |
0,00 |
0,00 |
|
|
16. Changes in fair value of financial instruments : 41600 |
0,00 |
0,00 |
0,00 |
0,00 |
0,00 |
|
|
a) Trading book and other : 41610 |
0,00 |
0,00 |
0,00 |
0,00 |
0,00 |
|
|
b) Allocation of financial assets held for sale
to the result for the period: 41620 |
0,00 |
0,00 |
0,00 |
0,00 |
0,00 |
|
|
17. Exchange rate differences : 41700 |
220.000,00 |
13.000,00 |
0,00 |
-3.000,00 |
-1.000,00 |
|
|
18. Impairment and result for transfers of financial instruments:
41800 |
0,00 |
0,00 |
0,00 |
0,00 |
0,00 |
|
|
a) Impairment and losses : 41810 |
0,00 |
0,00 |
0,00 |
0,00 |
0,00 |
|
|
b) Results for transfers and other : 41820 |
0,00 |
0,00 |
0,00 |
0,00 |
0,00 |
|
|
19. Other financial income and expenditure: 42100 |
0,00 |
0,00 |
0,00 |
0,00 |
0,00 |
|
|
a) Incorporation of financial expenditure to
assets: 42110 |
0,00 |
0,00 |
0,00 |
0,00 |
0,00 |
|
|
b) Financial income from arrangement with
creditors: 42120 |
0,00 |
0,00 |
0,00 |
0,00 |
0,00 |
|
|
c) Other income and expenditure: 42130 |
0,00 |
0,00 |
0,00 |
0,00 |
0,00 |
|
|
A.2) FINANCIAL REVENUE (14+15+16+17+18+19) : 49200 |
-1.989.000,00 |
45.000,00 |
70.000,00 |
45.000,00 |
451.000,00 |
|
|
A.3) NET RESULT BEFORE TAXES (A.1+A.2) : 49300 |
1.859.000,00 |
503.000,00 |
1.206.000,00 |
1.498.000,00 |
1.692.000,00 |
|
|
20. Income taxes: 41900 |
-566.000,00 |
-90.000,00 |
-301.000,00 |
-359.000,00 |
-419.000,00 |
|
|
A.4) PROFIT AFTER TAXES (A.3+20) : 49400 |
1.293.000,00 |
413.000,00 |
905.000,00 |
1.139.000,00 |
1.273.000,00 |
|
|
21. Result of the year coming from interrupted operations :
42000 |
0,00 |
0,00 |
0,00 |
0,00 |
0,00 |
|
|
A.5) RESULT OF THE PERIOD (A.4+21) : 49500 |
1.293.000,00 |
413.000,00 |
905.000,00 |
1.139.000,00 |
1.273.000,00 |
|
> Normal Balance Sheet under the rules of the 1990 General Accounting
Plan (repealed since 1st January of 2008)
Information
corresponding to the fiscal year
2012 2011 2010 2009 2008 has been compiled based on
the equivalence criteria stipulated in Act JUS/206/2009. Where the provisions
of the Act did not establish relevant equivalence criteria, created such criteria
using its own methodology. To view details on the methodology
2012 2011 2010 2009 2008 is taken from information
submitted to the TRADE REGISTER.
|
|
EQUIVALENCIA |
EQUIVALENCIA |
EQUIVALENCIA |
EQUIVALENCIA |
EQUIVALENCIA |
|
|
ASSETS |
2012 |
2011 |
2010 |
2009 |
2008 |
|
|
A) SHAREHOLDERS (PARTNERS) BY UNCALLED SUSCRIBED CAPITAL: |
0,00 |
0,00 |
0,00 |
0,00 |
0,00 |
|
|
B) FIXED ASSETS: |
78.605.000,00 |
80.753.000,00 |
12.914.000,00 |
13.996.000,00 |
14.383.000,00 |
|
|
I. Formation expenses: |
0,00 |
0,00 |
0,00 |
0,00 |
0,00 |
|
|
II. Intangible fixed assets: |
41.495.000,00 |
41.319.000,00 |
510.000,00 |
613.000,00 |
14.000,00 |
|
|
1. Research and development
costs: |
0,00 |
0,00 |
0,00 |
0,00 |
0,00 |
|
|
2. Concessions, patents,
licences, trademarks et al.: |
0,00 |
0,00 |
0,00 |
0,00 |
0,00 |
|
|
3. Goodwill: |
33.965.000,00 |
32.836.000,00 |
0,00 |
0,00 |
0,00 |
|
|
4. Key money paid for
premises: |
0,00 |
0,00 |
0,00 |
0,00 |
0,00 |
|
|
5. Software: |
323.000,00 |
423.000,00 |
510.000,00 |
613.000,00 |
14.000,00 |
|
|
6. Assets under capital
leases: |
0,00 |
0,00 |
0,00 |
0,00 |
0,00 |
|
|
7. Payments on account:
|
7.207.000,00 |
8.060.000,00 |
0,00 |
0,00 |
0,00 |
|
|
8. Provisions: |
0,00 |
0,00 |
0,00 |
0,00 |
0,00 |
|
|
9. Accumulated depreciation:
|
0,00 |
0,00 |
0,00 |
0,00 |
0,00 |
|
|
III. Tangible fixed assets: |
37.106.000,00 |
39.430.000,00 |
12.402.000,00 |
13.381.000,00 |
14.367.000,00 |
|
|
1. Land and construction:
|
18.024.000,00 |
18.345.000,00 |
4.455.000,00 |
4.510.000,00 |
4.516.000,00 |
|
|
2. Technical installations
and machinery: |
16.095.236,00 |
18.578.080,00 |
6.976.909,00 |
7.316.513,00 |
8.501.941,00 |
|
|
3. Other installations,
tools and furniture: |
1.452.914,00 |
1.677.040,00 |
629.804,00 |
660.460,00 |
767.469,00 |
|
|
4. Payments on account and
tangible fixed assets under construction: |
1.404.000,00 |
680.000,00 |
284.000,00 |
835.000,00 |
513.000,00 |
|
|
5. Other tangible assets:
|
129.850,00 |
149.880,00 |
56.287,00 |
59.027,00 |
68.590,00 |
|
|
6. Provisions: |
0,00 |
0,00 |
0,00 |
0,00 |
0,00 |
|
|
7. Accumulated depreciation:
|
0,00 |
0,00 |
0,00 |
0,00 |
0,00 |
|
|
IV. Financial investments: |
4.000,00 |
4.000,00 |
2.000,00 |
2.000,00 |
2.000,00 |
|
|
1. Equity investments in
group companies: |
0,00 |
0,00 |
0,00 |
0,00 |
0,00 |
|
|
2. Receivables from group companies:
|
0,00 |
0,00 |
0,00 |
0,00 |
0,00 |
|
|
3. Equity investment in
associated companies: |
0,00 |
0,00 |
0,00 |
0,00 |
0,00 |
|
|
4. Credits to associated
companies: |
0,00 |
0,00 |
0,00 |
0,00 |
0,00 |
|
|
5. Long-term securities
portfolio: |
0,00 |
0,00 |
0,00 |
0,00 |
0,00 |
|
|
6. Other receivables: |
0,00 |
0,00 |
0,00 |
0,00 |
0,00 |
|
|
7. Long term guarantees and
deposits: |
4.000,00 |
4.000,00 |
2.000,00 |
2.000,00 |
2.000,00 |
|
|
8. Provisions: |
0,00 |
0,00 |
0,00 |
0,00 |
0,00 |
|
|
9. Long-term receivables
from public bodies: |
0,00 |
0,00 |
0,00 |
0,00 |
0,00 |
|
|
V. Own shares: |
0,00 |
0,00 |
0,00 |
0,00 |
0,00 |
|
|
VI. Long-term trade receivables: |
0,00 |
0,00 |
0,00 |
0,00 |
0,00 |
|
|
C) Deferred expenses: |
0,00 |
0,00 |
0,00 |
0,00 |
0,00 |
|
|
D) CURRENT ASSETS: |
17.527.000,00 |
34.335.000,00 |
18.931.000,00 |
16.912.000,00 |
15.502.000,00 |
|
|
I. Called-up share capital (not paid): |
0,00 |
0,00 |
0,00 |
0,00 |
0,00 |
|
|
II. Stocks: |
7.617.000,00 |
10.540.000,00 |
63.000,00 |
27.000,00 |
0,00 |
|
|
1. Goods for resale: |
0,00 |
0,00 |
0,00 |
0,00 |
0,00 |
|
|
2. Raw materials and other
consumables: |
1.525.000,00 |
3.576.000,00 |
63.000,00 |
27.000,00 |
0,00 |
|
|
3. Goods in process and semifinished
ones: |
1.507.000,00 |
979.000,00 |
0,00 |
0,00 |
0,00 |
|
|
4. Finished products: |
4.585.000,00 |
5.985.000,00 |
0,00 |
0,00 |
0,00 |
|
|
5. Byproducts, scrap and
recovered materials: |
0,00 |
0,00 |
0,00 |
0,00 |
0,00 |
|
|
6. Payments on account:
|
0,00 |
0,00 |
0,00 |
0,00 |
0,00 |
|
|
7. Provisions: |
0,00 |
0,00 |
0,00 |
0,00 |
0,00 |
|
|
III. Debtors: |
9.650.000,00 |
20.985.000,00 |
1.168.000,00 |
1.739.000,00 |
2.444.000,00 |
|
|
1. Trade debtors / accounts
receivable: |
5.316.000,00 |
4.636.000,00 |
0,00 |
0,00 |
1.000,00 |
|
|
2. Accounts receivable,
Group companies: |
3.157.000,00 |
1.153.000,00 |
664.000,00 |
980.000,00 |
1.314.000,00 |
|
|
3. Accounts receivable,
associated companies: |
0,00 |
0,00 |
0,00 |
0,00 |
0,00 |
|
|
4. Other debtors: |
704.000,00 |
980.000,00 |
22.000,00 |
16.000,00 |
27.000,00 |
|
|
5. Staff: |
0,00 |
0,00 |
0,00 |
0,00 |
0,00 |
|
|
6. Public bodies: |
473.000,00 |
14.216.000,00 |
482.000,00 |
743.000,00 |
1.102.000,00 |
|
|
7. Provisions: |
0,00 |
0,00 |
0,00 |
0,00 |
0,00 |
|
|
IV. Short-term investments: |
242.000,00 |
2.787.000,00 |
17.677.000,00 |
15.108.000,00 |
12.685.000,00 |
|
|
1. Equity investments in
group companies: |
0,00 |
0,00 |
0,00 |
0,00 |
0,00 |
|
|
2. Receivables from group
companies: |
242.000,00 |
2.787.000,00 |
17.677.000,00 |
15.108.000,00 |
12.685.000,00 |
|
|
3. Equity investment in
associated companies: |
0,00 |
0,00 |
0,00 |
0,00 |
0,00 |
|
|
4. Credits to associated
companies: |
0,00 |
0,00 |
0,00 |
0,00 |
0,00 |
|
|
5. Short term securities
portfolio: |
0,00 |
0,00 |
0,00 |
0,00 |
0,00 |
|
|
6. Other receivables: |
0,00 |
0,00 |
0,00 |
0,00 |
0,00 |
|
|
7. Shor term guarantees and
deposits: |
0,00 |
0,00 |
0,00 |
0,00 |
0,00 |
|
|
8. Provisions: |
0,00 |
0,00 |
0,00 |
0,00 |
0,00 |
|
|
V. Short-term treasury shares: |
0,00 |
0,00 |
0,00 |
0,00 |
0,00 |
|
|
VI. Cash at bank and in hand: |
1.000,00 |
1.000,00 |
4.000,00 |
3.000,00 |
358.000,00 |
|
|
VII. Prepayments and accrued income: |
17.000,00 |
22.000,00 |
19.000,00 |
35.000,00 |
15.000,00 |
|
|
GENERAL TOTAL (A + B + C + D): |
96.132.000,00 |
115.088.000,00 |
31.845.000,00 |
30.908.000,00 |
29.885.000,00 |
|
MERCANTILE
REGISTRY.
|
|
EQUIVALENCIA |
EQUIVALENCIA |
EQUIVALENCIA |
EQUIVALENCIA |
EQUIVALENCIA |
|
|
LIABILITIES |
2012 |
2011 |
2010 |
2009 |
2008 |
|
|
A) EQUITY: |
32.056.300,00 |
30.744.400,00 |
30.334.700,00 |
29.432.000,00 |
28.296.300,00 |
|
|
I. Subscribed capital: |
17.977.000,00 |
17.977.000,00 |
17.977.000,00 |
17.977.000,00 |
17.977.000,00 |
|
|
II. Share premium: |
7.180.000,00 |
7.180.000,00 |
7.180.000,00 |
7.180.000,00 |
7.180.000,00 |
|
|
III. Revaluation reserves: |
0,00 |
0,00 |
0,00 |
0,00 |
0,00 |
|
|
IV. Reserves: |
5.606.300,00 |
5.174.400,00 |
4.272.700,00 |
3.136.000,00 |
1.988.300,00 |
|
|
1. Legal reserve: |
810.000,00 |
768.000,00 |
678.000,00 |
564.000,00 |
437.000,00 |
|
|
2. Reserves for own shares:
|
0,00 |
0,00 |
0,00 |
0,00 |
0,00 |
|
|
3. Reserves for shares of
the controlling company: |
0,00 |
0,00 |
0,00 |
0,00 |
0,00 |
|
|
4. Statutory reserves:
|
0,00 |
0,00 |
0,00 |
0,00 |
0,00 |
|
|
5. Miscellaneous reserves:
|
4.796.300,00 |
4.406.400,00 |
3.594.700,00 |
2.572.000,00 |
1.551.300,00 |
|
|
Differences due to capital
adjustement to euros: |
0,00 |
0,00 |
0,00 |
0,00 |
0,00 |
|
|
V. Profit or loss brought forward: |
0,00 |
0,00 |
0,00 |
0,00 |
-122.000,00 |
|
|
1. Retained earnings: |
0,00 |
0,00 |
0,00 |
0,00 |
0,00 |
|
|
2. Prior year losses: |
0,00 |
0,00 |
0,00 |
0,00 |
-122.000,00 |
|
|
3. Partners' contributions
so as to compensate losses: |
0,00 |
0,00 |
0,00 |
0,00 |
0,00 |
|
|
VI. Profit or loss for the financial year: |
1.293.000,00 |
413.000,00 |
905.000,00 |
1.139.000,00 |
1.273.000,00 |
|
|
VII. Interim dividend paid: |
0,00 |
0,00 |
0,00 |
0,00 |
0,00 |
|
|
VIII. Own shares for capital reduction: |
0,00 |
0,00 |
0,00 |
0,00 |
0,00 |
|
|
B) Deferred income: |
91.700,00 |
47.600,00 |
55.300,00 |
63.000,00 |
70.700,00 |
|
|
1. Capital grants: |
91.700,00 |
47.600,00 |
55.300,00 |
63.000,00 |
70.700,00 |
|
|
2. Unrealised exchange
gains: |
0,00 |
0,00 |
0,00 |
0,00 |
0,00 |
|
|
3. Other deferred income:
|
0,00 |
0,00 |
0,00 |
0,00 |
0,00 |
|
|
4. Public revenues to
distribute in several financial years: |
0,00 |
0,00 |
0,00 |
0,00 |
0,00 |
|
|
C) PROVISIONS FOR LIABILITIES AND CHARGES: |
0,00 |
0,00 |
0,00 |
0,00 |
0,00 |
|
|
1. Provisions for pension
fund and other similar obligations: |
0,00 |
0,00 |
0,00 |
0,00 |
0,00 |
|
|
2. Provisions for taxes:
|
0,00 |
0,00 |
0,00 |
0,00 |
0,00 |
|
|
3. Other provisions: |
0,00 |
0,00 |
0,00 |
0,00 |
0,00 |
|
|
4. Reversion fund: |
0,00 |
0,00 |
0,00 |
0,00 |
0,00 |
|
|
D) LONG TERM LIABILITIES: |
58.056.000,00 |
78.029.000,00 |
34.000,00 |
38.000,00 |
61.000,00 |
|
|
I. Issued debentures and other marketable
securities: |
0,00 |
0,00 |
0,00 |
0,00 |
0,00 |
|
|
1. Non-convertible
debentures: |
0,00 |
0,00 |
0,00 |
0,00 |
0,00 |
|
|
2. Convertible debentures:
|
0,00 |
0,00 |
0,00 |
0,00 |
0,00 |
|
|
3. Other debt securities:
|
0,00 |
0,00 |
0,00 |
0,00 |
0,00 |
|
|
II. Amounts owed to credit institutions: |
0,00 |
0,00 |
0,00 |
0,00 |
18.000,00 |
|
|
1. Loans and other liabilities:
|
0,00 |
0,00 |
0,00 |
0,00 |
18.000,00 |
|
|
2. Long-term liabilities
from capital leases: |
0,00 |
0,00 |
0,00 |
0,00 |
0,00 |
|
|
III. Debts with companies of the group and
affiliated ones: |
58.000.000,00 |
78.000.000,00 |
0,00 |
0,00 |
0,00 |
|
|
1. Amounts owed to group
companies: |
58.000.000,00 |
78.000.000,00 |
0,00 |
0,00 |
0,00 |
|
|
2. Amounts owed to
associated companies: |
0,00 |
0,00 |
0,00 |
0,00 |
0,00 |
|
|
IV. Other creditors: |
56.000,00 |
29.000,00 |
34.000,00 |
38.000,00 |
43.000,00 |
|
|
1. Long-term bills of
exchange payable: |
0,00 |
0,00 |
0,00 |
0,00 |
0,00 |
|
|
2. Other creditors: |
0,00 |
0,00 |
0,00 |
0,00 |
0,00 |
|
|
3. Long term guarantees and
deposits received: |
0,00 |
0,00 |
0,00 |
0,00 |
0,00 |
|
|
4. Long term payables to
public bodies: |
56.000,00 |
29.000,00 |
34.000,00 |
38.000,00 |
43.000,00 |
|
|
V. Unpaid portion of equity investment: |
0,00 |
0,00 |
0,00 |
0,00 |
0,00 |
|
|
1. Group companies: |
0,00 |
0,00 |
0,00 |
0,00 |
0,00 |
|
|
2. Associated companies:
|
0,00 |
0,00 |
0,00 |
0,00 |
0,00 |
|
|
3. Third parties: |
0,00 |
0,00 |
0,00 |
0,00 |
0,00 |
|
|
VI. Long term trade creditors: |
0,00 |
0,00 |
0,00 |
0,00 |
0,00 |
|
|
E) SHORT TERM CREDITORS: |
5.928.000,00 |
6.267.000,00 |
1.421.000,00 |
1.375.000,00 |
1.457.000,00 |
|
|
I. Issued debentures and other marketable
securities: |
0,00 |
0,00 |
0,00 |
0,00 |
0,00 |
|
|
1. Non-convertible debentures:
|
0,00 |
0,00 |
0,00 |
0,00 |
0,00 |
|
|
2. Convertible debentures:
|
0,00 |
0,00 |
0,00 |
0,00 |
0,00 |
|
|
3. Other debt securities:
|
0,00 |
0,00 |
0,00 |
0,00 |
0,00 |
|
|
4. Accrued interest on
debentures and other debt securities: |
0,00 |
0,00 |
0,00 |
0,00 |
0,00 |
|
|
II. Amounts owed to credit institutions: |
0,00 |
0,00 |
0,00 |
18.000,00 |
18.000,00 |
|
|
1. Loans and other
liabilities: |
0,00 |
0,00 |
0,00 |
18.000,00 |
18.000,00 |
|
|
2. Accrued interest on
liabilities with credit institutions: |
0,00 |
0,00 |
0,00 |
0,00 |
0,00 |
|
|
3. Short-term liabilities from
capital leases: |
0,00 |
0,00 |
0,00 |
0,00 |
0,00 |
|
|
III. Short-term amounts owed to group and
associated companies: |
438.000,00 |
475.000,00 |
28.000,00 |
12.000,00 |
22.000,00 |
|
|
1. Amounts owed to group companies:
|
438.000,00 |
475.000,00 |
28.000,00 |
12.000,00 |
22.000,00 |
|
|
2. Amounts owed to
associated companies: |
0,00 |
0,00 |
0,00 |
0,00 |
0,00 |
|
|
IV. Trade creditors: |
3.684.000,00 |
4.605.000,00 |
710.000,00 |
517.000,00 |
705.000,00 |
|
|
1. Advanced payments from
customers: |
0,00 |
0,00 |
0,00 |
0,00 |
0,00 |
|
|
2. Amounts owed for
purchases of goods or services: |
3.684.000,00 |
4.605.000,00 |
710.000,00 |
517.000,00 |
705.000,00 |
|
|
3. Debts represented by
notes payable: |
0,00 |
0,00 |
0,00 |
0,00 |
0,00 |
|
|
V. Other creditors: |
1.806.000,00 |
1.187.000,00 |
683.000,00 |
828.000,00 |
712.000,00 |
|
|
1. Public bodies: |
646.000,00 |
235.000,00 |
155.000,00 |
197.000,00 |
211.000,00 |
|
|
2. Bills of exchange
payable: |
0,00 |
0,00 |
0,00 |
0,00 |
0,00 |
|
|
3. Miscellaneous debts:
|
0,00 |
0,00 |
0,00 |
0,00 |
0,00 |
|
|
4. Wages and salaries
payable: |
1.160.000,00 |
952.000,00 |
528.000,00 |
631.000,00 |
501.000,00 |
|
|
5. Guarantees and deposits
received at short term: |
0,00 |
0,00 |
0,00 |
0,00 |
0,00 |
|
|
VI. Provisions: |
0,00 |
0,00 |
0,00 |
0,00 |
0,00 |
|
|
VII. Prepayments and accrued income: |
0,00 |
0,00 |
0,00 |
0,00 |
0,00 |
|
|
F) SHORT-TERM PROVISIONS FOR LIABILITIES AND CHARGES: |
0,00 |
0,00 |
0,00 |
0,00 |
0,00 |
|
|
GENERAL TOTAL (A + B + C + D + E + F): |
96.132.000,00 |
115.088.000,00 |
31.845.000,00 |
30.908.000,00 |
29.885.000,00 |
|
MERCANTILE
REGISTRY.
|
|
EQUIVALENCIA |
EQUIVALENCIA |
EQUIVALENCIA |
EQUIVALENCIA |
EQUIVALENCIA |
|
|
DEBIT |
2012 |
2011 |
2010 |
2009 |
2008 |
|
|
A) CHARGES (A.1 to A.15): |
60.190.000,00 |
9.039.000,00 |
7.683.000,00 |
8.640.000,00 |
8.888.000,00 |
|
|
A.1. Stock reduction of both
manufactured goods and the ones in process: |
653.000,00 |
331.000,00 |
0,00 |
0,00 |
0,00 |
|
|
A.2. Supplies: |
32.603.000,00 |
-75.000,00 |
0,00 |
0,00 |
0,00 |
|
|
a)
Stock consumption: |
0,00 |
0,00 |
0,00 |
0,00 |
0,00 |
|
|
b)
Consumption of raw materials and miscellaneous consumable ones: |
32.507.000,00 |
-75.000,00 |
0,00 |
0,00 |
0,00 |
|
|
c)
Miscellaneous external expenditure: |
96.000,00 |
0,00 |
0,00 |
0,00 |
0,00 |
|
|
A.3. Staff costs: |
9.618.000,00 |
4.165.000,00 |
3.762.000,00 |
4.398.000,00 |
3.891.000,00 |
|
|
a)
Wages, salaries et al.: |
7.979.000,00 |
3.494.000,00 |
3.124.000,00 |
3.654.000,00 |
3.079.000,00 |
|
|
b)
Social security costs: |
1.639.000,00 |
671.000,00 |
638.000,00 |
744.000,00 |
812.000,00 |
|
|
A.4. Depreciation expense:
|
4.687.000,00 |
1.492.000,00 |
1.619.000,00 |
1.579.000,00 |
1.514.000,00 |
|
|
A.5. Variation of trade
provisions and losses of unrecovered receivables: |
-17.000,00 |
0,00 |
0,00 |
0,00 |
0,00 |
|
|
a)
Stock provision variation: |
0,00 |
0,00 |
0,00 |
0,00 |
0,00 |
|
|
b) Variation
in provision and bad debt losses: |
0,00 |
0,00 |
0,00 |
0,00 |
0,00 |
|
|
c)
Variation of other trade provisions: |
-17.000,00 |
0,00 |
0,00 |
0,00 |
0,00 |
|
|
A.6. Other operating
charges: |
9.584.000,00 |
2.851.000,00 |
1.989.000,00 |
2.297.000,00 |
3.041.000,00 |
|
|
a)
External services: |
9.322.000,00 |
2.671.000,00 |
1.841.000,00 |
2.154.000,00 |
2.901.000,00 |
|
|
b)
Taxes: |
262.000,00 |
150.000,00 |
148.000,00 |
143.000,00 |
140.000,00 |
|
|
c)
Other operating expenses: |
0,00 |
30.000,00 |
0,00 |
0,00 |
0,00 |
|
|
d)
Allocation to revision fund: |
0,00 |
0,00 |
0,00 |
0,00 |
0,00 |
|
|
A.I. OPERATING BENEFITS
(B.1+B.2+B.3+B.4-A.1-A.2-A.3-A.4-A.5-A.6): |
3.908.000,00 |
478.000,00 |
1.132.000,00 |
1.441.000,00 |
1.248.000,00 |
|
|
A.7. Financial and similar
charges: |
2.420.000,00 |
149.000,00 |
0,00 |
0,00 |
0,00 |
|
|
a) Due
to liabilities with companies of the group: |
2.420.000,00 |
149.000,00 |
0,00 |
0,00 |
0,00 |
|
|
b) Due
to liabilities with associated companies: |
0,00 |
0,00 |
0,00 |
0,00 |
0,00 |
|
|
c) Due
to other debts.: |
0,00 |
0,00 |
0,00 |
0,00 |
0,00 |
|
|
d)
Losses from financial investments: |
0,00 |
0,00 |
0,00 |
0,00 |
0,00 |
|
|
A.8. Changes in financial investment
provisions: |
0,00 |
0,00 |
0,00 |
0,00 |
0,00 |
|
|
A.9. Exchange losses: |
0,00 |
0,00 |
0,00 |
3.000,00 |
1.000,00 |
|
|
A.II. NET FINANCIAL INCOME
(B.5+B.6+B.7+B.8-A.7-A.8-A.9): |
0,00 |
45.000,00 |
70.000,00 |
45.000,00 |
451.000,00 |
|
|
A.III. PROFIT FROM ORDINARY ACTIVITIES
(A.I+A.II-B.I-B.II): |
1.919.000,00 |
523.000,00 |
1.202.000,00 |
1.486.000,00 |
1.699.000,00 |
|
|
A.10. Changes in provisions for
intangible, tangible and securities portfolio: |
0,00 |
0,00 |
0,00 |
0,00 |
0,00 |
|
|
A.11. Losses from tangible
and intangible fixed assets and securities portfolio: |
45.000,00 |
36.000,00 |
12.000,00 |
4.000,00 |
22.000,00 |
|
|
A.12. Losses from
transactions with own shares and debentures: |
0,00 |
0,00 |
0,00 |
0,00 |
0,00 |
|
|
A.13. Extraordinary
expenses: |
31.000,00 |
0,00 |
0,00 |
0,00 |
0,00 |
|
|
A.14. Expenses and losses of
former financial years: |
0,00 |
0,00 |
0,00 |
0,00 |
0,00 |
|
|
A.IV. EXTRAORDINARY PROFIT
(B.9+B.10+B.11+B.12+B.13-A.10-A.11-A.12-A.13-A.14): |
0,00 |
0,00 |
4.000,00 |
12.000,00 |
0,00 |
|
|
A.V. PROFIT BEFORE TAXES (A.III+A.IV-B.III-B.IV):
|
1.859.000,00 |
503.000,00 |
1.206.000,00 |
1.498.000,00 |
1.692.000,00 |
|
|
A.15. Corporation tax:
|
566.000,00 |
90.000,00 |
301.000,00 |
359.000,00 |
419.000,00 |
|
|
A.16. Miscellaneous taxes:
|
0,00 |
0,00 |
0,00 |
0,00 |
0,00 |
|
|
A.VI. FINANCIAL YEAR RESULTS (PROFIT)
(A.V-A.15-A.16): |
1.293.000,00 |
413.000,00 |
905.000,00 |
1.139.000,00 |
1.273.000,00 |
|
MERCANTILE
REGISTRY.
|
|
EQUIVALENCIA |
EQUIVALENCIA |
EQUIVALENCIA |
EQUIVALENCIA |
EQUIVALENCIA |
|
|
CREDIT |
2012 |
2011 |
2010 |
2009 |
2008 |
|
|
B) INCOME ( B.1 to B.13): |
61.483.000,00 |
9.452.000,00 |
8.588.000,00 |
9.779.000,00 |
10.161.000,00 |
|
|
B.1. Net total sales: |
59.859.000,00 |
9.124.000,00 |
8.466.000,00 |
9.676.000,00 |
9.546.000,00 |
|
|
a)
Sales: |
51.324.000,00 |
432.000,00 |
0,00 |
0,00 |
0,00 |
|
|
b) Rendering
of services: |
8.535.000,00 |
8.692.000,00 |
8.466.000,00 |
9.676.000,00 |
9.546.000,00 |
|
|
Returns
and Rappel on sales: |
0,00 |
0,00 |
0,00 |
0,00 |
0,00 |
|
|
B.2. Stock increase of manufactured
goods and products in process: |
0,00 |
0,00 |
0,00 |
0,00 |
0,00 |
|
|
B.3. Works performed by the
company for fixed assets: |
140.000,00 |
90.000,00 |
-12.000,00 |
9.000,00 |
87.000,00 |
|
|
B.4. Miscellaneous operating
income: |
1.037.000,00 |
28.000,00 |
48.000,00 |
30.000,00 |
61.000,00 |
|
|
a)
Auxiliary income and other from current management: |
813.000,00 |
28.000,00 |
48.000,00 |
30.000,00 |
61.000,00 |
|
|
b)
Grants: |
224.000,00 |
0,00 |
0,00 |
0,00 |
0,00 |
|
|
c)
Liabilities and charges provisions surplus: |
0,00 |
0,00 |
0,00 |
0,00 |
0,00 |
|
|
B.I. PÉRDIDAS DE EXPLOTACIÓN (A.1+A.2+A.3+A.4+A.5-A.6-B.1-B.2-B.3-B.4):
|
0,00 |
0,00 |
0,00 |
0,00 |
0,00 |
|
|
B.5. Income from equity
investment: |
0,00 |
0,00 |
0,00 |
0,00 |
0,00 |
|
|
a) In
companies of the group: |
0,00 |
0,00 |
0,00 |
0,00 |
0,00 |
|
|
b) In
associated companies: |
0,00 |
0,00 |
0,00 |
0,00 |
0,00 |
|
|
c)
Third parties: |
0,00 |
0,00 |
0,00 |
0,00 |
0,00 |
|
|
B.6. Income from other
marketable securities and long-term receivables: |
0,00 |
0,00 |
0,00 |
0,00 |
0,00 |
|
|
a) From
companies of the group: |
0,00 |
0,00 |
0,00 |
0,00 |
0,00 |
|
|
b) From
associated companies: |
0,00 |
0,00 |
0,00 |
0,00 |
0,00 |
|
|
c) From
companies out of the group: |
0,00 |
0,00 |
0,00 |
0,00 |
0,00 |
|
|
B.7. Miscellaneous interests
or similar income: |
211.000,00 |
181.000,00 |
70.000,00 |
48.000,00 |
452.000,00 |
|
|
a) From
companies of the group: |
211.000,00 |
181.000,00 |
70.000,00 |
48.000,00 |
452.000,00 |
|
|
b) From
associated companies: |
0,00 |
0,00 |
0,00 |
0,00 |
0,00 |
|
|
c)
Miscellaneous interests: |
0,00 |
0,00 |
0,00 |
0,00 |
0,00 |
|
|
d)
Profit on financial investment: |
0,00 |
0,00 |
0,00 |
0,00 |
0,00 |
|
|
B.8. Exchange positive
differences: |
220.000,00 |
13.000,00 |
0,00 |
0,00 |
0,00 |
|
|
B.II. NEGATIVE FINANCIAL RESULTS
(A.7+A.8+A.9-B.5-B.6-B.7-B.8): |
1.989.000,00 |
0,00 |
0,00 |
0,00 |
0,00 |
|
|
B.III. LOSSES ON ORDINARY ACTIVITIES ( B.I + B.II
- A.I - A.II ): |
0,00 |
0,00 |
0,00 |
0,00 |
0,00 |
|
|
B.9.Profit on disposal of
both tangible and intangible fixed assets and securities portfolio: |
0,00 |
0,00 |
0,00 |
0,00 |
0,00 |
|
|
B.10. Profit on transactions
with own shares and debentures: |
0,00 |
0,00 |
0,00 |
0,00 |
0,00 |
|
|
B.11. Capital grants
transferred to profit and loss: |
16.000,00 |
16.000,00 |
16.000,00 |
16.000,00 |
15.000,00 |
|
|
B.12. Extraordinary income:
|
0,00 |
0,00 |
0,00 |
0,00 |
0,00 |
|
|
B.13. Income and profit of
former financial years: |
0,00 |
0,00 |
0,00 |
0,00 |
0,00 |
|
|
B.IV. NEGATIVE EXTRAORDINARY RESULTS (A.10+A.11+A.12+A.13+A.14-B.9-B.10-B.11-B.12-B.13):
|
60.000,00 |
20.000,00 |
0,00 |
0,00 |
7.000,00 |
|
|
B.V. LOSSES BEFORE TAXES (B.III+B.IV-A.III-A.IV):
|
0,00 |
0,00 |
0,00 |
0,00 |
0,00 |
|
|
B.VI. RESULT OF THE PERIOD (LOSSES)
(B.V+A.15+A.16): |
0,00 |
0,00 |
0,00 |
0,00 |
0,00 |
|
MERCANTILE
REGISTRY.
CASHFLOW
STATEMENT
Model: Normal
> Source of information: Data contained in this section is taken from
the information declared in the Annual Accounts submitted to the Trade
Register.
|
|
2012 |
2011 |
2010 |
2009 |
2008 |
|
|
1. Fiscal year result before taxes.: 61100 |
1.859.000,00 |
503.000,00 |
1.206.000,00 |
1.498.000,00 |
1.692.000,00 |
|
|
2. Results adjustments.: 61200 |
6.705.000,00 |
1.489.000,00 |
1.551.000,00 |
1.527.000,00 |
1.069.000,00 |
|
|
a) Fixed Assets Amortization (+).: 61201 |
4.687.000,00 |
1.492.000,00 |
1.619.000,00 |
1.579.000,00 |
1.514.000,00 |
|
|
d) Allocation of grants (-).: 61204 |
-16.000,00 |
-6.000,00 |
-11.000,00 |
-11.000,00 |
-15.000,00 |
|
|
e) Results on disposal of fixed assets (+/-). :
61205 |
45.000,00 |
36.000,00 |
13.000,00 |
4.000,00 |
21.000,00 |
|
|
g) Financial income (-).: 61207 |
-211.000,00 |
-33.000,00 |
-70.000,00 |
-48.000,00 |
-452.000,00 |
|
|
h) Financial Expenses (+). : 61208 |
2.420.000,00 |
0,00 |
0,00 |
0,00 |
0,00 |
|
|
i) Exchange differences (+/-). : 61209 |
-220.000,00 |
0,00 |
0,00 |
3.000,00 |
1.000,00 |
|
|
3. Changes in current capital equity.: 61300 |
12.355.000,00 |
-13.873.000,00 |
315.000,00 |
213.000,00 |
-1.079.000,00 |
|
|
a) Stock (+/-).: 61301 |
3.514.000,00 |
-282.000,00 |
-37.000,00 |
-27.000,00 |
0,00 |
|
|
d) Debtors and other accounts receivable (+/-). :
61302 |
11.413.000,00 |
-13.785.000,00 |
270.000,00 |
346.000,00 |
-425.000,00 |
|
|
c) Other current assets (+/-). : 61303 |
3.000,00 |
-3.000,00 |
17.000,00 |
-20.000,00 |
-4.000,00 |
|
|
d) Creditors and other accounts payable (+/-). :
61304 |
-2.575.000,00 |
197.000,00 |
65.000,00 |
-86.000,00 |
-650.000,00 |
|
|
4. Other cash flows for operating activities.: 61400 |
-1.951.000,00 |
129.000,00 |
55.000,00 |
44.000,00 |
473.000,00 |
|
|
a) Interest payments (-). : 61401 |
-2.162.000,00 |
0,00 |
0,00 |
0,00 |
0,00 |
|
|
c) Interest collection (+). : 61403 |
211.000,00 |
129.000,00 |
59.000,00 |
48.000,00 |
473.000,00 |
|
|
d) Income tax payment collection (payments)
(+/-).: 61404 |
0,00 |
0,00 |
-4.000,00 |
-4.000,00 |
0,00 |
|
|
5. Operating activity cash flows (1 + 2 + 3 + 4) : 61500 |
18.968.000,00 |
-11.752.000,00 |
3.127.000,00 |
3.282.000,00 |
2.155.000,00 |
|
|
6. Payments for investment (-).: 62100 |
-1.839.000,00 |
-81.184.000,00 |
-3.108.000,00 |
-3.619.000,00 |
-2.143.000,00 |
|
|
a) Companies of the group and affiliates. :
62101 |
0,00 |
0,00 |
-2.558.000,00 |
-2.423.000,00 |
-1.445.000,00 |
|
|
b) Intangible fixed assets. : 62102 |
0,00 |
-40.896.000,00 |
0,00 |
-681.000,00 |
0,00 |
|
|
c) Fixed assets. : 62103 |
-1.839.000,00 |
-28.469.000,00 |
-550.000,00 |
-515.000,00 |
-698.000,00 |
|
|
e) Other financial assets. : 62105 |
0,00 |
-2.000,00 |
0,00 |
0,00 |
0,00 |
|
|
g) Business Unit : 62107 |
0,00 |
-11.817.000,00 |
0,00 |
0,00 |
0,00 |
|
|
7. Divestment payment collection (+). : 62200 |
2.545.000,00 |
14.933.000,00 |
0,00 |
0,00 |
0,00 |
|
|
a) Companies of the group and affiliates. :
62201 |
2.545.000,00 |
14.933.000,00 |
0,00 |
0,00 |
0,00 |
|
|
8. Investment activity cash flows (6 + 7) minus Amortization:
62300 |
706.000,00 |
-66.251.000,00 |
-3.108.000,00 |
-3.619.000,00 |
-2.143.000,00 |
|
|
9. Payment collection and payments for equity instruments. : 63100 |
106.000,00 |
0,00 |
0,00 |
0,00 |
0,00 |
|
|
a) Issuance of equity instruments (+). :
63101 |
0,00 |
0,00 |
0,00 |
0,00 |
1.521.000,00 |
|
|
e) Grants, donations and bequests received (+). :
63105 |
106.000,00 |
0,00 |
0,00 |
0,00 |
0,00 |
|
|
10. Payment collection and payments for financial liabilities
instruments.: 63200 |
-20.000.000,00 |
78.000.000,00 |
-18.000,00 |
-18.000,00 |
-18.000,00 |
|
|
a) Issuance : 63201 |
0,00 |
78.000.000,00 |
0,00 |
0,00 |
0,00 |
|
|
5. Other debts (+). : 63206 |
0,00 |
78.000.000,00 |
0,00 |
0,00 |
0,00 |
|
|
b) Repayment and amortization of : 63207 |
-20.000.000,00 |
0,00 |
-18.000,00 |
-18.000,00 |
-18.000,00 |
|
|
2. Debts incurred with credit institutions (-).:
63209 |
0,00 |
0,00 |
0,00 |
-18.000,00 |
-18.000,00 |
|
|
3. Debts incurred with companies of the group and
affiliates (-). : 63210 |
-20.000.000,00 |
0,00 |
0,00 |
0,00 |
0,00 |
|
|
11. Payments from dividends and remunerations from other assets
instruments. : 63300 |
0,00 |
0,00 |
0,00 |
0,00 |
0,00 |
|
|
12. Cash flows for financing activities (9+10+11).: 63400 |
-19.894.000,00 |
78.000.000,00 |
-18.000,00 |
-18.000,00 |
-18.000,00 |
|
|
D) EFECTO DE LAS VARIACIONES DE LOS TIPOS DE CAMBIO: 64000 |
220.000,00 |
0,00 |
0,00 |
0,00 |
0,00 |
|
|
E) NET INCREASE/DECREASE OF CASH OR EQUIVALENT ASSETS
(+/-5+/-8+/12+/-D) : 65000 |
0,00 |
-3.000,00 |
1.000,00 |
-355.000,00 |
-6.000,00 |
|
|
Cash or equivalent assets as of beginning of the
fiscal year.: 65100 |
1.000,00 |
4.000,00 |
3.000,00 |
358.000,00 |
364.000,00 |
|
|
Cash or equivalent assets as of end of the fiscal
year.: 65200 |
1.000,00 |
1.000,00 |
4.000,00 |
3.000,00 |
358.000,00 |
|
FINANCIAL
DIAGNOSIS
> Economic-Financial Comparative Analysis
Data used in the following ratios and indicators is taken from the
Annual Accounts submitted by the company to the TRADE REGISTER.
> Comparison within the Sector
|
Cash Flow |
2012 |
2011 |
Variación 2012 - 2011 |
|
|||
|
|
Empresa |
Sector |
Empresa |
Sector |
Empresa |
Sector |
|
|
Cash Flow over Sales: |
0,00 % |
0,01 % |
0,00 % |
0,00 % |
|
|
|
|
EBITDA over Sales: |
14,36 % |
9,24 % |
21,59 % |
10,07 % |
-33,50 % |
-8,27 % |
|
|
Cash Flow Yield: |
0,00 % |
0,00 % |
0,00 % |
0,00 % |
|
|
|
|
Profitability |
2012 |
2011 |
Variación 2012 - 2011 |
|
|||
|
|
Empresa |
Sector |
Empresa |
Sector |
Empresa |
Sector |
|
|
Operating economic profitability: |
4,05 % |
5,27 % |
0,41 % |
6,95 % |
891,90 % |
-24,08 % |
|
|
Total economic profitability: |
4,45 % |
2,54 % |
0,57 % |
4,16 % |
685,70 % |
-39,03 % |
|
|
Financial profitability: |
4,04 % |
1,46 % |
1,34 % |
5,84 % |
200,43 % |
-74,92 % |
|
|
Margin: |
6,36 % |
4,84 % |
4,96 % |
6,36 % |
28,24 % |
-23,90 % |
|
|
Mark-up: |
3,10 % |
1,65 % |
5,44 % |
4,72 % |
-43,11 % |
-64,92 % |
|
|
Solvency |
2012 |
2011 |
Variación 2012 - 2011 |
|
|||
|
|
Empresa |
Sector |
Empresa |
Sector |
Empresa |
Sector |
|
|
Liquidity: |
0,00 |
0,12 |
0,00 |
0,11 |
|
9,26 |
|
|
Acid Test: |
1,67 |
0,86 |
3,74 |
0,83 |
-55,34 |
3,51 |
|
|
Working Capital / Investment: |
0,12 |
0,03 |
0,24 |
0,03 |
-49,90 |
13,18 |
|
|
Solvency: |
2,96 |
1,18 |
5,48 |
1,16 |
-46,03 |
1,61 |
|
|
Indebtedness |
2012 |
2011 |
Variación 2012 - 2011 |
|
|||
|
|
Empresa |
Sector |
Empresa |
Sector |
Empresa |
Sector |
|
|
Indebtedness level: |
1,99 |
1,65 |
2,74 |
1,65 |
-27,30 |
-0,08 |
|
|
Borrowing Composition: |
9,79 |
1,04 |
12,45 |
1,04 |
-21,34 |
-0,32 |
|
|
Repayment Ability: |
|
144,81 |
-28.098,67 |
813,78 |
|
-82,21 |
|
|
Warranty: |
1,50 |
1,62 |
1,37 |
1,61 |
10,05 |
0,06 |
|
|
Generated resources / Total creditors: |
0,09 |
0,07 |
0,02 |
0,07 |
313,56 |
-3,70 |
|
|
Efficiency |
2012 |
2011 |
Variación 2012 - 2011 |
|
|||
|
|
Empresa |
Sector |
Empresa |
Sector |
Empresa |
Sector |
|
|
Productivity: |
1,89 |
1,73 |
1,47 |
1,75 |
28,56 |
-1,47 |
|
|
Turnover of Collection Rights : |
6,32 |
4,84 |
0,45 |
4,48 |
1.312,07 |
7,94 |
|
|
Turnover of Payment Entitlements: |
7,52 |
3,53 |
0,42 |
3,27 |
1.672,88 |
8,15 |
|
|
Stock rotation: |
7,50 |
6,65 |
0,83 |
6,06 |
801,99 |
9,77 |
|
|
Assets turnover: |
0,64 |
1,09 |
0,08 |
1,09 |
673,45 |
-0,23 |
|
|
Borrowing Cost: |
3,78 |
2,94 |
0,18 |
2,92 |
2.039,76 |
0,63 |
|
> Trend of indicators under the General Accounting Plan of 2007
(2012, 2011, 2010, 2009, 2008)
|
Cash Flow |
2012 |
2011 |
2010 |
2009 |
2008 |
|
|
Cash Flow over Sales: |
0,00 % |
0,00 % |
0,00 % |
-0,04 % |
-0,06 % |
|
|
EBITDA over Sales: |
14,36 % |
21,59 % |
32,49 % |
31,21 % |
28,93 % |
|
|
Cash Flow Yield: |
0,00 % |
0,00 % |
0,00 % |
-0,01 % |
-0,02 % |
|
|
Profitability |
2012 |
2011 |
2010 |
2009 |
2008 |
|
|
Operating economic profitability: |
4,05 % |
0,41 % |
8,02 % |
9,20 % |
7,22 % |
|
|
Total economic profitability: |
4,45 % |
0,57 % |
3,79 % |
4,85 % |
5,66 % |
|
|
Financial profitability: |
4,04 % |
1,34 % |
2,99 % |
3,87 % |
4,50 % |
|
|
Margin: |
6,36 % |
4,96 % |
13,36 % |
14,96 % |
12,80 % |
|
|
Mark-up: |
3,10 % |
5,44 % |
14,18 % |
15,42 % |
4,65 % |
|
|
Solvency |
2012 |
2011 |
2010 |
2009 |
2008 |
|
|
Liquidity: |
0,00 |
0,00 |
0,00 |
0,00 |
0,25 |
|
|
Acid Test: |
1,67 |
3,74 |
12,95 |
11,71 |
9,87 |
|
|
Working Capital / Investment: |
0,12 |
0,24 |
0,54 |
0,48 |
0,47 |
|
|
Solvency: |
2,96 |
5,48 |
13,32 |
12,30 |
10,64 |
|
|
Indebtedness |
2012 |
2011 |
2010 |
2009 |
2008 |
|
|
Indebtedness level: |
1,99 |
2,74 |
0,05 |
0,05 |
0,05 |
|
|
Borrowing Composition: |
9,79 |
12,45 |
0,02 |
0,03 |
0,04 |
|
|
Repayment Ability: |
|
-28.098,67 |
1.455,00 |
-3,98 |
0,98 |
|
|
Warranty: |
1,50 |
1,37 |
21,89 |
21,87 |
19,69 |
|
|
Generated resources / Total creditors: |
0,09 |
0,02 |
1,73 |
1,92 |
1,84 |
|
|
Efficiency |
2012 |
2011 |
2010 |
2009 |
2008 |
|
|
Productivity: |
1,89 |
1,47 |
1,73 |
1,69 |
1,71 |
|
|
Turnover of Collection Rights : |
6,32 |
0,45 |
11,71 |
9,75 |
7,22 |
|
|
Turnover of Payment Entitlements: |
7,52 |
0,42 |
1,40 |
1,69 |
2,11 |
|
|
Stock rotation: |
7,50 |
0,83 |
116,98 |
306,44 |
|
|
|
Assets turnover: |
0,64 |
0,08 |
0,60 |
0,61 |
0,56 |
|
|
Borrowing Cost: |
3,78 |
0,18 |
0,00 |
0,00 |
0,00 |
|
COMPARATIVE
SECTORIAL BALANCE
Sector-based Comparison
under the rules of the New General Accounting Plan.
|
|
Variación - |
|
|
|
Empresa |
Sector |
|
|
Variación - |
|
|
|
Empresa |
Sector |
|
|
Variación - |
|
|
|
Empresa |
Sector |
Public
Tenders and Works Won
No Public Tenders
assigned to the name of the company.
Detail
of Subsidies appearing in Balances Memories
|
Entity |
ARC |
|
Status |
CONCEDIDA |
|
Amount Granted |
106.000,00 |
|
Notes |
A fecha de cierre no se ha traspasado cantidad alguna. |
|
Entity |
COMISION EUROPEA |
|
Status |
CONCEDIDA |
|
Amount Granted |
10.000,00 |
|
Notes |
Dicho importe corresponde al traspasado a resultados del ejercicio,
quedando a fecha de cierre pendiente de imputar 55.000 euros. |
|
Entity |
AGENCIA DE RESIDUS DE CATALUNYA |
|
Status |
CONCEDIDA |
|
Amount Granted |
6.000,00 |
|
Notes |
Dicho importe corresponde al traspasado a resultados del ejercicio,
quedando a fecha de cierre pendiente de imputar 26.000 euros. |
|
Entity |
COMISION EUROPEA |
|
Status |
CONCEDIDA |
|
Amount Granted |
64.000,00 |
|
Notes |
El importe reflejado corresponde al saldo al cierre del ejercicio. |
|
Entity |
AGENCIA DE RESIDUS DE CATALUNYA |
|
Status |
CONCEDIDA |
|
Amount Granted |
32.000,00 |
|
Notes |
El importe reflejado corresponde al saldo al cierre del ejercicio. |
|
Entity |
COMISION EUROPEA |
|
Status |
CONCEDIDA |
|
Amount Granted |
74.000,00 |
|
Notes |
El importe reflejado corresponde al saldo al cierre del ejercicio. |
|
Entity |
AGENCIA DE RESIDUS DE CATALUNYA |
|
Status |
CONCEDIDA |
|
Amount Granted |
38.000,00 |
|
Notes |
El importe reflejado corresponde al saldo al cierre del ejercicio. |
|
Entity |
AGENCIA DE RESIDUOS DE CATALUÑA |
|
Subsidy Concept |
Subvención de capital. |
|
Status |
CONCEDIDA |
|
Amount Granted |
81.000,00 |
|
Notes |
Esta subvención fue concedida en octubre de 2004. |
|
Entity |
COMISION EUROPEA |
|
Subsidy Concept |
Subvención de capital. |
|
Status |
CONCEDIDA |
|
Amount Granted |
79.000,00 |
|
Notes |
Esta subvención fue concedida en noviembre de 2001. |
|
Entity |
COMISION EUROPEA |
|
Subsidy Concept |
Subvención de capital. |
|
Status |
CONCEDIDA |
|
Amount Granted |
76.000,00 |
|
Notes |
Esta subvención fue concedida en febrero de 2004. |
Research
Summary
Belonging to an
international company of chemical products for specialised applications, today Lubrizol
is pioneer and recognized leader in the provision of complex chemical products
to improve the performance of vehicles. Also, it is considered international
leading producer of polymers and advanced additives that improve the
performance of industrial products and for the consumer. It meets normal
payment commitments.
Sources
Registry of
Commerce's Official Gazette. Own and external data bases Company References
FOREIGN EXCHANGE RATES
|
Currency |
Unit
|
Indian Rupees |
|
US Dollar |
1 |
Rs.60.04 |
|
|
1 |
Rs.101.97 |
|
Euro |
1 |
Rs.83.58 |
INFORMATION DETAILS
|
Analysis Done by
: |
RAS |
|
|
|
|
Report Prepared
by : |
NNA |
RATING EXPLANATIONS
|
RATING |
STATUS |
PROPOSED CREDIT LINE |
|
|
>86 |
Aaa |
Possesses an extremely sound financial base with the strongest
capability for timely payment of interest and principal sums |
Unlimited |
|
71-85 |
Aa |
Possesses adequate working capital. No caution needed for credit
transaction. It has above average (strong) capability for payment of interest
and principal sums |
Large |
|
56-70 |
A |
Financial & operational base are regarded healthy. General
unfavourable factors will not cause fatal effect. Satisfactory capability for
payment of interest and principal sums |
Fairly Large |
|
41-55 |
Ba |
Overall
operation is considered normal. Capable to meet normal commitments. |
Satisfactory |
|
26-40 |
B |
Capability to overcome financial difficulties seems comparatively below
average. |
Small |
|
11-25 |
Ca |
Adverse factors are apparent. Repayment of interest and principal sums
in default or expected to be in default upon maturity |
Limited with
full security |
|
<10 |
C |
Absolute credit risk exists. Caution needed to be exercised |
Credit not
recommended |
|
-- |
NB |
New Business |
-- |
This score serves as a reference to assess
SC’s credit risk and to set the amount of credit to be extended. It is calculated
from a composite of weighted scores obtained from each of the major sections of
this report. The assessed factors and their relative weights (as indicated
through %) are as follows:
Financial
condition (40%) Ownership
background (20%) Payment record
(10%)
Credit history
(10%) Market trend (10%) Operational size
(10%)
This report is issued at your request without any
risk and responsibility on the part of MIRA INFORM PRIVATE LIMITED (MIPL)
or its officials.