MIRA
INFORM REPORT
|
Report Date : |
13.05.2014 |
IDENTIFICATION DETAILS
|
Name : |
VILLARES METALS
INTERNATIONAL B.V. |
|
|
|
|
Registered Office : |
Nieuwe Haven 15 3311AP Dordrecht |
|
|
|
|
Country : |
Netherlands |
|
|
|
|
Financials (as on) : |
31.03.2013 |
|
|
|
|
Date of Incorporation : |
14.12.1972 |
|
|
|
|
Com. Reg. No.: |
KvK-nummer: 23034749 |
|
|
|
|
Legal Form : |
Private Company |
|
|
|
|
Line of Business : |
Manufacture of plastic plates |
|
|
|
|
No. of Employees |
13 |
RATING & COMMENTS
|
MIRA’s Rating : |
B |
|
RATING |
STATUS |
PROPOSED CREDIT LINE |
|
|
26-40 |
B |
Capability to overcome financial difficulties seems comparatively below
average. |
Small |
|
Status : |
Moderate |
|
Payment Behaviour : |
Slow but correct |
|
Litigation : |
Clear |
NOTES :
Any query related to this report can be made
on e-mail : infodept@mirainform.com
while quoting report number, name and date.
ECGC Country Risk Classification List – March 31, 2014
|
Country Name |
Previous Rating (31.12.2013) |
Current Rating (31.03.2014) |
|
Netherlands |
A1 |
A1 |
|
Risk Category |
ECGC
Classification |
|
Insignificant |
A1 |
|
Low Risk |
A2 |
|
Moderately Low Risk |
B1 |
|
Moderate Risk |
B2 |
|
Moderately High Risk |
C1 |
|
High Risk |
C2 |
|
Very High Risk |
D |
NETHERLANDS - ECONOMIC OVERVIEW
The Dutch economy is the sixth-largest
economy in the euro-zone and is noted for its stable industrial relations,
moderate unemployment and inflation, a sizable trade surplus, and an important
role as a European transportation hub. Industrial activity is predominantly in
food processing, chemicals, petroleum refining, and electrical machinery. A
highly mechanized agricultural sector employs only 2% of the labor force but
provides large surpluses for the food-processing industry and for exports. The
Netherlands, along with 11 of its EU partners, began circulating the euro
currency on 1 January 2002. After 26 years of uninterrupted economic growth,
the Dutch economy - highly dependent on an international financial sector and
international trade - contracted by 3.5% in 2009 as a result of the global
financial crisis. The Dutch financial sector suffered, due in part to the high
exposure of some Dutch banks to U.S. mortgage-backed securities. In 2008, the
government nationalized two banks and injected billions of dollars of capital
into other financial institutions, to prevent further deterioration of a
crucial sector. The government also sought to boost the domestic economy by
accelerating infrastructure programs, offering corporate tax breaks for
employers to retain workers, and expanding export credit facilities. The
stimulus programs and bank bailouts, however, resulted in a government budget
deficit of 5.3% of GDP in 2010 that contrasted sharply with a surplus of 0.7%
in 2008. The government of Prime Minister Mark RUTTE began implementing fiscal
consolidation measures in early 2011, mainly reductions in expenditures, which
resulted in an improved budget deficit in 2011. In 2012-13 tax revenues
dropped, GDP contracted, and the budget deficit deteriorated. Although jobless
claims continued to grow, the unemployment rate remained relatively low at 6.8
percent
|
Source
: CIA |
Summary
|
Company name |
Villares Metals International B.V. |
|
Operative address |
Nieuwe Haven 15 |
|
|
3311AP Dordrecht |
|
|
Netherlands |
Legal form Besloten Vennootschap
Registration number KvK-nummer: 23034749
VAT-number 001384831
|
Year |
2013 |
|
Mutation |
2012 |
|
Mutation |
2011 |
|
Fixed assets |
509.000 |
% |
-16,69 |
611.000 |
|
2,52 |
596.000 |
|
Total receivables |
5.690.000 |
% |
-22,46 |
7.338.000 |
|
18,97 |
6.168.000 |
|
|
|||||||
|
Total equity |
4.983.000 |
|
-0,91 |
5.029.000 |
|
0,48 |
5.005.000 |
|
Short term liabilities |
8.358.000 |
|
-28,80 |
11.738.000 |
|
31,67 |
8.915.000 |
|
|
|||||||
|
Net result |
-46.000 |
|
-291,67 |
24.000 |
t |
121,24 |
-113.000 |
|
|
|||||||
|
Working capital |
4.551.000 |
|
-1,19 |
4.606.000 |
|
-2,25 |
4.712.000 |
|
Quick ratio |
0,82 |
|
12,33 |
0,73 |
|
-9,88 |
0,81 |

Company name Trade names
Contact information
Company name Villares Metals International B.V
Trade names Villares Metals International B.V
Operative address ` Nieuwe Haven 15 3311AP Dordrecht
Netherlands
Correspondence address Postbus 705 3300AS
Dordrecht Netherlands
Telephone number 0786149933
Fax number Email 0786145372
address Website info@villaresmetalsinternational.com
www.villaresmetalsinternational.com
Registration
Registration number KvK-nummer:
23034749
Branch number 000016731344
VAT-number 001384831
Status Active
First registration company register 1972-12-15
Memorandum 1972-12-14
Establishment date 1972-12-14
Legal form Besloten Vennootschap (private Company)
Last proposed admendment 2007-12-24
Activities
SBI Manufacture of plastic plates (2221)
Exporter No
Importer No
Goal De internationale handel in alsmede het fabri- ceren en/of verwerken van
metalen en kunststof- fen, zowel in de vorm van grondstof/halffabri- kaat als
gereed product, holdingactiviteiten
Management
A.A. Wuzella (Armin Andreas)
Netherlands
Competence: Fully authorized Function:
Manager
Starting date: 2012-05-01
Date of birth: 1965-06-30, Villach, AT
A. Valsky (Allan)
Netherlands
Function: Commissaris
Starting date: 2010-11-01
Date of birth: 1972-08-11, Wenen, AT
H.P. Grandberg (Harry Peter)
Netherlands
Function: Commissaris
Starting date: 2012-07-10
Date of birth: 1965-02-22, Sao Paolo, BR
P. Jannink (Pascal)
Netherlands
Competence: Limited authorization
Function: Proxy
Starting date: 2011-04-01
Date of birth: 1975-03-16, Enschede, NL
Employees
|
Total according to the Chamber of Commerce |
13 |
|
|
|
|
|
|
Year |
|
2014 |
2013 |
2012 |
2011 |
2010 |
|
Total |
|
13 |
17 |
19 |
18 |
12 |

Payments
|
Score Description |
7,2 Payments are made regularly no complaints
are known |
|
|
Key figures
|
|
|||||
|
Year |
2013 |
2012 |
2011 |
2010 |
2009 |
|
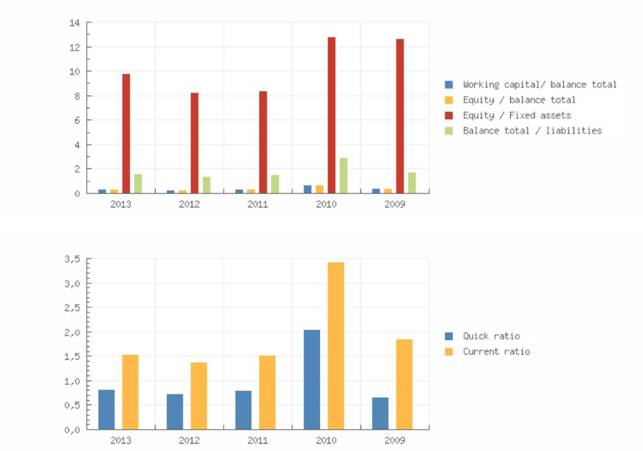
Quick ratio |
0,82 |
0,73 |
0,81 |
2,05 |
0,67 |
|
Current ratio |
1,54 |
1,39 |
1,53 |
3,43 |
1,86 |
|
|
|||||
|
Working capital/ balance total |
0,34 |
0,27 |
0,33 |
0,67 |
0,45 |
|
Equity / balance total |
0,37 |
0,30 |
0,35 |
0,66 |
0,42 |
|
Equity / Fixed assets |
9,79 |
8,23 |
8,40 |
12,82 |
12,64 |
|
Equity / liabilities |
0,59 |
0,42 |
0,54 |
1,92 |
0,73 |
|
Balance total / liabilities |
1,59 |
1,42 |
1,54 |
2,92 |
1,73 |
|
Year |
2013 |
2012 |
2011 |
2010 |
2009 |
|
Working capital |
4.551.000 |
4.606.000 |
4.712.000 |
5.032.000 |
5.602.000 |
|
Equity |
4.983.000 |
5.029.000 |
5.005.000 |
4.924.000 |
5.283.000 |
|
Mutation equity |
-0,91 |
0,48 |
1,65 |
-6,80 |
-20,51 |
|
Mutation short term liabilities |
-28,80 |
31,67 |
329,85 |
-68,08 |
-19,80 |
|
Return on total assets (ROA) |
0,50 |
0,48 |
0,67 |
-6,41 |
-8,29 |
|
Return on equity (ROE) |
1,34 |
1,61 |
1,92 |
-9,75 |
-19,65 |
|
Gross profit margin |
0,14 |
-- |
0,57 |
-3,11 |
-3,08 |
|
Net profit margin |
-0,17 |
0,08 |
-0,51 |
-2,79 |
-2,72 |
|
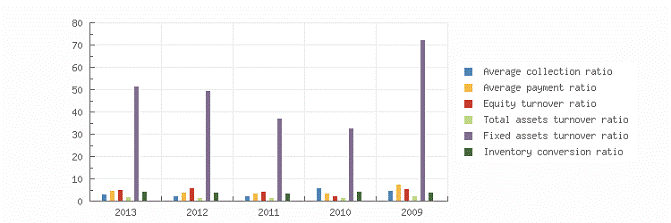
Average collection ratio |
3,15 |
2,57 |
2,48 |
6,09 |
4,67 |
|
Average payment ratio |
4,63 |
4,12 |
3,58 |
3,69 |
7,77 |
|
Equity turnover ratio |
5,29 |
6,01 |
4,41 |
2,57 |
5,74 |
|
Total assets turnover ratio |
1,96 |
1,78 |
1,55 |
1,69 |
2,42 |
|
Fixed assets turnover ratio |
51,77 |
49,45 |
37,04 |
32,90 |
72,58 |
|
Inventory conversion ratio |
4,38 |
3,91 |
3,47 |
4,44 |
3,93 |
|
Turnover |
26.353.000 |
30.215.000 |
22.076.000 |
12.634.000 |
30.338.000 |
|
Gross margin |
2.186.000 |
2.617.000 |
2.469.000 |
1.144.000 |
1.429.000 |
|
Operating result |
36.000 |
-1.000 |
125.000 |
-393.000 |
-933.000 |
|
Net result after taxes |
-46.000 |
24.000 - |
113.000 - |
352.000 - |
824.000 |
|
Cashflow |
19.000 |
90.000 |
-78.000 |
-309.000 |
-775.000 |
|
EBIT |
36.000 |
-1.000 |
125.000 |
-393.000 |
-933.000 |
|
EBITDA |
101.000 |
65.000 |
160.000 |
-350.000 |
-884.000 |
Summary
The 2013 financial result structure is a postive working
captial of 4.551.000 euro, which is in
agreement with 34 % of the total assets of the company.
The working capital has diminished with -1.19 % compared
to previous year. The ratio, with
respect to the total assets of the company has however,
increased.
The deterioration between 2012 and 2013 has mainly been
caused by a reduction of the
current assets.
The current ratio of the company in 2013 was 1.54. A
company with a current ratio between
1.5 and 3.0 generally indicates good short-term financial
strength.
The quick ratio in 2013 of the company was 0.82. A company
with a Quick Ratio of less than
1 cannot currently pay back its current liabilities.
The 2012 financial result structure is a postive working
captial of 4.606.000 euro, which is in
agreement with 27 % of the total assets of the company.
The working capital has diminished with -2.25 % compared
to previous year. The ratio, with
respect to the total assets of the company has however, declined.
The deterioration between 2011 and 2012 has mainly been
caused by an increase of the
current liabilities.
The current ratio of the company in 2012 was 1.39. When
the current ratio is below 1.5, the
company may have problems meeting its short-term obligations.
The quick ratio in 2012 of the company was 0.73. A company
with a Quick Ratio of less than
1 cannot currently pay back its current liabilities.
Financial statement
Type of Annual account Corporate
Annual account Villares
Metals International B.V.
Nieuwe Haven 15
3311AP Dordrecht Netherlands
Registration number: 230347490000
Balance
|
Year |
2013 |
2012 |
2011 |
2010 |
2009 |
|
End date |
2013-03-31 |
2012-03-31 |
2011-03-31 |
2010-03-31 |
2009-03-31 |
|
Intangible fixed assets |
|
8.000 |
17.000 |
||
|
Tangible fixed assets |
210.000 |
274.000 |
240.000 |
76.000 |
101.000 |
|
Financial fixed assets |
299.000 |
337.000 |
356.000 |
300.000 |
300.000 |
|
Fixed assets |
509.000 |
611.000 |
596.000 |
384.000 |
418.000 |
|
|
|||||
|
Total stock |
6.020.000 |
7.719.000 |
6.366.000 |
2.848.000 |
7.721.000 |
|
Accounts receivable |
4.091.000 |
5.008.000 |
4.360.000 |
1.490.000 |
1.772.000 |
|
Other receivables |
1.599.000 |
2.330.000 |
1.808.000 |
1.938.000 |
2.134.000 |
|
Total receivables |
5.690.000 |
7.338.000 |
6.168.000 |
3.428.000 |
3.906.000 |
|
Liquid funds |
1.199.000 |
1.287.000 |
1.093.000 |
830.000 |
473.000 |
|
Current assets |
12.909.000 |
16.344.000 |
13.627.000 |
7.106.000 |
12.100.000 |
|
Total assets |
13.418.000 |
16.955.000 |
14.223.000 |
7.490.000 |
12.518.000 |
|
Year |
2013 |
2012 |
2011 |
2010 |
2009 |
|
End date |
2013-03-31 |
2012-03-31 |
2011-03-31 |
2010-03-31 |
2009-03-31 |
|
|
|||||
|
Issued capital |
45.000 |
45.000 |
45.000 |
45.000 |
45.000 |
|
Share premium reserve |
158.000 |
158.000 |
158.000 |
158.000 |
158.000 |
|
Other reserves |
4.826.000 |
4.802.000 |
4.915.000 |
4.721.000 |
5.080.000 |
|
Non-distributable profit |
46.000 |
24.000 |
113.000 |
|
|
|
Total reserves |
5.076.000 |
4.984.000 |
5.299.000 |
4.879.000 |
5.238.000 |
|
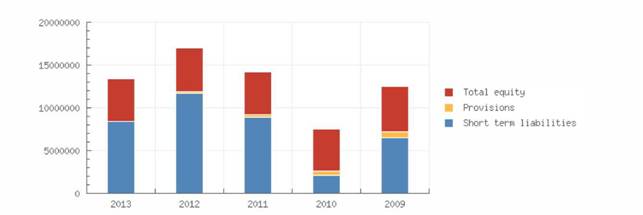
Total equity |
4.983.000 |
5.029.000 |
5.005.000 |
4.924.000 |
5.283.000 |
|
|
|||||
|
Provisions |
77.000 |
188.000 |
303.000 |
492.000 |
737.000 |
|
Accounts payable |
361.000 |
|
|
|
|
|
Other short term liabilities |
7.997.000 |
|
|
|
|
|
Short term liabilities |
8.358.000 |
11.738.000 |
8.915.000 |
2.074.000 |
6.498.000 |
|
Total short and long term liabilities |
8.435.000 |
11.926.000 |
9.218.000 |
2.566.000 |
7.235.000 |
|
Total liabilities |
13.418.000 |
16.955.000 |
14.223.000 |
7.490.000 |
12.518.000 |
Summary
The total assets of the company decreased with
-20.86 % between 2012 and 2013.
This total assets decrease has been reflected
in a reduction of non current assets of -16.69
%.
Assets reduction is being explained by an
indebtedness decrease -29.27 % while the Net Worth remains unchanged.
In 2013 the assets of the company were 3.79 %
composed of fixed assets and 96.21 % by current assets. The assets are being
financed by an equity of 37.14 %, and total debt of
62.86 %.
The total assets of the company increased
with 19.21 % between 2011 and 2012.
The fixed asset growth of 2.52 % is lower
than the total asset growth.
The asset growth is explained by a reduction
of 29.38 % of the company's indebtness, this
while, the Net Worth remains unchanged.
In 2012 the assets of the company were 3.6 %
composed of fixed assets and 96.4 % by current assets. The assets are being
financed by an equity of 29.66 %, and total debt of 70.34 %

profit and loss
|
Year |
2013 |
2012 |
2011 |
2010 |
2009 |
|
Revenues |
26.353.000 |
30.215.000 |
22.076.000 |
12.634.000 |
30.338.000 |
|
Net turnover |
26.353.000 |
30.215.000 |
22.076.000 |
12.634.000 |
30.338.000 |
|
|
|||||
|
Gross margin |
2.186.000 |
2.617.000 |
2.469.000 |
1.144.000 |
1.429.000 |
|
|
|||||
|
Wages and salaries |
1.245.000 |
1.638.000 |
1.529.000 |
941.000 |
1.402.000 |
|
Amorization and depreciation |
65.000 |
66.000 |
35.000 |
43.000 |
49.000 |
|
Sales |
24.167.000 |
27.598.000 |
19.607.000 |
11.490.000 |
28.909.000 |
|
other operating costs |
840.000 |
914.000 |
780.000 |
553.000 |
911.000 |
|
Operating expenses |
26.317.000 |
30.216.000 |
21.951.000 |
13.027.000 |
31.271.000 |
|
Operating result |
36.000 |
-1.000 |
125.000 |
-393.000 |
-933.000 |
|
|
|||||
|
Financial income |
193.000 |
159.000 |
42.000 |
224.000 |
126.000 |
|
Financial expenses |
162.000 |
77.000 |
71.000 |
311.000 |
231.000 |
|
Financial result |
31.000 |
82.000 |
-29.000 |
-87.000 |
-105.000 |
|
Result on ordinary operations before taxes |
67.000 |
81.000 |
96.000 |
-480.000 |
-1.038.000 |
|
|
|||||
|
Taxation on the result of ordinary activities |
113.000 |
57.000 |
209.000 |
-128.000 |
-214.000 |
|
Result of ordinary activities after taxes |
-46.000 |
24.000 |
-113.000 |
-352.000 |
-824.000 |
Summary
The turnover of the company decreased by -12.78 % between
2012 and 2013.
The gross profit of the company decreased by -16.47 %
between 2012 and 2013.
The operating result of the company grew with 3700 %
between 2012 and 2013. This
evolution implies an increase of the company's economic
profitability.
The result of these changes is an increase of the
company's Economic Profitability of 4.17 %
of the analysed period, being equal to 2012 % in the year
2013.
This growth has contributed to the increase in assets
turnover, increasing by 10.11 %
reaching 1.96.
The Net Result of the company increased by -291.67 %
between 2012 and 2013.
The company's Financial Profitability has been positively
affected by the financial activities in
comparison to the EBITs behaviour. The result of these
variations is a profitability increase of
-16.77 % of the analysed period, being 1.34 % in the year
2013.
The company's financial profitability has been positively
affected by its financial structure.
The turnover of the company grew with 36.87 % between 2011
and 2012.
The gross profit of the company grew with 5.99 % between
2011 and 2012.
The operating result of the company declined with -100.8 %
between 2011 and 2012. This
evolution implies an decrease of the company's economic
profitability.
The result of these changes is a reduction of the
company's Economic Profitability of -28.36
% of the analysed period, being equal to 2011 % in the
year 2012.
Despite the decline the assets turnover increased by 14.84
% reaching 1.78.
The Net Result of the company decreased by 121.24 %
between 2011 and 2012.
The company's Financial Profitability has been negatively
affected by the financial activities in
comparison to the EBITs behaviour. The result of these
variations is a profitability reduction
of -16.15 % of the analysed period, being 1.61 % in the
year 2012.
The company's financial profitability has been positively
affected by its financial structure.

Analysis
Branch (SBI) MANUFACTURE
OF RUBBER AND PLASTIC PRODUCTS (22)
Region Zuid-Holland
Oost
In
the Netherlands 1797 of the companies are registered with the SBI code 22
In
the region Zuid-Holland Oost 56 of the companies are registered with the SBI
code 22
In
the Netherlands 66 of the bankrupcties are published within this sector
In
the region Zuid-Holland Oost 4 of the bankruptcies are published within this
sector
The
risk of this specific sector in the Netherlands is High
The
risk of this specific sector in the region Zuid-Holland Oost is High
Publication
Filings 04-10-2013:
De jaarrekening over 2013 (gebroken boekjaar) is gepubliceerd.
24-12-2012:
De jaarrekening over 2011 (gebroken boekjaar) is gepubliceerd.
24-12-2012:
De jaarrekening over 2012 (gebroken boekjaar) is gepubliceerd.
27-01-2012:
De jaarrekening over 2010 (gebroken boekjaar) is gepubliceerd.
05-01-2010:
De jaarrekening over 2009 (gebroken boekjaar) is gepubliceerd.
06-05-2009:
De jaarrekening over 2008 (gebroken boekjaar) is gepubliceerd.
Functions 16-08-2012:
Per 10-07-2012 is commissaris Harry Peter Grandberg in functie getreden
16-08-2012:
Per 10-07-2012 is commissaris Herwig Petschenig uit functie getreden.
08-05-2012:
Per 01-05-2012 is bestuurder Roland Michael Haselsteiner uit functie getreden.
08-05-2012:
Per 01-05-2012 is bestuurder Armin Andreas Wuzella in functie getreden.
29-09-2011:
Per 29-08-2011 is commissaris Michael Kerner uit functie getreden.
27-07-2011:
Per 01-04-2011 is gevolmachtigde Pascal Jannink in functie getreden.
28-06-2011:
Per 01-11-2010 is commissaris Michael Kerner in functie getreden.
28-06-2011:
Per 01-11-2010 is commissaris Allan Valsky in functie getreden.
28-06-2011:
Per 01-11-2010 is commissaris Karl Haider uit functie getreden
FOREIGN EXCHANGE RATES
|
Currency |
Unit
|
Indian Rupees |
|
US Dollar |
1 |
Rs.59.72 |
|
|
1 |
Rs.100.81 |
|
Euro |
1 |
Rs.82.22 |
INFORMATION DETAILS
|
Analysis Done by
: |
RAS |
|
|
|
|
Report Prepared
by : |
PDT |
RATING EXPLANATIONS
|
RATING |
STATUS |
PROPOSED CREDIT LINE |
|
|
|
>86 |
Aaa |
Possesses an extremely sound financial base with the strongest
capability for timely payment of interest and principal sums |
Unlimited |
|
|
71-85 |
Aa |
Possesses adequate working capital. No caution needed for credit transaction.
It has above average (strong) capability for payment of interest and
principal sums |
Large |
|
|
56-70 |
A |
Financial & operational base are regarded healthy. General unfavourable
factors will not cause fatal effect. Satisfactory capability for payment of
interest and principal sums |
Fairly Large |
|
|
41-55 |
Ba |
Overall operation is considered normal. Capable to meet normal
commitments. |
Satisfactory |
|
|
26-40 |
B |
Capability to overcome financial difficulties seems comparatively
below average. |
Small |
|
|
11-25 |
Ca |
Adverse factors are apparent. Repayment of interest and principal sums
in default or expected to be in default upon maturity |
Limited with
full security |
|
|
<10 |
C |
Absolute credit risk exists. Caution needed to be exercised |
Credit not
recommended |
|
|
-- |
NB |
New Business |
-- |
|
This score serves as a reference to assess SC’s credit risk
and to set the amount of credit to be extended. It is calculated from a
composite of weighted scores obtained from each of the major sections of this
report. The assessed factors and their relative weights (as indicated through
%) are as follows:
Financial
condition (40%) Ownership
background (20%) Payment
record (10%)
Credit history
(10%) Market trend
(10%) Operational
size (10%)
This report is issued at your request without any
risk and responsibility on the part of MIRA INFORM PRIVATE LIMITED (MIPL)
or its officials.