MIRA
INFORM REPORT
|
Report Date : |
13.05.2014 |
IDENTIFICATION DETAILS
|
Name : |
XENOS B.V. |
|
|
|
|
Registered Office : |
Schutweg 85145NP Waalwijk |
|
|
|
|
Country : |
Netherlands |
|
|
|
|
Financials (as on) : |
2013 |
|
|
|
|
Date of Incorporation : |
16.07.1907 |
|
|
|
|
Com. Reg. No.: |
16032653 |
|
|
|
|
Legal Form : |
Private Company |
|
|
|
|
Line of Business : |
Wholesale of glassware, china and pottery |
|
|
|
|
No. of Employees |
51 |
RATING & COMMENTS
|
MIRA’s Rating : |
Ba |
|
RATING |
STATUS |
PROPOSED CREDIT LINE |
|
|
41-55 |
Ba |
Overall operation is considered normal. Capable to meet normal
commitments. |
Satisfactory |
|
Status : |
Satisfactory |
|
Payment Behaviour : |
No complaints |
|
Litigation : |
Clear |
NOTES :
Any query related to this report can be made
on e-mail : infodept@mirainform.com
while quoting report number, name and date.
ECGC Country Risk Classification List – March 31, 2014
|
Country Name |
Previous Rating (31.12.2013) |
Current Rating (31.03.2014) |
|
Netherlands |
A1 |
A1 |
|
Risk Category |
ECGC
Classification |
|
Insignificant |
A1 |
|
Low Risk |
A2 |
|
Moderately Low Risk |
B1 |
|
Moderate Risk |
B2 |
|
Moderately High Risk |
C1 |
|
High Risk |
C2 |
|
Very High Risk |
D |
NETHERLANDS - ECONOMIC
OVERVIEW
The Dutch economy is the sixth-largest
economy in the euro-zone and is noted for its stable industrial relations,
moderate unemployment and inflation, a sizable trade surplus, and an important
role as a European transportation hub. Industrial activity is predominantly in
food processing, chemicals, petroleum refining, and electrical machinery. A
highly mechanized agricultural sector employs only 2% of the labor force but
provides large surpluses for the food-processing industry and for exports. The
Netherlands, along with 11 of its EU partners, began circulating the euro
currency on 1 January 2002. After 26 years of uninterrupted economic growth,
the Dutch economy - highly dependent on an international financial sector and
international trade - contracted by 3.5% in 2009 as a result of the global
financial crisis. The Dutch financial sector suffered, due in part to the high
exposure of some Dutch banks to U.S. mortgage-backed securities. In 2008, the
government nationalized two banks and injected billions of dollars of capital
into other financial institutions, to prevent further deterioration of a
crucial sector. The government also sought to boost the domestic economy by
accelerating infrastructure programs, offering corporate tax breaks for
employers to retain workers, and expanding export credit facilities. The
stimulus programs and bank bailouts, however, resulted in a government budget
deficit of 5.3% of GDP in 2010 that contrasted sharply with a surplus of 0.7%
in 2008. The government of Prime Minister Mark RUTTE began implementing fiscal
consolidation measures in early 2011, mainly reductions in expenditures, which
resulted in an improved budget deficit in 2011. In 2012-13 tax revenues
dropped, GDP contracted, and the budget deficit deteriorated. Although jobless
claims continued to grow, the unemployment rate remained relatively low at 6.8
percent
|
Source
: CIA |
Company name and address
Xenos B.V.
Operative address
Schutweg 8
5145NP Waalwijk Netherlands
Legal form Besloten Vennootschap
Registration number KvK-nummer: 16032653
VAT-number 003328788
|
Year |
2013 |
|
Mutation |
2012 |
|
Mutation |
2011 |
|
Fixed assets |
329.031.000 |
|
-4,34 |
343.969.000 |
|
-2,34 |
352.197.000 |
|
Total receivables |
120.802.000 |
|
8,24 |
111.601.000 |
|
2,78 |
108.579.000 |
|
|
|||||||
|
Total equity |
508.492.000 |
|
1,98 |
498.639.000 |
|
-3,67 |
517.653.000 |
|
Short term liabilities |
289.392.000 |
|
-3,25 |
299.101.000 |
|
7,85 |
277.340.000 |
|
|
|||||||
|
Net result |
64.121.000 |
4 |
-49,94 |
128.077.000 |
s |
-19,04 |
158.204.000 |
|
|
|||||||
|
Working capital |
356.920.000 |
|
13,79 |
313.674.000 |
s |
-13,92 |
364.416.000 |
|
Quick ratio |
0,60 |
|
7,14 |
0,56 |
s |
-9,68 |
0,62 |
Contact information
Company name Xenos B.V.
Trade names Xenos B.V.
Operative address
Schutweg 8 5145NP Waalwijk Netherlands
Correspondence address
Postbus 1038 5140CA Waalwijk Netherlands
Telephone number 0416 674747
Fax number 0416 341418
Email address info@xenos.nl
Website www.xenos.nl
Registration
Registration number KvK-nummer:
16032653
Registered in Kamer van
Koophandel Brabant
Branch number 000015828352
VAT-number 003328788
Legal form Besloten
Vennootschap
Last proposed admendment 1996-01-24
Status Active
Memorandum 1973-07-02
Establishment date 1907-07-16
Activities
SBI Wholesale
of glassware, china and pottery (46441)
Exporter No
Importer No
Goal Het
ontwerpen, inrichten, reorganiseren, ontwikkelen en exploiteren van
distributiesystemen,
alsmede
de import en export van en de groot en kleinhandel in voedingsmiddelen en
genotsmiddelen,
huishoudelijke artikelen, textielgoederen, recreatie-artikelen, luxe goederen
en
gebruiksartikelen
relations
Shareholders
Xenos Holding B.V.
Schutweg 8
5145NP WAALWIJK
Netherlands
Registration number: 160716350000
Percentage: 100.00%
Companies
on same address
Xenos Duitsland B.V.
Registration number: 301177330000
Hoyng Nederland B.V.
Registration number: 170060230000
Companies on same address
Xenos Holding B.V.
Registration number: 160716350000
Liability
statements
Blokker Holding B.V.
Naarderstraat 50
1251BD Laren
Netherlands
Registration number: 331349430000
date of issue: 1998-03-03
Starting date: 1998-03-03
Management
Active
management
Xenos Holding B.V.
Schutweg 8
5145NP WAALWIJK
Netherlands
Registration number: 160716350000
Competence: Fully authorized
Function: Manager
Starting date: 1998-06-01
H.J.J. de Bie (Henric Jan Jozef)
Netherlands
Competence: Fully authorized
Function: Manager
Starting date: 2012-02-01
Date of birth: 1968-01-09,
Boekel, NL
Involved with the following companies
• Hoyng Nederland B.V.
Schutweg 8
5145NP Waalwijk
Netherlands
Registration number: 170060230000
Function: Manager
• Xenos Duitsland B.V.
Schutweg 8
5145NP Waalwijk
Netherlands
Registration number: 301177330000
Function: Manager
Active management
L.R.M. Steenbekkers (Leonardus Rudolphus Maria)
Netherlands
Competence: Fully authorized
Function: Manager
Starting date: 2012-02-01
Date of birth: 1954-02-10,
Alem, NL
Involved with the following
companies
• Hoyng Nederland B.V.
Schutweg 8
5145NP Waalwijk
Netherlands
Registration number: 170060230000
Function: Manager
• Xenos Duitsland B.V.
Schutweg 8
Netherlands
Registration number: 301177330000
Function: Manager
Employees
Total according to the Chamber of Commerce 51
Year 2013
Total 51
PAYMENT
Description The payments are regular
|
Year |
2013 |
2012 |
2011 |
2010 |
2009 |
|
Quick ratio |
0,60 |
0,56 |
0,62 |
0,75 |
0,60 |
|
Current ratio |
2,23 |
2,05 |
2,31 |
2,49 |
2,12 |
|
|
|||||
|
Working capital/ balance total |
0,37 |
0,33 |
0,37 |
0,38 |
0,34 |
|
Equity / balance total |
0,52 |
0,52 |
0,52 |
0,52 |
0,52 |
|
Equity / Fixed assets |
1,55 |
1,45 |
1,47 |
1,40 |
1,50 |
|
Equity / liabilities |
1,09 |
1,09 |
1,09 |
1,08 |
1,09 |
|
Balance total / liabilities |
2,09 |
2,09 |
2,09 |
2,08 |
2,09 |
|
|
|||||
|
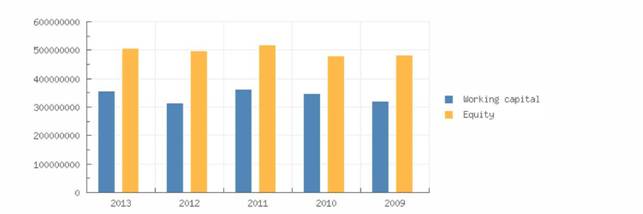
Working capital |
356.920.000 |
313.674.000 |
364.416.000 |
347.719.000 |
320.139.000 |
|
Equity |
508.492.000 |
498.639.000 |
517.653.000 |
479.968.000 |
483.854.000 |
|
Mutation equity |
1,98 |
-3,67 |
7,85 |
-0,80 |
12,35 |
|
Mutation short term liabilities |
-3,2 |
7,85 |
18,70 |
-18,31 |
5,02 |
|
Return on total assets (ROA) |
8,45 |
17,48 |
21,06 |
22,91 |
22,98 |
|
Return on equity (ROE) |
16,20 |
33,54 |
40,43 |
44,08 |
44,17 |
|
Gross profit margin |
3,14 |
6,11 |
7,61 |
7,82 |
7,88 |
|
Net profit margin |
2,45 |
4,69 |
5,71 |
5,73 |
5,62 |
|
Year |
2013 |
2012 |
2011 |
2010 |
2009 |
|
|
|||||
|
Average collection ratio |
9,06 |
9,13 |
9,99 |
11,81 |
9,71 |
|
Average payment ratio |
21,70 |
24,46 |
25,51 |
25,17 |
22,00 |
|
Equity turnover ratio |
5,16 |
5,48 |
5,35 |
5,75 |
5,74 |
|
Total assets turnover ratio |
2,69 |
2,85 |
2,79 |
2,99 |
2,99 |
|
Fixed assets turnover ratio |
7,97 |
7,94 |
7,86 |
8,07 |
8,58 |
|
Inventory conversion ratio |
5,56 |
6,13 |
5,89 |
6,79 |
6,40 |
|
|
|||||
|
Turnover |
2.621.737.000 |
2.730.281.000 |
2.769.534.000 |
2.759.545.000 |
2.777.804.000 |
|
Gross margin |
798.263.000 |
833.202.000 |
840.238.000 |
833.048.000 |
812.974.000 |
|
Operating result |
82.384.000 |
166.918.000 |
210.754.000 |
215.867.000 |
219.012.000 |
|
Net result after taxes |
64.121.000 |
128.077.000 |
158.204.000 |
158.114.000 |
156.183.000 |
|
|
|||||
|
Cashflow |
148.312.000 |
209.951.000 |
237.720.000 |
236.905.000 |
230.588.000 |
|
EBIT |
82.384.000 |
166.918.000 |
210.754.000 |
215.867.000 |
219.012.000 |
|
EBITDA |
166.575.000 |
248.792.000 |
290.270.000 |
294.658.000 |
293.417.000 |
Summary
The 2013 financial result structure is a postive working captial
of 356.920.000 euro, which is
in agreement with 37 % of the total assets of the company.
The working capital has increased with 13.79 % compared to
previous year. The ratio, with
respect to the total assets of the company has however,
increased.
The improvement between 2012 and 2013 has mainly been
caused by an increase of the
current assets.
The current ratio of the company in 2013 was 2.23. A
company with a current ratio between
1.5 and 3.0 generally indicates good short-term financial
strength.
The quick ratio in 2013 of the company was 0.6. A company
with a Quick Ratio of less than 1
cannot currently pay back its current liabilities.
The 2012 financial result structure is a postive working
captial of 313.674.000 euro, which is
in agreement with 33 % of the total assets of the company.
The working capital has diminished with -13.92 % compared
to previous year. The ratio, with
respect to the total assets of the company has however,
declined.
The deterioration between 2011 and 2012 has mainly been caused
by an increase of the
current liabilities.
The current ratio of the company in 2012 was 2.05. A
company with a current ratio between
1.5 and 3.0 generally indicates good short-term financial
strength.
The quick ratio in 2012 of the company was 0.56. A company
with a Quick Ratio of less than
1 cannot currently pay back its current liabilities.
FINANCIAL STATEMENT
Type of annual account Consolidated
Annual account Blokker Holding B.V.
Naarderstraat
50
1251BD
Laren
Netherlands
Registration number: 331349430000
BALANCE
|
Year |
2013 |
2012 |
2011 |
2010 |
2009 |
|
End date |
2013-01-26 |
2012-01-28 |
2011-01-29 |
2010-01-30 |
2009-01-24 |
|
Intangible fixed assets |
|
1.136.000 |
|||
|
Tangible fixed assets |
327.907.000 |
342.845.000 |
349.950.000 |
339.933.000 |
320.437.000 |
|
Financial fixed assets |
1.124.000 |
1.124.000 |
2.247.000 |
2.140.000 |
2.022.000 |
|
Fixed assets |
329.031.000 |
343.969.000 |
352.197.000 |
342.073.000 |
323.595.000 |
|
Total stock |
471.669.000 |
445.178.000 |
470.356.000 |
406.147.000 |
434.307.000 |
|
Accounts receivable |
26.021.000 |
24.034.000 |
26.462.000 |
27.602.000 |
31.549.000 |
|
Other receivables |
94.781.000 |
87.567.000 |
82.117.000 |
82.030.000 |
94.721.000 |
|
Total receivables |
120.802.000 |
111.601.000 |
108.579.000 |
109.632.000 |
126.270.000 |
|
Liquid funds |
53.841.000 |
55.996.000 |
62.821.000 |
65.587.000 |
45.579.000 |
|
Current assets |
646.312.000 |
612.775.000 |
641.756.000 |
581.366.000 |
606.156.000 |
|
Total assets |
975.343.000 |
956.744.000 |
993.953.000 |
923.439.000 |
929.751.000 |
|
Total equity |
508.492.000 |
498.639.000 |
517.653.000 |
479.968.000 |
483.854.000 |
|
|
|||||
|
Provisions |
74.386.000 |
60.316.000 |
54.573.000 |
49.160.000 |
48.750.000 |
|
Long term interest yielding debt |
103.073.000 |
98.688.000 |
144.387.000 |
160.664.000 |
111.130.000 |
|
Long term liabilities |
103.073.000 |
98.688.000 |
144.387.000 |
160.664.000 |
111.130.000 |
|
Accounts payable |
85.467.000 |
89.163.000 |
78.220.000 |
94.726.000 |
107.069.000 |
|
Other short term liabilities |
203.925.000 |
209.938.000 |
199.120.000 |
138.921.000 |
178.948.000 |
|
Short term liabilities |
289.392.000 |
299.101.000 |
277.340.000 |
233.647.000 |
286.017.000 |
|
Total short and long term liabilities |
466.851.000 |
458.105.000 |
476.300.000 |
443.471.000 |
445.897.000 |
|
Total liabilities |
975.343.000 |
956.744.000 |
993.953.000 |
923.439.000 |
929.751.000 |
Summary
The total assets of the company increased with 1.94 %
between 2012 and 2013.
Despite the assets growth, the non current assets
decreased with -4.34 %.
The asset growth has mainly been financed by a Net Worth
increase of 1.98 %. Debt,
however, grew with 1.91 %.
In 2013 the assets of the company were 33.73 % composed of
fixed assets and 66.27 % by
current assets. The assets are being financed by an equity
of 52.13 %, and total debt of
47.87 %.
The total assets of the company decreased with -3.74 % between
2011 and 2012.
This total assets decrease has been reflected in a
reduction of non current assets of -2.34 %.
Assets reduction is explained by a Net Worth decrease of
-3.67 %, and an indebtedness
reduction of -3.82 %.
In 2012 the assets of the company were 35.95 % composed of
fixed assets and 64.05 % by
current assets. The assets are being financed by an equity
of 52.12 %, and total debt of
47.88 %
PROFIT AND LOSS
|
Year |
2013 |
2012 |
2011 |
2010 |
2009 |
|
Revenues |
2.621.737.000 |
2.730.281.000 |
2.769.534.000 |
2.759.545.000 |
2.777.804.000 |
|
Net turnover |
2.621.737.000 |
2.730.281.000 |
2.769.534.000 |
2.759.545.000 |
2.777.804.000 |
|
|
|||||
|
Gross margin |
798.263.000 |
833.202.000 |
840.238.000 |
833.048.000 |
812.974.000 |
|
|
|||||
|
Wages and salaries |
500.875.000 |
487.864.000 |
496.677.000 |
482.085.000 |
435.460.000 |
|
Amorization and depreciation |
84.191.000 |
81.874.000 |
79.516.000 |
78.791.000 |
74.405.000 |
|
Sales |
1.823.474.000 |
1.897.079.000 |
1.929.296.000 |
1.926.497.000 |
1.964.830.000 |
|
other operating costs |
130.813.000 |
96.546.000 |
53.291.000 |
56.305.000 |
84.097.000 |
|
Operating expenses |
2.539.353.000 |
2.563.363.000 |
2.558.780.000 |
2.543.678.000 |
2.558.792.000 |
|
Year |
2013 |
2012 |
2011 |
2010 |
2009 |
|
Operating result |
82.384.000 |
166.918.000 |
210.754.000 |
215.867.000 |
219.012.000 |
|
|
|||||
|
Financial income |
692.000 |
1.761.000 |
1.247.000 |
2.586.000 |
6.304.000 |
|
Financial expenses |
699.000 |
1.460.000 |
2.721.000 |
6.905.000 |
11.621.000 |
|
Financial result |
-7.000 |
301.000 |
-1.474.000 |
-4.319.000 |
-5.317.000 |
|
Result on ordinary operations before taxes |
82.377.000 |
167.219.000 |
209.280.000 |
211.548.000 |
213.695.000 |
|
|
|||||
|
Taxation on the result of ordinary
activities |
18.256.000 |
39.142.000 |
51.076.000 |
53.434.000 |
57.512.000 |
|
Result of ordinary activities after taxes |
64.121.000 |
128.077.000 |
158.204.000 |
158.114.000 |
156.183.000 |
|
|
|||||
|
Net result |
64.121.000 |
128.077.000 |
158.204.000 |
158.114.000 |
156.183.000 |
Summary
The turnover of the company decreased by -3.98 % between
2012 and 2013.
The gross profit of the company decreased by -4.19 %
between 2012 and 2013.
The operating result of the company declined with -50.64 %
between 2012 and 2013. This
evolution implies an decrease of the company's economic
profitability.
The result of these changes is a reduction of the
company's Economic Profitability of -51.66
% of the analysed period, being equal to 2012 % in the
year 2013.
This fall has contributed to a asset turnover decrease,
whose index evolved from -5.61 to a
level of 2.69.
The Net Result of the company increased by -49.94 %
between 2012 and 2013.
The company's Financial Profitability has been negatively
affected by the financial activities in
comparison to the EBITs behaviour. The result of these
variations is a profitability reduction
of -51.7 % of the analysed period, being 16.2 % in the
year 2013.
The company's financial profitability has been positively
affected by its financial structure.
The turnover of the company decreased by -1.42 % between
2011 and 2012.
The gross profit of the company has remained the same
between 2011 and 2012.
The operating result of the company declined with -20.8 %
between 2011 and 2012. This
evolution implies an decrease of the company's economic
profitability.
The result of these changes is a reduction of the
company's Economic Profitability of -17 % of
the analysed period, being equal to 2011 % in the year
2012.
Despite the decline the assets turnover increased by 2.15
% reaching 2.85.
The Net Result of the company increased by -19.04 %
between 2011 and 2012.
The company's Financial Profitability has been negatively
affected by the financial activities in
comparison to the EBITs behaviour. The result of these
variations is a profitability reduction
of -17.04 % of the analysed period, being 33.54 % in the
year 2012.
The company's financial profitability has been positively
affected by its financial structure.
ANALYSIS
Branch (SBI) Wholesale
trade (no motor vehicles and motorcycles) (46)
Region Midden-Brabant
In
the Netherlands 109662 of the companies are registered with the SBI code 46
In the
region Midden-Brabant 5737 of the companies are registered with the SBI code 46
In
the Netherlands 2387 of the bankrupcties are published within this sector
In
the region Midden-Brabant 108 of the bankruptcies are published within this
sector
The
risk of this specific sector in the Netherlands is normal
The
risk of this specific sector in the region Midden-Brabant is normal
PUBLICATION
Consent statements 04-04-2014:
Voor boekjaar 2014 is een instemmingsverklaring gedeponeerd.
04-04-2014:
Voor boekjaar 2015 is een instemmingsverklaring gedeponeerd.
03-04-2012:
Voor boekjaar 2012 is een instemmingsverklaring gedeponeerd.
03-04-2012:
Voor boekjaar 2013 is een instemmingsverklaring gedeponeerd.
Functions
06-02-2012:
Per 01-02-2012 is bestuurder Leonardus Rudolphus Maria Steenbekkers in
functie
getreden.
06-02-2012:
Per 01-02-2012 is bestuurder Henric Jan Jozef de Bie in functie getreden.
06-02-2012:
Per 31-01-2012 is bestuurder Alexander Johannes Jozephus van Schaik uit
functie
getreden.
COMPANY STRUCTURE
Relations 29
Blokker
Holding B.V.
Naarderstraat 50
1251BD Laren
Netherlands
Registration number: 331349430000
•
Xenos Holding B.V.
Schutweg 8
5145NP WAALWIJK
Netherlands
Registration number: 160716350000
•
Xenos B.V.
Schutweg 8
5145NP Waalwijk
Netherlands
Registration number: 160326530000
FOREIGN EXCHANGE RATES
|
Currency |
Unit
|
Indian Rupees |
|
US Dollar |
1 |
Rs.59.72 |
|
|
1 |
Rs.100.81 |
|
Euro |
1 |
Rs.82.22 |
INFORMATION DETAILS
|
Analysis Done by
: |
DIV |
|
|
|
|
Report Prepared
by : |
PDT |
RATING EXPLANATIONS
|
RATING |
STATUS |
PROPOSED CREDIT LINE |
|
|
|
>86 |
Aaa |
Possesses an extremely sound financial base with the strongest
capability for timely payment of interest and principal sums |
Unlimited |
|
|
71-85 |
Aa |
Possesses adequate working capital. No caution needed for credit
transaction. It has above average (strong) capability for payment of interest
and principal sums |
Large |
|
|
56-70 |
A |
Financial & operational base are regarded healthy. General
unfavourable factors will not cause fatal effect. Satisfactory capability for
payment of interest and principal sums |
Fairly Large |
|
|
41-55 |
Ba |
Overall operation is considered normal. Capable to meet normal
commitments. |
Satisfactory |
|
|
26-40 |
B |
Capability to overcome financial difficulties seems comparatively
below average. |
Small |
|
|
11-25 |
Ca |
Adverse factors are apparent. Repayment of interest and principal sums
in default or expected to be in default upon maturity |
Limited with
full security |
|
|
<10 |
C |
Absolute credit risk exists. Caution needed to be exercised |
Credit not
recommended |
|
|
-- |
NB |
New Business |
-- |
|
This score serves as a reference to assess SC’s credit risk
and to set the amount of credit to be extended. It is calculated from a
composite of weighted scores obtained from each of the major sections of this
report. The assessed factors and their relative weights (as indicated through
%) are as follows:
Financial
condition (40%) Ownership
background (20%) Payment
record (10%)
Credit history
(10%) Market trend
(10%) Operational
size (10%)
This report is issued at your request without any
risk and responsibility on the part of MIRA INFORM PRIVATE LIMITED (MIPL)
or its officials.