MIRA
INFORM REPORT
|
Report Date : |
19.05.2014 |
IDENTIFICATION DETAILS
|
Name : |
AGLIKA TREYD OOD |
|
|
|
|
Registered Office : |
Ul.Nikola Gabrovski 73 A 5000 Veliko Tarnovo |
|
|
|
|
Country : |
Bulgaria |
|
|
|
|
Financials (as on) : |
31.12.2012 |
|
|
|
|
Year of Establishment : |
2009 |
|
|
|
|
Legal Form : |
Limited Liability Company |
|
|
|
|
Line of Business : |
Manufacture of made-up textile articles, except apparel |
|
|
|
|
No of Employees : |
165 |
RATING & COMMENTS
|
MIRA’s Rating : |
Ba |
|
RATING |
STATUS |
PROPOSED CREDIT LINE |
|
|
41-55 |
Ba |
Overall operation is considered normal. Capable to meet normal
commitments. |
Satisfactory |
|
Status : |
Satisfactory |
|
|
|
|
Payment Behaviour : |
No Complaints |
|
|
|
|
Litigation : |
Clear |
NOTES :
Any query related to this report can be made
on e-mail : infodept@mirainform.com
while quoting report number, name and date.
ECGC Country Risk Classification List – September 30, 2013
|
Country Name |
Previous Rating (30.09.2013) |
Current Rating (01.12.2013) |
|
Bulgaria |
A2 |
A2 |
|
Risk Category |
ECGC
Classification |
|
Insignificant |
A1 |
|
Low Risk |
A2 |
|
Moderate Low Risk |
B1 |
|
Moderate Risk |
B2 |
|
Moderate High Risk |
C1 |
|
High Risk |
C2 |
|
Very High Risk |
D |
BULGARIA - ECONOMIC OVERVIEW
Bulgaria, a former Communist country that entered the EU on 1 January 2007, averaged more than 6% annual growth from 2004 to 2008, driven by significant amounts of bank lending, consumption, and foreign direct investment. Successive governments have demonstrated a commitment to economic reforms and responsible fiscal planning, but the global downturn sharply reduced domestic demand, exports, capital inflows, and industrial production. GDP contracted by 5.5% in 2009, and has been slow to recover in the years since. Despite having a favorable investment regime, including low, flat corporate income taxes, significant challenges remain. Corruption in public administration, a weak judiciary, and the presence of organized crime continue to hamper the country's investment climate and economic prospects.
|
Source
: CIA |
COMPANY DETAILS
Local
name: AGLIKA TREYD OOD
International
name: AGLIKA TRADE OOD
Registered
address:
UL.NIKOLA GABROVSKI 73 A
5000 VELIKO TARNOVO
Bulgaria
Telephone: +359-62-602102
Fax: +359-62-602103
Internet: http://www.aglika.bg
ESTABLISHMENT
& REGISTRATION:
Established: 2009
Registered at Trade Register
Court number 200813618
Bulstat/VAT number: 200813618
LEGAL
FORM:
Limited Liability Company (OOD)
REGISTERED
CAPITAL:
BGN 20 000.00
SHAREHOLDERS/MANAGEMENT
SHAREHOLDERS:
YULIYAN PETKOV PETKOV
ID 7803191520, Function:
Shareholder, Nationality: Bulgaria
Share: 50,00%
MAYA PETKOVA PETKOVA
ID 7410031496, Function:
Shareholder, Nationality: Bulgaria
Share: 50,00%
MANAGEMENT:
MAYA PETKOVA PETKOVA (Personal
ID 7410031496) - Manager
YULIYAN PETKOV PETKOV (Personal
ID 7803191520) - Manager
RELATED
COMPANIES:
|
Company
ID |
Company
Name |
|
200071241 |
INTER MATIRIALS |
|
119649644 |
AGLIKA - STROY |
|
119649637 |
AGLIKA - HOLIDEY |
|
104095883 |
SIMAKO |
BUSINESS ACTIVITY
BUSINESS
OPERATION:
NACE 1.1: 17.40 Manufacture of
made-up textile articles, except apparel
Activity:
Production of interior textiles
- tablecloths, curtains, linen, etc.
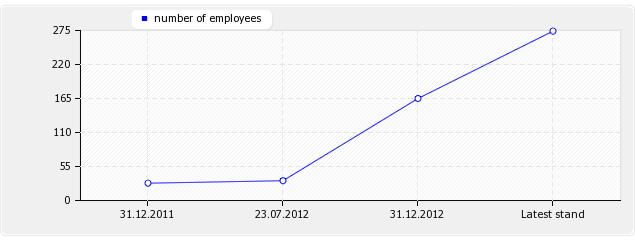
NUMBER
OF EMPLOYEES:
|
As
at date |
Value |
|
31.12.2011 |
28 |
|
23.07.2012 |
32 |
|
31.12.2012 |
165 |
|
Latest
stand |
274 |
EXPORT:
EU
IMPORT:
EU
REAL
ESTATE:
None
FINANCIAL DATA
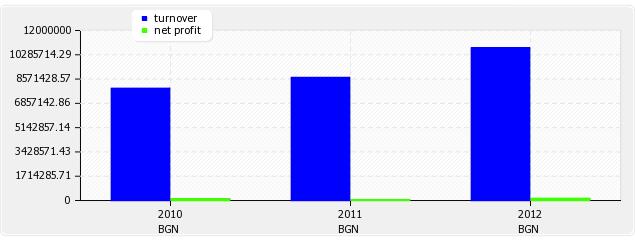
TURNOVER:
|
Year |
Currency |
Value |
|
2010 |
BGN |
7
920 000.00 |
|
2011 |
BGN |
8
685 000.00 |
|
2012 |
BGN |
10
756 000.00 |
MODES OF PAYMENT:
Payments are made within agreed terms.
DEBT COLLECTION:
No debt collection cases are registered
against the company.
BANK DISTRAINTS:
No shares of the company are under bank distraint.
UNPAID TAXES/
CONTRIBUTIONS TO GOVERNMENT:
There is no publication about overdue unpaid
taxes.
INVOLVEMENT IN
LEGAL DISPUTES:
There is no publication about legal claims
or disputes against the company.
OTHER PAYMENT
INFORMATION:
No adverse payment information is available.
BRANCH INDICATOR:
The company's payment behaviour is average
for the branch.
GENERAL PAYMENT
ASSESSMENT:
B+
FINANCIAL OPINION:
B
Exchange rate since 1998 is 1
BGN (denominated lev) = 0.51 EUR
Ratio
|
Ratio |
2010 |
2011 |
2012 |
|
Debt ratio |
0.91 |
0.92 |
0.93 |
|
Quick ratio |
0.99 |
2.67 |
0.61 |
|
Current ratio |
1.08 |
2.88 |
0.69 |
|
Days purchase in payables |
80.90 |
39.61 |
150.15 |
|
Operating margin in % |
1.77 |
0.75 |
1.66 |
|
Cash ratio (acid ratio) |
0.01 |
0.38 |
0.14 |
|
Return on sales ROS in % |
1.60 |
0.67 |
1.45 |
|
Return on assets ROA in % |
6.48 |
1.97 |
3.25 |
|
Return on equity ROE in % |
74.56 |
25.55 |
49.84 |
|
Days supply in inventory |
7.34 |
8.42 |
11.30 |
|
Days sales in receivables |
79.26 |
90.75 |
70.43 |
BALANCE SHEET
|
BALANCE SHEET in BGN'000 |
2010 |
2011 |
2012 |
|
Accounting
period: |
1.1.2010
- |
1.1.2011
- |
1.1.2012
- |
|
A.UNPAID CAPITAL |
|
|
|
|
B. FIXED ASSETS |
|
|
|
|
I Fixed Intangible Assets: |
|
|
|
|
R&D Products |
|
|
|
|
Concessions, patents, trade-marks etc |
|
|
|
|
Goodwill |
|
|
|
|
Intangible fixed assets under construction |
|
|
|
|
thereof advances |
|
|
|
|
Total I: |
|
|
|
|
II Fixed Tangible Assets |
|
|
|
|
Land and Buildings |
|
|
|
|
thereof Land |
|
|
|
|
thereof Buildings |
|
|
|
|
Machines, Vehicles |
|
9 |
162 |
|
Equipment |
8 |
56 |
52 |
|
Tangible fixed assets under construction |
|
|
|
|
thereof advances |
|
|
5 |
|
Total II |
8 |
65 |
219 |
|
III. Fixed Financial Assets |
|
|
|
|
Shares in group companies |
|
|
|
|
Loans granted to group companies |
|
|
|
|
Shares in joint ventures |
|
|
|
|
Long term investments |
|
|
|
|
Other loans |
15 |
135 |
1471 |
|
Bought back own shares |
|
|
|
|
Total III |
15 |
135 |
1471 |
|
IV. Deferred Taxes |
|
|
|
|
B. FIXED ASSETS TOTAL |
23 |
200 |
1690 |
|
C. CURRENT ASSETS |
|
|
|
|
I. Inventories |
|
|
|
|
Raw Materials |
123 |
182 |
137 |
|
Work in progress |
2 |
|
169 |
|
thereof young animals |
|
|
|
|
Trading goods |
36 |
21 |
25 |
|
thereof production |
14 |
7 |
2 |
|
thereof goods for sale |
22 |
14 |
23 |
|
Advances |
|
|
|
|
Total I |
161 |
203 |
331 |
|
II. Receivables |
|
|
|
|
Receivables from customers |
1387 |
1983 |
1709 |
|
thereof more than 1 year |
|
|
|
|
Receivables from group companies |
|
|
|
|
thereof more than 1 year |
|
|
|
|
Receivables from joint ventures |
|
|
|
|
thereof more than 1 year |
|
|
|
|
Other receivables |
351 |
205 |
354 |
|
thereof more than 1 year |
|
|
|
|
Total II |
1738 |
2188 |
2063 |
|
III. Current Financial Assets |
|
|
|
|
Current investments in related companies |
|
|
|
|
Bought back own shares |
|
|
|
|
Other current financial assets |
|
|
|
|
Total III |
|
|
|
|
IV. Cash equivalents |
|
|
|
|
Cash and accounts in the country |
|
|
|
|
thereof cash |
19 |
248 |
601 |
|
Thereof cash in foreign currency (equivalent) |
|
|
|
|
thereof current accounts |
2 |
112 |
19 |
|
thereof blocked accounts |
|
|
|
|
thereof cash equivalents |
|
|
|
|
Cash and accounts abroad |
|
|
|
|
thereof cash |
|
|
|
|
Thereof cash in foreign currency (equivalent) |
|
|
|
|
thereof current accounts |
|
|
|
|
thereof blocked accounts |
|
|
|
|
Total IV |
21 |
360 |
620 |
|
C. CURRENT ASSETS TOTAL |
1920 |
2751 |
3014 |
|
D. Deferred expenses |
|
|
1 |
|
TOTAL ASSETS |
1943 |
2951 |
4705 |
|
A. OWNERS EQUITY |
|
|
|
|
I. Share capital |
20 |
20 |
20 |
|
II. Issue premium |
|
|
|
|
III. Revaluation reserves |
|
|
|
|
thereof revaluation reserves of financial instruments |
|
|
|
|
IV. Reserves |
|
|
|
|
legal reserves |
|
|
|
|
reserve related to bought back own shares |
|
|
|
|
reserve from company foundation |
|
|
|
|
other reserves |
|
|
|
|
Total IV |
|
|
|
|
V. Result from previous period |
|
|
|
|
Undistributed profit |
23 |
149 |
134 |
|
Uncovered loss |
|
|
|
|
Total V |
23 |
149 |
134 |
|
VI. Current result profit (loss) |
126 |
58 |
153 |
|
A. OWNERS EQUITY TOTAL |
169 |
227 |
307 |
|
B. PROVISIONS |
|
|
|
|
Provisions for pensions |
|
|
|
|
Provisions for taxes |
|
|
|
|
thereof deferred taxes |
|
|
|
|
Other provisions |
|
|
|
|
B. PROVISIONS TOTAL |
|
|
|
|
C. LIABILITIES |
|
|
|
|
Bond-backed loans |
|
|
|
|
less than 1 year |
|
|
|
|
more than 1 year |
|
|
|
|
Bank loans |
557 |
1769 |
2938 |
|
less than 1 year |
557 |
|
2938 |
|
more than 1 year |
|
1769 |
|
|
Advances received |
|
232 |
57 |
|
less than 1 year |
|
232 |
57 |
|
more than 1 year |
|
|
|
|
Payables to suppliers |
1186 |
688 |
1230 |
|
less than 1 year |
1186 |
688 |
1230 |
|
more than 1 year |
|
|
|
|
Liabilities on policies |
|
|
|
|
less than 1 year |
|
|
|
|
more than 1 year |
|
|
|
|
Liabilities to group companies |
|
|
|
|
less than 1 year |
|
|
|
|
more than 1 year |
|
|
|
|
Liabilities to joint-venture companies |
|
|
|
|
less than 1 year |
|
|
|
|
more than 1 year |
|
|
|
|
Other liabilities |
31 |
35 |
173 |
|
less than 1 year |
|
|
173 |
|
more than 1 year |
|
|
|
|
thereof to personnel |
13 |
24 |
111 |
|
less than 1 year |
|
|
111 |
|
more than 1 year |
|
|
|
|
thereof to social insurance |
4 |
6 |
41 |
|
less than 1 year |
|
|
41 |
|
more than 1 year |
|
|
|
|
thereof for taxes |
12 |
1 |
20 |
|
less than 1 year |
|
|
20 |
|
more than 1 year |
|
|
|
|
C. LIABILITIES TOTAL |
1774 |
2724 |
4398 |
|
less than 1 year |
1774 |
955 |
4398 |
|
more than 1 year |
|
1769 |
|
|
D. FINANCING AND DEFERRED INCOME |
|
|
|
|
thereof |
|
|
|
|
Financing |
|
|
|
|
Deferred income |
|
|
|
|
TOTAL EQUITY AND LIABILITIES |
1943 |
2951 |
4705 |
P&L ACCOUNT
|
P&L ACCOUNT in BGN'000 |
2010 |
2011 |
2012 |
|
Accounting
period: |
1.1.2010
- |
1.1.2011
- |
1.1.2012
- |
|
A. EXPENSES |
|
|
|
|
I. OPERATION EXPENSES |
|
|
|
|
Decrease of inventories |
|
|
|
|
thereof for materials |
4600 |
4566 |
6836 |
|
thereof for services |
3000 |
3605 |
1880 |
|
Personnel expenses |
119 |
172 |
846 |
|
thereof wages |
99 |
142 |
691 |
|
thereof social insurance |
20 |
30 |
155 |
|
thereof pensions |
|
|
|
|
Depreciation |
2 |
8 |
31 |
|
thereof Depreciation of fixed assets |
2 |
8 |
31 |
|
Other expenses |
24 |
180 |
895 |
|
thereof Book value of sold assets (without production) |
21 |
167 |
294 |
|
I. OPERATION EXPENSES TOTAL |
7745 |
8531 |
10488 |
|
II. Financial expenditures |
|
|
|
|
Depreciation of financial assets |
|
|
|
|
thereof exchange rate losses |
|
|
|
|
Paid interest |
36 |
142 |
162 |
|
thereof interest to group companies |
|
|
|
|
Thereof expenditures for securities operations |
|
|
|
|
II. Financial expenditures Total |
36 |
142 |
162 |
|
B. Profit on ordinary activity |
140 |
65 |
175 |
|
III. Extraordinary expenses |
|
|
|
|
thereof expenses on disasters and emergency expenses |
|
|
|
|
C. Total expenses (I+II+III) |
7781 |
8673 |
10650 |
|
D. Accounting profit |
140 |
65 |
175 |
|
IV. Taxation on profit |
14 |
7 |
22 |
|
V. Other taxes |
|
|
|
|
E. Net profit |
126 |
58 |
153 |
|
Total expenses |
7921 |
8738 |
10825 |
|
A. REVENUES |
|
|
|
|
I . OPERATING REVENUES |
|
|
|
|
Net sales |
7894 |
8680 |
10545 |
|
Production |
7850 |
8497 |
10232 |
|
Goods |
22 |
24 |
307 |
|
Services |
22 |
2 |
6 |
|
Increase of production and work in progress |
22 |
3 |
178 |
|
Expenses on acquisition of assets |
|
|
|
|
Other revenues |
4 |
2 |
33 |
|
thereof financing |
|
|
|
|
I. TOTAL OPERATING REVENUES |
7920 |
8685 |
10756 |
|
II FINANCIAL REVENUES |
|
|
|
|
Income from shares |
|
|
|
|
thereof income from shares in group companies |
|
|
|
|
Income from investments and loans |
|
|
|
|
thereof from investments in group companies |
|
|
|
|
Income from interest |
|
|
69 |
|
thereof from interest from group companies |
|
|
|
|
II FINANCIAL REVENUES TOTAL |
1 |
53 |
69 |
|
TOTAL REVENUES FROM ORDINARY ACTIVITIES |
7921 |
8738 |
10825 |
|
LOSS |
|
|
|
|
Extraordinary revenues |
|
|
|
|
AFTER TAX LOSS |
|
|
|
|
TOTAL REVENUES |
7921 |
8738 |
10825 |
FOREIGN EXCHANGE RATES
|
Currency |
Unit
|
Indian Rupees |
|
US Dollar |
1 |
Rs. 58.86 |
|
|
1 |
Rs. 98.82 |
|
Euro |
1 |
Rs. 80.71 |
INFORMATION DETAILS
|
Analysis Done by
: |
KRN |
|
|
|
|
Report Prepared
by : |
DPT |
RATING EXPLANATIONS
|
RATING |
STATUS |
PROPOSED CREDIT LINE |
|
|
>86 |
Aaa |
Possesses an extremely sound financial base with the strongest
capability for timely payment of interest and principal sums |
Unlimited |
|
71-85 |
Aa |
Possesses adequate working capital. No caution needed for credit
transaction. It has above average (strong) capability for payment of interest
and principal sums |
Large |
|
56-70 |
A |
Financial & operational base are regarded healthy. General
unfavourable factors will not cause fatal effect. Satisfactory capability for
payment of interest and principal sums |
Fairly Large |
|
41-55 |
Ba |
Overall operation
is considered normal. Capable to meet normal commitments. |
Satisfactory |
|
26-40 |
B |
Capability to overcome financial difficulties seems comparatively
below average. |
Small |
|
11-25 |
Ca |
Adverse factors are apparent. Repayment of interest and principal sums
in default or expected to be in default upon maturity |
Limited with
full security |
|
<10 |
C |
Absolute credit risk exists. Caution needed to be exercised |
Credit not
recommended |
|
-- |
NB |
New Business |
-- |
This score serves as a reference to assess SC’s credit risk
and to set the amount of credit to be extended. It is calculated from a
composite of weighted scores obtained from each of the major sections of this
report. The assessed factors and their relative weights (as indicated through
%) are as follows:
Financial
condition (40%) Ownership
background (20%) Payment record
(10%)
Credit history
(10%) Market trend
(10%) Operational
size (10%)
This report is issued at your request without any
risk and responsibility on the part of MIRA INFORM PRIVATE LIMITED (MIPL)
or its officials.