MIRA
INFORM REPORT
|
Report Date : |
24.05.2014 |
IDENTIFICATION DETAILS
|
Name : |
AKZO NOBEL INDIA LIMITED [w.e.f. 31.03.2010] |
|
|
|
|
Formerly Known
As : |
ICI INDIA LIMITED |
|
|
|
|
Registered
Office : |
Geetanjali
Apartment, 1st Floor, 8-B, Middleton Street, Kolkata – 700071,
West Bengal |
|
|
|
|
Country : |
|
|
|
|
|
Financials (as
on) : |
31.03.2013 |
|
|
|
|
Date of
Incorporation : |
12.03.1954 |
|
|
|
|
Com. Reg. No.: |
21-021516 |
|
|
|
|
Capital
Investment / Paid-up Capital : |
Rs. 467.000
Millions |
|
|
|
|
CIN No.: [Company Identification
No.] |
L24292WB1954PLC021516 |
|
|
|
|
TAN No.: [Tax Deduction &
Collection Account No.] |
MUMI04848E /
MUMI05763C |
|
|
|
|
PAN No.: [Permanent Account No.] |
AAACI6297A |
|
|
|
|
Legal Form : |
A
Public Limited Liability Company. The company’s
shares are listed on the Stock Exchanges. |
|
|
|
|
Line of Business
: |
Manufacturer
of Paints. |
|
|
|
|
No. of Employees
: |
1795 (Approximately) |
RATING & COMMENTS
|
MIRA’s Rating : |
A (64) |
|
RATING |
STATUS |
PROPOSED CREDIT LINE |
|
|
56-70 |
A |
Financial & operational base are regarded healthy. General
unfavourable factors will not cause fatal effect. Satisfactory capability for
payment of interest and principal sums |
Fairly Large |
|
Maximum Credit Limit : |
USD 44000000 |
|
|
|
|
Status : |
Good |
|
|
|
|
Payment Behaviour : |
Regular |
|
|
|
|
Litigation : |
Exist |
|
|
|
|
Comments : |
Subject is a well-established company having fine track record. The rating reflects healthy financial risk profile supported by strong
liquidity, the company’s sizeable market share and strong brand position in
the decorative paints segment. Trade relations are reported as fair. Business is active. Payments are
reported to be regular and as per commitments. The company can be considered god for normal business dealings at
usual trade terms and conditions. |
NOTES :
Any query related to this report can be made
on e-mail : infodept@mirainform.com
while quoting report number, name and date.
ECGC Country Risk Classification List – December 1, 2013
|
Country Name |
Previous Rating (30.09.2013) |
Current Rating (01.12.2013) |
|
India |
A1 |
A1 |
|
Risk Category |
ECGC
Classification |
|
Insignificant |
A1 |
|
Low |
A2 |
|
Moderate |
B1 |
|
High |
B2 |
|
Very High |
C1 |
|
Restricted |
C2 |
|
Off-credit |
D |
INDIAN ECONOMIC OVERVIEW
India’s current account deficit for the fiscal third quarter ended
September 2013 narrowed to $4.2 billion or 0.9 % of the gross domestic product
from $31.9 billion or 6.5 % of GDP a year earlier, thanks to a pick-up in
exports and moderation in gold imports. Manufacturing activity and new orders
in India showed their strongest growth in a year in February. The news comes as
a relief after data showed Asia’s third largest economy grew by a
slower-than-expected 4.7 % annually in the three months through December. The
HSBC Manufacturing Purchasing Managers’ Index which gauges the business
activity of India’s factories but not its’ utilities, rose to 52.5 in February,
its highest in a year from 51.4 in January. Overall new orders for factory
goods which rose to a one-year high of 54.9 contributed to the surge. China has
emerged as India’s biggest trading partner in the current financial year
replacing the United Arab Emirates and pushing it to the third spot.
India-China trade has reached $49.5 billion with a 8.7 % share in India’s total
trade. The US comes second at $46 billion with 8.1 % share during the first
nine months of the current financial year.
The Reserve Bank of India has granted an additional nine months to the
public to exchange currency notes printed before 2005 including Rs 500 and Rs
1,000 denominations, pushing the deadline to January 1, 2015. A day before
dates for the Lok Sabha polls were announced, the government decided to hike
interest rates on fixed deposit schemes offered by post offices up to 0.2 per
cent. The new rates will be effective April, 1. The Supreme Court will resume
hearing on March, 11 Nokia’s appeal against a ruling over transferring
ownership of its local mobile phones plant which is the subject of a tax
dispute to Microsoft Corp.
In the last days of the current Government, another scam has surfaced.
The defence ministry has ordered a probe into Hindustan Aeronautics Limited’s
contracts from Britain’s Rolls-Royce Holdings worth at least $ 1.2 billion. The
Central Bureau of Investigation will look into allegations that over $80
million was paid in kickbacks in a deal signed in 2011. India has asked Boeing
Co. to find a solution for problems with state-owned Air India’s 787
Dreamliners. The aircraft has experienced a series of malfunctions since its
debut in 2011.
EXTERNAL AGENCY RATING
|
Rating Agency Name |
CRISIL |
|
Rating |
Short term debt: A1+ |
|
Rating Explanation |
Very strong degree of safety and lowest credit risk. |
|
Date |
19.11.2013 |
RBI DEFAULTERS’ LIST STATUS
Subject’s name is not enlisted as a defaulter
in the publicly available RBI Defaulters’ list.
EPF (Employee Provident Fund) DEFAULTERS’ LIST STATUS
Subject’s name is not enlisted as a defaulter
in the publicly available EPF (Employee Provident Fund) Defaulters’ list as of
31-03-2012.
INFORMATION DECLINED
MANAGEMENT NON – COOPERATIVE (91-33-22267462)
LOCATIONS
|
Registered
Office : |
Geetanjali
Apartment, 1st Floor, 8-B, Middleton Street, Kolkata – 700071, West
Bengal, India |
|
Tel. No. |
91-33-22267462 |
|
Fax No. |
91-33-22277925 |
|
E-Mail |
|
|
Website |
|
|
|
|
|
Corporate
Office / Factory 1 : |
10th
Floor, DLF Plaza Tower, DLF Qutab Enclave, Phase – I, Gurgaon – 122002,
Haryana, India |
|
Tel. No.: |
91-124-2540400 |
|
Fax No.: |
91-124-2540849 |
|
E-Mail : |
|
|
|
|
|
Plant locations: |
|
|
Coatings: |
· Plot No 62 P, Hoskote Industrial Area, Pilgumpa, Village Hoskote Taluk, Bangalore – 562114, Karnataka, India · Hyderabad Works, Balanagar, Hyderabad – 500037, Andhra Pradesh, India · Plot No. GAE-1 (Part), and GAF-1 and GAF-2, Industrial Area, Ghirongi (Malanpur), Bhind – 477117, Madhya Pradesh, India |
|
|
|
|
Chemicals |
Plot No. E-19/20, MIDC Area, Mahad, Raigad – 402301, Maharashtra, India |
|
|
|
|
Factory 2 : |
Located At: Ø Mohali, Punjab Ø Hyderabad, Andhra Pradesh Ø Thane, Maharashtra Ø Bangalore, Karnataka |
|
|
|
|
Headquarters
: |
Located at Gurgaon, Haryana, India |
|
|
|
|
Research and
Technology Centre : |
Located at Thane, Maharashtra, India |
|
|
|
|
Branch Office
: |
National Starch And Chemicals Plot
No. 1/1 TTC Industrial Area, Thane Belapur Road, Kopar Khairane, Navi Mumbai
– 400709, Maharashtra, India |
|
Tel. No.: |
91-22-27780000 |
|
Fax No.: |
91-22-27780025 |
|
E-Mail : |
|
|
|
|
|
Depot : |
8,
Raghuveer Estate, Ahmedabad-382427, Gujarat, India |
|
Tel No.: |
91-79-40372130 |
DIRECTORS
AS ON 31.03.2013
|
Name : |
Mr. N Kaviratne CBE |
|
Designation : |
Chairman |
|
|
|
|
Name : |
Mr. A Jain |
|
Designation : |
Managing Director |
|
|
|
|
Name : |
Mr. P S Basu |
|
Designation : |
Whole Time Director |
|
|
|
|
Name : |
Mr. R Molenaar |
|
Designation : |
Director (w.e.f. 14 May 2013) |
|
|
|
|
Name : |
Ms. S Govil (Alternate Director to Mr. R Molenaar) |
|
Designation : |
Director |
|
|
|
|
Name : |
Mr. R Gopalakrishnan |
|
Designation : |
Director |
|
|
|
|
Name : |
Ms. R S Karnad |
|
Designation : |
Director |
|
|
|
|
Name : |
Dr. S Misra |
|
Designation : |
Director |
|
|
|
|
Name : |
Mr. A Uppal |
|
Designation : |
Director |
KEY EXECUTIVES
|
Name : |
Mr. R. Gupta |
|
Designation : |
Company Secretary |
|
|
|
|
Audit Committee: |
|
|
Name: |
Ø Ms. R S Karnad
(Chairperson) Ø Mr. R Molenaar Ø Mr. R
Gopalakrishnan Ø Dr. S Misra Ø Mr. A Uppal |
|
|
|
|
Remuneration and Nominations Committee: |
|
|
Name: |
Ø Mr. R
Gopalakrishnan (Chairman) Ø Ms. R S Karnad Ø Mr. N Kaviratne
CBE Ø Dr. S Misra Ø Mr. A Uppal |
|
|
|
|
Shareholders/Investors Grievance
Committee: |
|
|
Name: |
Dr S Misra (Chairman) Mr. A Jain Mr. P S Basu |
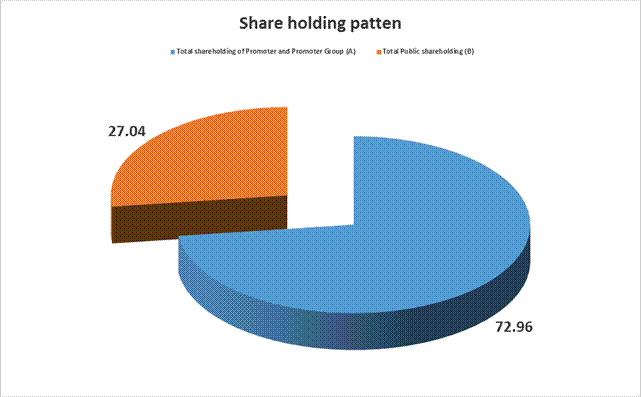
MAJOR SHAREHOLDERS / SHAREHOLDING PATTERN
AS ON 31.03.2014
|
Category of Shareholder |
Total
No. of Shares |
Total
Shareholding as a % |
|
(A) Shareholding of Promoter and Promoter Group |
|
|
|
|
|
|
|
|
|
|
|
|
34044335 |
72.96 |
|
|
34044335 |
72.96 |
|
Total shareholding of Promoter and Promoter Group (A) |
34044335 |
72.96 |
|
(B) Public Shareholding |
|
|
|
|
|
|
|
|
2405481 |
5.16 |
|
|
24940 |
0.05 |
|
|
276 |
0.00 |
|
|
2083985 |
4.47 |
|
|
1061281 |
2.27 |
|
|
600 |
0.00 |
|
|
600 |
0.00 |
|
|
5576563 |
11.95 |
|
|
|
|
|
|
3225324 |
6.91 |
|
|
|
|
|
|
3454460 |
7.40 |
|
|
234054 |
0.50 |
|
|
125578 |
0.27 |
|
|
9850 |
0.02 |
|
|
86609 |
0.19 |
|
|
2990 |
0.01 |
|
|
1048 |
0.00 |
|
|
25081 |
0.05 |
|
|
7039416 |
15.09 |
|
Total Public shareholding (B) |
12615979 |
27.04 |
|
Total (A)+(B) |
46660314 |
100.00 |
|
(C) Shares held by Custodians and against which Depository
Receipts have been issued |
0 |
0.00 |
|
|
0 |
0.00 |
|
|
0 |
0.00 |
|
|
0 |
0.00 |
|
Total (A)+(B)+(C) |
46660314 |
0.00 |
BUSINESS DETAILS
|
Line of Business : |
Manufacturer
of Paints. |
||||||||||||
|
|
|
||||||||||||
|
Products : |
|
PRODUCTION STATUS [AS ON 31.03.2011]
|
Particulars |
Unit |
Installed
Capacity |
Actual
Production |
|
Catalysts |
Tonnes |
2480 |
-- |
|
Paints-Liquid |
KL |
88540 |
73031 |
|
Paints-Stiff |
Tonnes |
3500 |
3892 |
|
Thinners |
KL |
4460 |
3435 |
NOTES:
1. N. A. - Not
Applicable.
2. Production meant
for sale is after adjustment of shortages, handling losses, quantity internally
consumed.
3. Licensed and
installed capacity in respect of intermediates, used entirely for captive
consumption, have not been furnished.
4. All items are
delicensed.
5. Installed
capacities are as certified by the management.
6. Installed
capacity of Catalysts is utilized for toll conversion operations undertaken on
behalf of Johnson Matthey Chemicals India Private Limited and, therefore,
quantity processed has not been included in actual production.
GENERAL INFORMATION
|
No. of Employees : |
1795 (Approximately) |
|
|
|
|
Bankers : |
Ø Citibank Ø Deutsche Bank Ø HDFC Bank Ø Hongkong and
Shanghai Banking Corpn. Ø Royal Bank of
Scotland Ø Standard
Chartered Bank Ø State Bank of India |
|
|
|
|
Banking
Relations : |
-- |
|
|
|
|
Auditors : |
|
|
Name : |
BSR and
Associates Chartered
Accountants |
|
Address: |
Building No. 10,
8th Floor, Tower-B, DLF Cyber City, Phase II, Gurgaon - 122002,
Haryana, India |
|
Tel No.: |
91-124-2549191 |
|
Fax No.: |
91-124-2549101 |
|
|
|
|
Holding Company: |
Imperial Chemical Industries Limited, England (holding company up to 3 June 2012 and related party having significant influence thereafter) |
|
|
|
|
Ultimate Holding
Company: |
Akzo Nobel N.V |
|
|
|
|
Fellow Subsidiaries : |
·
Akzo Nobel Amides Company Limited ·
Akzo Nobel Paints Lanka (Pvt) Limited ·
Akzo Nobel Car Refinishes Indonesia ·
Akzo Nobel Paints Taiwan Limited ·
Akzo Nobel Chang Cheng Limited ·
Akzo Nobel Paints Vietnam Limited ·
Akzo Nobel China Investment Company Limited ·
Akzo Nobel Polymer Chemicals (Ningbo) Company
Limited ·
Akzo Nobel Decorative Coatings B.V. ·
Akzo Nobel Polymer Chemicals B.V. ·
Akzo Nobel Functional Chemicals bv ·
Akzo Nobel Polymer Chemicals LLC ·
Akzo Nobel Ltda-Divisao Titas EM PO ·
Akzo Nobel Powder Coatings (Ningbo) Company
Limited ·
Akzo Nobel Powder Coatings SAS ·
Akzo Nobel Powder Coatings B.V. ·
Akzo Nobel Pulp and Performance Chemicals AB ·
Akzo Nobel Powder Coatings Korea Company Limited ·
Akzo Nobel REP Off BV ·
Akzo Nobel Powder Coatings S.A.E. ·
Akzo Nobel (China) Investment Company Limited ·
Akzo Nobel Powder Coatings South Africa (Pty)
Limited ·
Akzo Nobel (Shanghai) Company Limited ·
Akzo Nobel Pty. Limited ·
Akzo Nobel Amides Company Limited ·
Akzo Nobel Surface Chemistry AB ·
Akzo Nobel Argentina S.A. ·
Akzo Nobel Surface Chemistry L.L.C. ·
Akzo Nobel Asia Pte. Limited ·
Akzo Nobel UAE Paints L.L.C. ·
Akzo Nobel Boya Sanayi ve Ticaret A.S. ·
AkzoNobel Paints Singapore Pte Limited ·
Akzo Nobel Car Refinishes (Singapore) Pte Limited ·
EKA Chemicals AB ·
Akzo Nobel Car Refinishes (Suzhou) Company
Limited ·
ICI (Malaysia) Holdings Sdn Bhd ·
Akzo Nobel Car Refinishes Australia Pty Limited ·
ICI Dulux (Pty) Limited ·
Akzo Nobel Car Refinishes B.V. ·
ICI India Research and Technology Centre ·
Akzo Nobel Car Refinishes SL ·
International Paint - Finland ·
Akzo Nobel Chang Cheng Coatings (Guangdong)
Company Limited ·
International Paint - Vietnam ·
Akzo Nobel Chemicals AG ·
International Paint Japan K.K. ·
Akzo Nobel Chemicals ·
International B.V. ·
International Paint Limited ·
Akzo Nobel Coatings (Dongguan) Limited ·
International Paint Ltda ·
Akzo Nobel Coatings (Jiaxing) Limited ·
International Paint - Ukraine ·
Akzo Nobel Coatings (Tianjin) Limited ·
International Farbenwerke GmbH ·
Akzo Nobel Coatings CZ, a.s. ·
International Färg AB ·
Akzo Nobel Coatings GmbH ·
International Maling A/S ·
Akzo Nobel Coatings Inc. ·
International Paint (Akzo Nobel Chile) Ltda ·
Akzo Nobel Coatings International B.V. ·
International Paint (Hong Kong) Limited ·
Akzo Nobel Coatings Limited ·
International Paint (Korea) Limited ·
Akzo Nobel Coatings S.P.A. ·
International Paint (Nederland) B.V. ·
Akzo Nobel Coatings Sdn Bhd ·
International Paint (Panama) Inc. ·
Akzo Nobel Cross-Linking Peroxides (Ningbo)
Company Limited ·
International Paint (Taiwan) Limited ·
Akzo Nobel Decorative Coatings B.V. ·
International Paint Limited ·
Akzo Nobel Decorative Paints France S.A. ·
International Paint LLC ·
Akzo Nobel Functional Chemicals AB ·
International Paint of Shanghai Company Limited ·
Akzo Nobel Industrial Finishes (Hong Kong)
Limited ·
International Paint Pazarlama Limited Sirketi ·
Akzo Nobel Industrial Paints, S.L. ·
International Paint Sdn Bhd ·
Akzo Nobel International Paint (Suzhou) Company
Limited ·
International Paint Singapore Pte Limited ·
Akzo Nobel Ltda International Peinture S.A. ·
Akzo Nobel N.V. IP Singapore Pte - Vietnam ·
Akzo Nobel Packaging Coatings GmbH ·
Keum Jung Akzo Nobel Peroxides Limited ·
Akzo Nobel Packaging Coatings Limited ·
Pinturas Inca S.A. ·
Akzo Nobel Packaging Coatings S.A. PT ·
Akzo Nobel Car Refinishes Indonesia ·
Akzo Nobel Packaging Coatings S.A.S PT ·
International Paint Indonesia ·
Akzo Nobel Paints (Asia Pacific) Pte Limited ·
Shanghai ICI Research and Development and
Management Company Limited ·
Akzo Nobel Paints (Malaysia) Sdn. Bhd. ·
Tianjin Akzo Nobel Peroxides Company Limited ·
Akzo Nobel Paints (Thailand) Limited |
CAPITAL STRUCTURE
AS ON 31.03.2013
Authorised Capital :
|
No. of Shares |
Type |
Value |
Amount |
|
|
|
|
|
|
126690000 |
Equity Shares |
Rs.10/- each |
Rs. 1267.000 Millions |
|
|
|
|
|
Issued, Subscribed & Paid-up Capital :
|
No. of Shares |
Type |
Value |
Amount |
|
46660314 |
Equity Shares |
Rs.10/- each
|
Rs. 467.000
Millions |
Notes:
(i) In 2011-12, 21,967,544 shares were held by Imperial Chemical Industries Limited England, the holding company. Imperial Chemical Industries Limited England ceased to be the holding company with effect from 4 June 2012 on allotment of new shares as per the scheme of merger (Refer to Note 2). The ultimate holding Company is Akzo Nobel N.V., Netherlands which does not hold any shares directly in the Company.
(ii) Reconciliation of equity shares outstanding at the beginning and at the end of the year:
|
PARTICULARS |
AS ON 31.03.2013 |
|
|
|
Numbers |
R. In Millions |
|
Opening balance |
36,834,331 |
368.343 |
|
Add: Shares allotted on amalgamation |
11,125,983 |
111.260 |
|
Less: Buy back of shares |
(1,300,000) |
(13.000) |
|
|
46,660,314 |
466.603 |
In the previous year, 11,125,983 shares of Rs 10 each were to be
allotted in accordance with the scheme of amalgamation (Refer to Note 2), and
pending such allotment were disclosed as ‘Share capital pending allotment’ in
the balance sheet.
(iii) During the year, 1,300,000 equity shares (2011-12: nil) were
bought back at a consideration of Rs 1,209 million (including related expenses
of Rs 13 million), in terms of the shares
buy back scheme open between 2 July to 13 July 2012. This has been accounted
as below:
·
The nominal value of shares bought back, i.e., Rs
13 million, has been adjusted against the share capital. An equal amount has
been reduced from General reserve and credited to Capital Redemption Reserve,
as per the provision of the Companies Act, 1956.
·
The difference aggregating to Rs 1,196 million
between the consideration paid and the nominal value of shares has been
adjusted against the General Reserve.
All shares bought back were extinguished during the year. The Promoter
Group has further acquired 1.01 million shares in the Company on 31 July 2012.
As a result of the above share buyback and their extinguishment and also of
further acquisition of shares by the Promoter Group, its share holding in the
company has gone up from 68.88% to 72.96%.
(iv) The Company has only one class of equity shares, having a par value
of Rs 10 per share. Each shareholder is eligible to one vote per share held.
The Company declares and pays dividend in Indian Rupees. The dividend proposed,
if any, by the Board of Directors is subject to approval of shareholders in the
ensuing Annual General Meeting. The repayment of equity share capital in the
event of liquidation and buy back of shares are possible subject to prevalent
regulation. In the event of liquidation, normally, the equity shareholders are
eligible to receive the remaining assets of the Company, after distribution of
all preferential amounts in proportion to their shareholding.
(v) Shares in the Company held by
each shareholder holding more than 5% of equity share capital:
|
PARTICULARS |
AS ON 31.03.2013 |
|
|
|
No. of shares |
% of shares held |
|
Imperial Chemical Industries Limited,
England |
22,977,544 |
49.24% |
|
Akzo Nobel Coatings International B.V., The
Netherlands |
8,626,648 |
18.49% |
|
Akzo Nobel Chemicals International B.V., The
Netherlands |
2,439,847 |
5.23% |
|
Asian Paints Limited |
-- |
-- |
(vi) Number of equity shares of Rs 10each bought back in the five years
immediately preceding the Balance Sheet date, aggregates to 5,336,281 (2011-12:
4,036,281)
FINANCIAL DATA
[all figures are
in Rupees Millions]
ABRIDGED BALANCE
SHEET
|
SOURCES OF FUNDS |
31.03.2013 |
31.03.2012 |
31.03.2011 |
|
I.
EQUITY
AND LIABILITIES |
|
|
|
|
(1)Shareholders' Funds |
|
|
|
|
(a) Share Capital |
467.000 |
368.000 |
368.000 |
|
(b) Reserves & Surplus |
10586.000 |
13931.000 |
10548.000 |
|
(c) Money
received against share warrants |
0.000 |
0.000 |
0.000 |
|
|
|
|
|
|
(2) Share Application money pending allotment |
0.000 |
111.000 |
0.000 |
|
Total
Shareholders’ Funds (1) + (2) |
11053.000 |
14410.000 |
10916.000 |
|
|
|
|
|
|
(3)
Non-Current Liabilities |
|
|
|
|
(a) long-term borrowings |
0.000 |
0.000 |
0.000 |
|
(b) Deferred tax liabilities (Net) |
47.000 |
26.000 |
41.000 |
|
(c) Other long term liabilities |
190.000 |
191.000 |
157.000 |
|
(d) long-term provisions |
618.000 |
629.000 |
525.000 |
|
Total Non-current Liabilities (3) |
855.000 |
846.000 |
723.000 |
|
|
|
|
|
|
(4) Current Liabilities |
|
|
|
|
(a) Short term borrowings |
0.000 |
0.000 |
0.000 |
|
(b) Trade payables |
4785.000 |
4161.000 |
2253.000 |
|
(c) Other current
liabilities |
1171.000 |
906.000 |
335.000 |
|
(d) Short-term provisions |
5188.000 |
1757.000 |
1172.000 |
|
Total Current Liabilities (4) |
11144.000 |
6824.000 |
3760.000 |
|
|
|
|
|
|
TOTAL |
23052.000 |
22080.000 |
15399.000 |
|
|
|
|
|
|
II.
ASSETS |
|
|
|
|
(1) Non-current assets |
|
|
|
|
(a) Fixed Assets |
|
|
|
|
(i) Tangible assets |
3548.000 |
3563.000 |
1419.000 |
|
(ii) Intangible Assets |
0.000 |
0.000 |
0.000 |
|
(iii) Capital
work-in-progress |
1057.000 |
148.000 |
145.000 |
|
(iv)
Intangible assets under development |
0.000 |
0.000 |
0.000 |
|
(b) Non-current Investments |
2700.000 |
850.000 |
400.000 |
|
(c) Deferred tax assets (net) |
0.000 |
0.000 |
0.000 |
|
(d) Long-term Loan and Advances |
901.000 |
1188.000 |
573.000 |
|
(e) Other Non-current assets |
16.000 |
4.000 |
0.000 |
|
Total Non-Current Assets |
8222.000 |
5753.000 |
2537.000 |
|
|
|
|
|
|
(2) Current assets |
|
|
|
|
(a) Current investments |
6772.000 |
9185.000 |
9450.000 |
|
(b) Inventories |
3149.000 |
3334.000 |
1532.000 |
|
(c) Trade receivables |
2516.000 |
2260.000 |
701.000 |
|
(d) Cash and cash
equivalents |
857.000 |
739.000 |
303.000 |
|
(e) Short-term loans and
advances |
1291.000 |
543.000 |
875.000 |
|
(f) Other current assets |
245.000 |
266.000 |
1.000 |
|
Total Current Assets |
14830.000 |
16327.000 |
12862.000 |
|
|
|
|
|
|
TOTAL |
23052.000 |
22080.000 |
15399.000 |
PROFIT & LOSS
ACCOUNT
|
|
PARTICULARS |
31.03.2013 |
31.03.2012 |
31.03.20111 |
|
|
|
SALES |
|
|
|
|
|
|
|
Income |
21797.000 |
19425.000 |
10876.000 |
|
|
|
Service Income |
332.000 |
260.000 |
0.000 |
|
|
|
Other Operating Income |
191.000 |
193.000 |
92.000 |
|
|
|
Other Income |
1381.000 |
1123.000 |
987.000 |
|
|
|
TOTAL (A) |
23701.000 |
21001.000 |
11955.000 |
|
|
|
|
|
|
|
|
Less |
EXPENSES |
|
|
|
|
|
|
|
Cost of materials consumed |
10845.000 |
10126.000 |
5261.000 |
|
|
|
Purchase of stock-in-trade |
1990.000 |
1868.000 |
782.000 |
|
|
|
Employee benefits expense |
1753.000 |
1473.000 |
696.000 |
|
|
|
Other expenses |
5727.000 |
5269.000 |
3166.000 |
|
|
|
Exceptional items |
0.000 |
0.000 |
(113.000) |
|
|
|
Changes in
inventories of finished goods, work-in-progress and stock-in-trade |
120.000 |
(604.000) |
(268.000) |
|
|
|
TOTAL (B) |
20435.000 |
18132.000 |
9524.000 |
|
|
|
|
|
|
|
|
Less |
PROFIT
/ (LOSS) BEFORE INTEREST, TAX, DEPRECIATION AND AMORTISATION (A-B) (C) |
3266.000 |
2869.000 |
2431.000 |
|
|
|
|
|
|
|
|
|
Less |
FINANCIAL
EXPENSES (D) |
89.000 |
39.000 |
15.000 |
|
|
|
|
|
|
|
|
|
|
PROFIT
/ (LOSS) BEFORE TAX, DEPRECIATION AND AMORTISATION (C-D) (E) |
3177.000 |
2830.000 |
2416.000 |
|
|
|
|
|
|
|
|
|
Less/ Add |
DEPRECIATION/
AMORTISATION (F) |
386.000 |
366.000 |
217.000 |
|
|
|
|
|
|
|
|
|
|
PROFIT / (LOSS)
BEFORE TAX (E-F) (G) |
2791.000 |
2464.000 |
2199.000 |
|
|
|
|
|
|
|
|
|
Less |
TAX (H) |
603.000 |
446.000 |
433.000 |
|
|
|
|
|
|
|
|
|
|
PROFIT / (LOSS)
AFTER TAX (G-H) (I) |
2188.000 |
2018.000 |
1766.000 |
|
|
|
|
|
|
|
|
|
Add |
PREVIOUS
YEARS’ BALANCE BROUGHT FORWARD |
|
|
|
|
|
|
-
From Previous Year |
|
6276.000 |
|
|
|
|
-
By Amalgamating Companies |
8214.000 |
2075.000 |
6071.000 |
|
|
|
|
|
|
|
|
|
|
Write-back of
previous year dividend (excess provision |
30.000 |
0.000 |
0.000 |
|
|
|
|
|
|
|
|
|
Less |
APPROPRIATIONS |
|
|
|
|
|
|
|
Transfer to general reserve |
1050.000 |
1040.000 |
790.000 |
|
|
|
Proposed Dividend |
933.000 |
959.000 |
663.000 |
|
|
|
Tax on Dividend |
634.000 |
156.000 |
108.000 |
|
|
|
Proposed special dividend |
2800.000 |
0.000 |
0.000 |
|
|
BALANCE CARRIED
TO THE B/S |
5015.000 |
8214.000 |
6276.000 |
|
|
|
|
|
|
|
|
|
|
EARNINGS IN
FOREIGN CURRENCY |
|
|
|
|
|
|
|
Export of goods (FOB basis) |
593.000 |
444.000 |
20.000 |
|
|
|
Reimbursement of expenses |
43.000 |
50.000 |
0.000 |
|
|
|
Service income |
260.000 |
215.000 |
0.000 |
|
|
|
Others |
11.000 |
13.000 |
15.000 |
|
|
TOTAL EARNINGS |
907.000 |
722.000 |
35.000 |
|
|
|
|
|
|
|
|
|
|
IMPORTS |
|
|
|
|
|
|
|
Raw Materials |
2722.000 |
2933.000 |
1042.000 |
|
|
|
Components and Spare Parts |
12.000 |
58.000 |
0.000 |
|
|
|
Capital Goods |
78.000 |
50.000 |
21.000 |
|
|
TOTAL IMPORTS |
2812.000 |
3041.000 |
1063.000 |
|
|
|
|
|
|
|
|
|
|
Earnings /
(Loss) Per Share (Rs.) |
46.49 |
42.08 |
47.94 |
|
QUARTERLY RESULTS
|
PARTICULARS |
30.06.2013 |
|
|
|
|
Net Sales |
5736.400 |
|
Total Expenditure |
5246.300 |
|
PBIDT (Excl OI) |
490.100 |
|
Other Income |
101.700 |
|
Operating Profit |
591.800 |
|
Interest |
3.700 |
|
Exceptional Items |
0.000 |
|
PBDT |
588.100 |
|
Depreciation |
97.800 |
|
Profit Before Tax |
490.300 |
|
Tax |
142.200 |
|
Provisions and contingencies |
0.000 |
|
Profit After Tax |
348.100 |
|
Extraordinary Items |
0.000 |
|
Prior Period Expenses |
0.000 |
|
Other Adjustments |
0.000 |
|
Net Profit |
348.100 |
KEY RATIOS
|
PARTICULARS |
|
31.03.2013 |
31.03.2012 |
31.03.2011 |
|
PAT / Total Income |
(%) |
9.23
|
9.61
|
14.77 |
|
|
|
|
|
|
|
Net Profit Margin (PBT/Sales) |
(%) |
12.80
|
12.68
|
20.05 |
|
|
|
|
|
|
|
Return on Total Assets (PBT/Total Assets} |
(%) |
14.46
|
11.69
|
14.80 |
|
|
|
|
|
|
|
Return on Investment (ROI) (PBT/Networth) |
|
0.25
|
0.17
|
0.20 |
|
|
|
|
|
|
|
Debt Equity Ratio (Total Debt/Networth) |
|
0.00
|
0.00
|
0.00 |
|
|
|
|
|
|
|
Current Ratio (Current Asset/Current Liability) |
|
1.33
|
2.39
|
3.42 |
FINANCIAL ANALYSIS
[all figures are
in Rupees Millions]
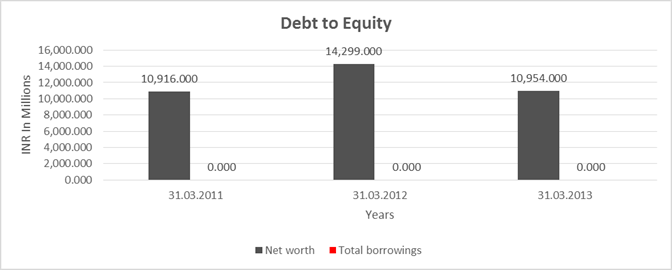
DEBT EQUITY RATIO
|
Particular |
31.03.2011 |
31.03.2012 |
31.03.2013 |
|
|
(Rs.
In Millions) |
(Rs.
In Millions) |
(Rs.
In Millions) |
|
Share Capital |
368.000 |
368.000 |
368.000 |
|
Reserves & Surplus |
10548.000 |
13931.000 |
10586.000 |
|
Net worth |
10,916.000 |
14,299.000 |
10,954.000 |
|
|
|
|
|
|
long-term borrowings |
0.000 |
0.000 |
0.000 |
|
Short term borrowings |
0.000 |
0.000 |
0.000 |
|
Total
borrowings |
0.000 |
0.000 |
0.000 |
|
Debt/Equity
ratio |
0.000 |
0.000 |
0.000 |
YEAR-ON-YEAR GROWTH
|
Year
on Year Growth |
31.03.2011 |
31.03.2012 |
31.03.2013 |
|
|
(Rs.
In Millions) |
(Rs.
In Millions) |
(Rs.
In Millions) |
|
Sales |
10876.000 |
19425.000 |
21797.000 |
|
|
|
78.604 |
12.211 |

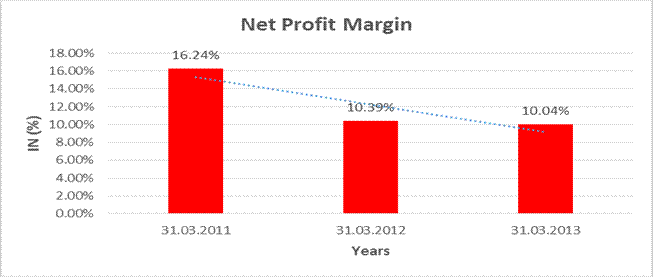
NET PROFIT MARGIN
|
Net
Profit Margin |
31.03.2011 |
31.03.2012 |
31.03.2013 |
|
|
(Rs.
In Millions) |
(Rs.
In Millions) |
(Rs.
In Millions) |
|
Sales |
10876.000 |
19425.000 |
21797.000 |
|
Profit |
1766.000 |
2018.000 |
2188.000 |
|
|
16.24% |
10.39% |
10.04% |
LOCAL AGENCY FURTHER INFORMATION
|
Sr. No. |
Check List by
Info Agents |
Available in
Report (Yes / No) |
|
1] |
Year of Establishment |
Yes |
|
2] |
Locality of the firm |
Yes |
|
3] |
Constitutions of the firm |
Yes |
|
4] |
Premises details |
No |
|
5] |
Type of Business |
Yes |
|
6] |
Line of Business |
Yes |
|
7] |
Promoter's background |
No |
|
8] |
No. of employees |
No |
|
9] |
Name of person contacted |
Yes |
|
10] |
Designation of contact person |
Yes |
|
11] |
Turnover of firm for last three years |
Yes |
|
12] |
Profitability for last three years |
Yes |
|
13] |
Reasons for variation <> 20% |
-- |
|
14] |
Estimation for coming financial year |
No |
|
15] |
Capital in the business |
Yes |
|
16] |
Details of sister concerns |
Yes |
|
17] |
Major suppliers |
No |
|
18] |
Major customers |
No |
|
19] |
Payments terms |
No |
|
20] |
Export / Import details (if applicable) |
No |
|
21] |
Market information |
-- |
|
22] |
Litigations that the firm / promoter involved in |
Yes |
|
23] |
Banking Details |
Yes |
|
24] |
Banking facility details |
No |
|
25] |
Conduct of the banking account |
-- |
|
26] |
Buyer visit details |
-- |
|
27] |
Financials, if provided |
Yes |
|
28] |
Incorporation details, if applicable |
Yes |
|
29] |
Last accounts filed at ROC |
Yes |
|
30] |
Major Shareholders, if available |
No |
|
31] |
PAN of Proprietor/Partner/Director, if available |
No |
|
32] |
Date
of Birth of Proprietor/Partner/Director, if available |
No |
|
33] |
Voter ID No of Proprietor/Partner/Director, if available |
No |
|
34] |
External Agency Rating, if available |
Yes |
LITIGATION DETAILS
CALCUTTA HIGH COURT
CASE STATUS INFORMATION SYSTEM
|
Case Status : Pending |
||||
|
|
||||
|
Status of CIVIL SUITS (CS) 291 of 2012 RELIANCE COMMUNICATIONS LIMITED |
||||
|
|
||||
|
Vs. AKZO NOBEL INDIA LIMITED |
||||
|
|
||||
|
Pet's Adv. : RAJIV LALL |
||||
|
|
||||
|
Res's Adv. : |
||||
|
Court No. : 42 Last Listed On : Wednesday, May 14, 2014 |
||||
|
0 |
||||
|
|
||||
|
Case Updated on: Wednesday, May 07,2014 |
BUSINESS
ENVIRONMENT
GDP growth in fiscal year 2012-13 is estimated at around 5% (previous
year 6.2%). The overall slowdown in the economy was visible and reflected in
the low growth of just around 1% in the Index of Industrial Production (IIP)
for the year 2012-13.
During the financial year 2012-13, most of the markets the Company
operates in were impacted by the volatility in the macroeconomic environment.
Overall revenue growth in line with market could still be achieved, thanks to
the Company’s customer-centric approach, its ability to innovate and strong
internal processes.
FINANCE AND
ACCOUNTS
Revenue for the year at Rs 22320.000 Millions is 12% ahead of previous
year, with contribution from all segments. Profit after tax for the year at Rs
2188.000 Millions is higher than previous year by 8%.
Keeping in view the current year’s performance, the Board is pleased to
recommend a dividend of Rs 20 per share for the financial year 2012-13
(previous year Rs 20 per share).
In addition, the Board has, after taking into account the fund
requirements of the Company to support growth and other relevant factors, also
recommended a Special Dividend of Rs 60 per share for approval of the members
at the forthcoming Annual General Meeting.
A sum of Rs 1.9.000 millions was remitted to the Investor Education and
Protection Fund of the Central Government towards Dividend remaining unclaimed
in respect of the financial year ended 31 March 2005, in terms of section 205C
of the Companies Act, 1956.
The Company has not accepted any public deposits during the year and no
amount on account of principal or interest on public deposits was outstanding
as on the date of the balance sheet.
MANAGEMENT
DISCUSSION AND ANALYSIS
COATINGS
Coatings segment recorded a turnover of Rs 23269.000 Millions, compared
to the previous year’s Rs 20297.000 Millions, a growth of 15%. Segment profit
grew 17% to reach Rs 1644.000 Millions vs previous year’s Rs 1403.000 Millions.
General slow-down in demand resulted in lower growth; INR depreciation and cost
pressures were countered with effective cost management. Nevertheless, investment in strengthening the
brands, developing new markets, capability building and capacity expansion were
continued to support growth plans.
Decorative Paints
The topline growth in the business was in line with the industry. Some
of the initiatives which supported the growth were:
· New brand campaigns
· Expansion of Dulux decorative centres (Modern Retail stores) to provide one stop painting solutions in state-of-the-art ambience.
· Launch of new water-based wood care range.
Work on the Greenfield site at Gwalior, Madhya Pradesh is in progress
for commissioning during the fiscal year 2013-14.
PERFORMANCE
COATINGS
Automotive and
Aerospace Coatings (A and AC) business was impacted by subdued growth in the
passenger car segment, partially offset by modest growth in the commercial
vehicles segment. Focus on end user service and margin management helped the
business to overcome adverse economic conditions. Business is also actively
pursuing its efforts to expand its footprint through certification/referrals
from the automotive OEs.
Marine Coatings business segment
focusses on coatings solutions for ships, trawlers, supply vessels and coastal
fishing boats. The business provides comprehensive coatings solutions to new
ship construction as well as maintenance and repair.
The business is battling a general slowdown in the shipping industry
with pressures on both volumes and prices. A series of initiatives have been
planned to expand into new segments to support growth as well as de-risking.
Protective
Coatings business provides coatings and solutions to segments like il and gas,
public infrastructure projects such as airports and stadia, power generation
(thermal and wind energy), mining and minerals and original equipment
manufacturers, etc.
Overall market for protective coatings declined mainly because of delays
affecting new project launches. The business has identified new areas for
generating demand in an otherwise depressed market, with a complete customer
focussed solutions offer.
Coil Coatings business had a
good growth momentum and the business was able to implement several new
initiatives to improve its market position. The year saw new product launches
and better price realisation in select product lines.
Powder Coating business topline
growth was in line with the industry. Business is addressing supply constraints
and is evaluating options for capacity additions.
A new range of products under the Wood Finish and Adhesives banner were
launched during the year.
CHEMICALS
This segment consisting of Functional Chemicals and Surface Chemistry
businesses recorded a turnover of Rs 940.000 Millions compared to the previous
year’s Rs 873 million, a growth of 8%. Segment profit was Rs 144.000 Millions
vs previous year’s Rs 122.000 millions, a growth of 18% due to improved product
mix. Though Functional Chemicals Business saw some slowdown, Surface Chemistry
Business recorded robust growth during the year, on the back of strong demand
in Personal Care and Agrochemical segments.
Going forward, the Company will
continue to closely monitor the global trends in the availability and price
movements of all key inputs and shall strive to safeguard their supply lines.
Cost reduction and value enhancement projects are also being pursued to counter
inflation/ensure supply security. However, volatility in currency exchange
rates could negate the effects of some of the above actions and put pressure on
margins. The Company follows a Risk Management policy under which all material
foreign currency exposures are hedged through forward covers, to protect
against unexpected swings in exchange rates.
Notwithstanding the constraints, the Company will continue to stay
focussed on growing ahead of the market, with emphasis on serving its consumers
through superior technical inputs and solutions and continuous efforts to
expand its footprint in areas of its strength.
CONTINGENT LIABILITIES:
|
Particulars |
31.03.2013 [Rs. in millions] |
31.03.2012 [Rs. in millions] |
|
Claims against the Company not acknowledged as debt |
50.000 |
50.000 |
|
Sales tax matters under appeal |
215.000 |
123.000 |
|
Excise matters in dispute/under appeal |
88.000 |
88.000 |
|
Industrial relations and other matters under dispute |
2.000 |
2.000 |
|
Bank guarantees (third parties, etc) |
-- |
91.000 |
|
(f) Income tax matters in dispute/under appeal* *The Income tax assessments for the Company have been completed up to
the financial year ended 31 March 2010. Arising from such assessments and
appellate orders, the demands aggregate Rs 1166.000 millions (2011-12: Rs
1675.000 millions), and the refunds aggregate Rs 1,186 million (2011-12: Rs
1296.000 millions). The Company as well as the Income tax department have
filed appeals on these matters. Pending decisions in the appeals, neither the
refunds nor the liabilities for the demands have been recognised in the
accounts. The Company, based on its assessment of such cases, is of the view
that the final outcome is not likely to have significant adverse impact on
the financial statements. |
||
INDEX OF CHARGES
|
S.NO. |
CHARGE ID |
DATE OF CHARGE CREATION/MODIFICATION
|
CHARGE AMOUNT
SECURED |
CHARGE HOLDER |
ADDRESS |
SERVICE REQUEST
NUMBER (SRN) |
|
1 |
90192325 |
09/11/2001 * |
32,000,000.00 |
THE HONGKONG AND SHANGHAI BANKING CORPORATION LIMITED |
MANIPAL CENTRE, DICKENSON ROAD, BANGALORE, KARNATAKA - 560042, INDIA |
- |
|
2 |
90199062 |
04/01/2002 * |
71,000,000.00 |
DEUTSCHE BANK AG |
BANGALORE BRANCH, RAHEJA TOWER; NO.26-27; M.G. ROAD, BANGALORE, KARNATAKA, INDIA |
- |
|
3 |
90197288 |
04/01/2002 * |
710,000,000.00 |
DEUTSCHE BANK |
BANGALORE BRANCH M.G. ROAD, BANGALORE, KARNATAKA - 560001, INDIA |
- |
* Date of charge modification
FINANCIAL RESULTS FOR THE QUARTER AND YEAR ENDED 31 MARCH, 2014
(Rs. In Millions)
|
Particulars |
Quarter Ended on
|
Year Ended |
|
|
|
31.03.2014 |
31.12.2013 |
31.03.2014 |
|
|
(Unaudited) |
(Unaudited) |
(Unaudited) |
|
|
|
|
|
|
Net Sales/ Income from Operations |
6012.800 |
6439.300 |
23717.100 |
|
Other Operating Income |
103.400 |
123.700 |
462.000 |
|
Total |
6116.200 |
6563.000 |
24179.100 |
|
|
|
|
|
|
Expenditure |
|
|
|
|
Cost of materials consumed |
3007.300 |
2922.100 |
11726.500 |
|
Purchase of Stock in trade |
732.400 |
361.00 |
2204.100 |
|
Changes in inventories of Finished Goods, Work in Progress and Stock in Trade |
(287.400) |
5570.400 |
(146.100) |
|
Employee Benefits Expense |
463.500 |
487.500 |
1938.900 |
|
Depreciation/ Amortisation Expense |
116.700 |
118.800 |
436.700 |
|
Other Expenditure |
1567.200 |
1803.100 |
6537.500 |
|
Total |
5599.700 |
6262.900 |
22697.600 |
|
Profit from operations before other income,
Interest and Exceptional Item |
516.500 |
300.100 |
1481.500 |
|
Other Income |
225.500 |
43.200 |
566.900 |
|
Profit before Interest and Exceptional Items
|
742.000 |
343.300 |
2048.400 |
|
Finance Costs |
1.800 |
3.800 |
14.700 |
|
Profit/ Loss from ordinary Activities before
tax |
740.200 |
339.500 |
2033.700 |
|
Tax Expenses |
193.500 |
69.400 |
531.500 |
|
Net Profit/ Loss from ordinary Activities
after tax (9-10) |
546.700 |
270.100 |
1502.200 |
|
Paid-up Equity Shares Capital (Face Value of Rs. 10/- each) |
466.600 |
466.600 |
466.600 |
|
. Reserves excluding Revaluation Reserve as
per balance sheet of previous accounting year) |
|
|
12090.900 |
|
Basic and Diluted Earning per share |
11.72 |
5.79 |
32.18 |
|
|
|
|
|
|
Public shareholding |
|
|
|
|
- Number of Shares |
12615979 |
12615979 |
12615979 |
|
- Percentage of shareholding |
27.04% |
27.04% |
27.04% |
|
|
|
|
|
|
Promoters and promoter group shareholding |
|
|
|
|
a) Pledged/ Encumbered |
|
|
|
|
- Number of shares |
-- |
-- |
-- |
|
- Percentage of Share (as a % of the total
shareholding of promoter and promoter group) |
-- |
-- |
-- |
|
- Percentage of share (as a % of the total
share capital of the company) |
-- |
-- |
-- |
|
|
|
|
|
|
b) Non-encumbered |
|
|
|
|
- Number of shares |
34044335 |
34044335 |
34044335 |
|
- Percentage of Share (as a % of the total shareholding
of promoter and promoter group) |
100% |
100% |
100% |
|
- Percentage of share (as a % of the total
share capital of the company) |
72.96% |
72.96% |
72.96% |
|
|
|
|
|
|
INVESTOR COMPLAINTS |
|
|
|
|
Pending at the beginning of the quarter |
-- |
|
|
|
Received during the quarter |
1 |
|
|
|
disposed of during the quarter |
1 |
|
|
|
Remaining unresolved at the end of the quarter |
-- |
|
|
STATEMENT OF ASSETS
AND LIABILITIES
(Rs. In Millions)
|
Particulars |
As at 31.03.2014 |
|
|
|
Particulars |
|
|
A |
EQUITY AND LIABILITIES |
|
|
1 |
Shareholder’s Funds |
|
|
|
a) Share Capital |
466.600 |
|
|
b) Reserves & Surplus |
8010.900 |
|
|
Sub Total- Shareholders funds |
8477.500 |
|
2 |
Non-current liabilities |
|
|
|
(a) Deferred
tax liabilities (Net) |
120.600 |
|
|
(b) Other long term liabilities |
143.000 |
|
|
fc) Long term provisions |
674.400 |
|
|
Sub Total- Non Current Liabilities |
938.000 |
|
3 |
Current liabilities |
|
|
|
(a) Trade Payables |
4926.500 |
|
|
(b) Other current liabilities |
1174.700 |
|
|
(c) Short term provisions |
4872.200 |
|
|
Sub Total- Current Liabilities |
10973.400 |
|
|
|
|
|
|
TOTAL-EQUITY AND LIABILITIES |
|
|
B |
ASSETS |
|
|
1 |
Non-current assets |
|
|
|
(a) Fixed assets |
5331.300 |
|
|
(b) Non-current
Investments |
499.900 |
|
|
(b) Long term loans and advances |
1032.200 |
|
|
(c) Other Non-current
assets |
18.000 |
|
|
Sub-Total- Non current assets |
6881.400 |
|
2 |
Current assets |
|
|
|
a) Current Investments |
5786.300 |
|
|
b) Inventories |
3242.100 |
|
|
c) Trade Receivables |
3075.500 |
|
|
d) Cash and cash equivalents |
722.100 |
|
|
(e) Short term loans and advances |
513.500 |
|
|
(f) Other current assets |
168.000 |
|
|
Sub-Total- current assets |
13507.500 |
|
|
TOTAL ASSETS |
20388.900 |
SEGMENT WISE REVENUE, RESULTS AND CAPITAL EMPLOYED
(RS. IN MILLIONS)
|
Particulars |
Quarter Ended on
|
Year Ended |
|
|
|
31.03.2014 |
31.12.2013 |
31.03.2014 |
|
|
(Unaudited) |
(Unaudited) |
(Unaudited) |
|
|
|
|
|
|
1. Segment Revenue (Net Sale/ Income from) |
|
|
|
|
-
Coating |
5864.000 |
6345.700 |
23242.900 |
|
-
Other |
252.200 |
217.300 |
936.200 |
|
Total |
6116.200 |
6563.000 |
24179.100 |
|
Net / Income from Operation |
|
|
|
|
|
|
|
|
|
2. Segment Results (profit before tax and Interests) |
|
|
|
|
-
Coating |
490.000 |
318.700 |
1472.900 |
|
-
Other |
28.300 |
3.200 |
103.000 |
|
Total |
518.300 |
321.900 |
1575.900 |
|
|
|
|
|
|
Finance Cost |
1.800 |
3.800 |
14.700 |
|
Other Unallocated Income /(Expenditure) |
223.700 |
21.400 |
472.500 |
|
|
|
|
|
|
Total Profit before Tax |
740.200 |
339.500 |
2033.700 |
|
|
|
|
|
|
3. Capital Employed |
|
|
|
|
(Segment Assets – Segment Liabilities) |
|
|
|
|
-
Coating |
-- |
5941.600 |
665.200 |
|
-
Other |
-- |
626.800 |
644.900 |
|
Unallocated |
-- |
5439.200 |
1167.400 |
|
Total Capital Employed in Segment |
-- |
12007.600 |
8477.500 |
NOTE:
1. The above results have been approved Audit Committee and the Board of Directors at their meetings held on 16 May 2014.
2. The Statutory Auditors of the Company have audited the financial results for the year ended 31 March 2014. The figures for the quarter ended 31 March 2014, as reported in these financial results, are the balancing figures between audited figures in respect of the full financial year and the published year to date figures up to the end of the third quarter of the relevant financial year An unqualified report has been Issued and the same 1s being filed with the Bombay and National Stock Exchanges.
3. Other expenses for the current quarter include a reversal of Rs 71.000 Million which was charged to the financial results for the quarter ended 31 December 2013 in respect of certain services received during the calendar year 2013. On the basis of agreement with the service provider, the charge for 2013 has been reversed in the current quarter. This does not impact the financial results for the year.
4. The Board of Director has recommended a dividend of Rs.15.00 per share for the ended 31st March 2014 (previous year Rs.20.00 per share). In addition, the Board has also recommended special dividend of Rs.60.00 per share (previous year Rs.60.00 per share). The dividend will be paid after the approval of the shareholders at the forthcoming Annual General Meeting.
5.
Previous year/ period figures have been
regrouped/ reclassified, wherever necessary, to make them comparable to the
current year/ period figures.
FIXED ASSETS:
Ø Land Leasehold
Ø Land Freehold
Ø Buildings
Ø Plant and
Machinery
Ø Plant and
Machinery – Under Operating Lease
Ø Rolling Stock,
Motor Vehicles etc.
Ø Furniture,
fittings and equipment
Ø Data processing equipment
Ø Office equipments
Ø Leasehold
improvement
AS PER WEBSITE
PRESS RELEASES
AKZONOBEL INDIA
COMPLETES SIXTY YEARS
16 May 2014
Rewards shareholders with a special dividend of 60 rupees per share plus a normal dividend of 15 rupees per share
Performance
Highlights
Q4 FY 2013-2014
Revenue grew 13% to 6120.000 Millions rupees
Profit from operations rose 30% to 520.000 Millions rupees
Today, the Board of Directors of Akzo Nobel India Limited approved the audited financial results of the company for the financial year ended March 31, 2014.
The board has recommended a dividend of 15 rupees per share along with a special dividend of 60 rupees per share; which still leaves adequate surplus cash to support the future growth plans of the company.
Business
performance highlights
AkzoNobel India Limited (Q4 FY 2013-14)
· Total revenue from operations is at Rs.6120.000 Millions as compared to Rs.5400.000 Millions rupees of the corresponding quarter of the previous year.
· Profit from operations is at Rs.520.000 Millions rupees as compared to Rs.400.000 Millions of the corresponding quarter of the previous year.
· Profit after tax (PAT) is at Rs.550.000 Millions rupees as compared to 620.000 Millions rupees of the corresponding quarter of the previous year.
AkzoNobel India
Limited (FY 2013-14)
· Total revenue from operations is at Rs.24180.000 Millions as compared to Rs.22320.000 Millions of the previous year.
· Profit from operations is at Rs.1480.000 Millions as compared to 1500.000 Millions of the previous year, impacted by rupee depreciation.
· Profit after tax (PAT) is at Rs.1500.000 Millions as compared to Rs.2190.000 Millions of the previous year, due to reduction in Investment Income following last year’s special dividend and one-off interest on tax refunds.
Comments:
Nihal Kaviratne, CBE,
Chairman, AkzoNobel India:
“AkzoNobel India has just completed 60 years of service to its customers. And, in this spirit of celebration, I am delighted to announce that the Board has recommended a special dividend of 60 rupees per share, over and above the normal dividend of 15 rupees per share. Our cash reserves remain strong and robust, allowing us to reward our shareholders. I continue to be thankful to them for their ongoing support and encouragement.”
Jayakumar
Krishnaswamy, Managing Director, AkzoNobel India:
“Despite tough market conditions in FY 2013-14, it is gratifying to see the company recording a revenue growth of 9%. After absorbing cost pressures due to rupee depreciation, particularly in mid-2013, and continuing investment in brands and capability building, the operating profit has been sustained at previous year’s level. PAT for the full year however declined mainly due to drop in investment income and one-off items included in the previous year.”
“We have also commissioned a factory at Gwalior, manufacturing water-borne decorative paints. Established at an investment of 140 crore rupees, this factory has enhanced our company’s production capacity by 30%.”
“One of our products (Dulux Superclean), launched last year has been accorded the status of ‘Product of the year 2014’. Innovation and sustainability continue to underline all our efforts in AkzoNobel India.”
CMT REPORT (Corruption, Money Laundering & Terrorism]
The Public Notice information has been collected from various sources
including but not limited to: The Courts,
1] INFORMATION ON
DESIGNATED PARTY
No exist designating subject or any of its beneficial owners,
controlling shareholders or senior officers as terrorist or terrorist
organization or whom notice had been received that all financial transactions
involving their assets have been blocked or convicted, found guilty or against
whom a judgement or order had been entered in a proceedings for violating
money-laundering, anti-corruption or bribery or international economic or
anti-terrorism sanction laws or whose assets were seized, blocked, frozen or
ordered forfeited for violation of money laundering or international
anti-terrorism laws.
2] Court Declaration :
No exist to suggest that subject is or was
the subject of any formal or informal allegations, prosecutions or other official
proceeding for making any prohibited payments or other improper payments to
government officials for engaging in prohibited transactions or with designated
parties.
3] Asset Declaration :
No records exist to suggest that the property or assets of the subject
are derived from criminal conduct or a prohibited transaction.
4] Record on Financial
Crime :
Charges or conviction
registered against subject: None
5] Records on Violation of
Anti-Corruption Laws :
Charges or investigation
registered against subject: None
6] Records on Int’l
Anti-Money Laundering Laws/Standards :
Charges or
investigation registered against subject: None
7] Criminal Records
No
available information exist that suggest that subject or any of its principals
have been formally charged or convicted by a competent governmental authority
for any financial crime or under any formal investigation by a competent
government authority for any violation of anti-corruption laws or international
anti-money laundering laws or standard.
8] Affiliation with
Government :
No record
exists to suggest that any director or indirect owners, controlling
shareholders, director, officer or employee of the company is a government
official or a family member or close business associate of a Government
official.
9] Compensation Package :
Our market
survey revealed that the amount of compensation sought by the subject is fair
and reasonable and comparable to compensation paid to others for similar
services.
10] Press Report :
No press reports / filings exists on
the subject.
CORPORATE GOVERNANCE
MIRA INFORM as part of its Due Diligence do provide comments on
Corporate Governance to identify management and governance. These factors often
have been predictive and in some cases have created vulnerabilities to credit
deterioration.
Our Governance Assessment focuses principally on the interactions
between a company’s management, its Board of Directors, Shareholders and other
financial stakeholders.
CONTRAVENTION
Subject is not known to have contravened any existing local laws,
regulations or policies that prohibit, restrict or otherwise affect the terms
and conditions that could be included in the agreement with the subject.
FOREIGN EXCHANGE RATES
|
Currency |
Unit
|
Indian Rupees |
|
US Dollar |
1 |
Rs.58.48 |
|
|
1 |
Rs.98.67 |
|
Euro |
1 |
Rs.79.81 |
INFORMATION DETAILS
|
Information
Gathered by : |
NYA |
|
|
|
|
Analysis Done by
: |
KAR |
|
|
|
|
Report Prepared
by : |
NTH |
SCORE & RATING EXPLANATIONS
|
SCORE FACTORS |
RANGE |
POINTS |
|
HISTORY |
1~10 |
7 |
|
PAID-UP CAPITAL |
1~10 |
7 |
|
OPERATING SCALE |
1~10 |
7 |
|
FINANCIAL CONDITION |
|
|
|
--BUSINESS SCALE |
1~10 |
7 |
|
--PROFITABILIRY |
1~10 |
7 |
|
--LIQUIDITY |
1~10 |
7 |
|
--LEVERAGE |
1~10 |
7 |
|
--RESERVES |
1~10 |
8 |
|
--CREDIT LINES |
1~10 |
7 |
|
--MARGINS |
-5~5 |
- |
|
DEMERIT POINTS |
|
|
|
--BANK CHARGES |
YES/NO |
YES |
|
--LITIGATION |
YES/NO |
YES |
|
--OTHER ADVERSE INFORMATION |
YES/NO |
NO |
|
MERIT POINTS |
|
|
|
--SOLE DISTRIBUTORSHIP |
YES/NO |
NO |
|
--EXPORT ACTIVITIES |
YES/NO |
NO |
|
--AFFILIATION |
YES/NO |
YES |
|
--LISTED |
YES/NO |
YES |
|
--OTHER MERIT FACTORS |
YES/NO |
YES |
|
DEFAULTERS |
|
|
|
--RBI |
YES/NO |
NO |
|
--EPF |
YES/NO |
NO |
|
TOTAL |
|
64 |
This score serves as a reference to assess SC’s credit risk
and to set the amount of credit to be extended. It is calculated from a
composite of weighted scores obtained from each of the major sections of this
report. The assessed factors and their relative weights (as indicated through
%) are as follows:
Financial
condition (40%) Ownership
background (20%) Payment
record (10%)
Credit history
(10%) Market trend
(10%) Operational
size (10%)
RATING EXPLANATIONS
|
RATING |
STATUS |
PROPOSED CREDIT LINE |
|
|
>86 |
Aaa |
Possesses an extremely sound financial base with the strongest
capability for timely payment of interest and principal sums |
Unlimited |
|
71-85 |
Aa |
Possesses adequate working capital. No caution needed for credit
transaction. It has above average (strong) capability for payment of interest
and principal sums |
Large |
|
56-70 |
A |
Financial & operational base are regarded healthy. General unfavourable
factors will not cause fatal effect. Satisfactory capability for payment of
interest and principal sums |
Fairly Large |
|
41-55 |
Ba |
Overall operation is considered normal. Capable to meet normal
commitments. |
Satisfactory |
|
26-40 |
B |
Capability to overcome financial difficulties seems comparatively
below average. |
Small |
|
11-25 |
Ca |
Adverse factors are apparent. Repayment of interest and principal sums
in default or expected to be in default upon maturity |
Limited with full
security |
|
<10 |
C |
Absolute credit risk exists. Caution needed to be exercised |
Credit not
recommended |
|
- |
NB |
New Business |
- |
This report is issued at your request without any
risk and responsibility on the part of MIRA INFORM PRIVATE LIMITED (MIPL) or
its officials.