MIRA
INFORM REPORT
|
Report Date : |
24.05.2014 |
IDENTIFICATION DETAILS
|
Name : |
THE |
|
|
|
|
Registered
Office : |
Neville House, J.N. Heredia Marg, Ballard Estate, Mumbai - 400001, |
|
|
|
|
Country : |
India |
|
|
|
|
Financials (as
on) : |
31.03.2013 |
|
|
|
|
Date of
Incorporation : |
23.08.1879 |
|
|
|
|
Com. Reg. No.: |
11-000037 |
|
|
|
|
Capital
Investment / Paid-up Capital : |
Rs. 413.100 millions |
|
|
|
|
CIN No.: [Company Identification
No.] |
L17120MH1879PLC000037 |
|
|
|
|
TAN No.: [Tax Deduction &
Collection Account No.] |
MUMT00159F/MUMT13249F |
|
|
|
|
PAN No.: [Permanent Account No.] |
AAACT2328K |
|
|
|
|
Legal Form : |
A Public Limited Liability Company. The Company’s Shares are Listed on
the Stock Exchanges. |
|
|
|
|
Line of Business
: |
Manufacturer of Cloth, Polyester Staple Fibre (PSF) and also in Real Estate Business. |
|
|
|
|
No. of Employees
: |
Not Divulged |
RATING & COMMENTS
|
MIRA’s Rating : |
Ba (48) |
|
RATING |
STATUS |
PROPOSED CREDIT LINE |
|
|
41-55 |
Ba |
Overall operation is considered normal. Capable to meet normal
commitments. |
Satisfactory |
|
Maximum Credit Limit : |
USD 67000000 |
|
|
|
|
Status : |
Satisfactory |
|
|
|
|
Payment Behaviour : |
Usually correct |
|
|
|
|
Litigation : |
Exist |
|
|
|
|
Comments : |
Subject is an established company having satsiafctory track record. General financial position of the company seems to be sound and
healthy. Profitability of the company is fair. Trade relations are fair. Business is active. Payment terms are
reported to be usually correct. Te company can be considered for business dealings at usual trade
terms and conditions. |
NOTES :
Any query related to this report can be made
on e-mail : infodept@mirainform.com
while quoting report number, name and date.
INDIAN ECONOMIC OVERVIEW
US investment bank
Goldman Sachs has upgraded its outlook on Indian markets as it expects
positive impact of the election cycle.
India’s economy may
grow 4.7 % in the current financial year, lower than the official estimate of 4.9
%, Fitch Rating said. The global rating agency expects the economy to pick up
in the next two financial years.
Global ratings
agency Standard & Poor said increasing focus by India Inc on lowering debt
is likely to improve their credit profiles.
Singapore (1.1
million Indian tourists in 2012), Thailand (one million), the United Arab
Emirates ().98 million) and Malaysia ().82 million) emerged as the preferred
holidays hotspots for Indians. The total figure is expected to increase to 1.93
million by 2017, according to the latest Eurmonitor international report.
There is a $29.34 bn
outward foreign direct investment by domestic companies between April and
January of 2013/14 which has seen some signs of recovery according to a Care
Ratings report.
There are 264 number
of new companies being set up every day on average during 2014. Most of them
are registered in Mumbai. India had 1.38 million registered companies at the
end of January, 2014.
Twitter like
messaging service Weibo Corporation has filed to raise $ 500 million via a US
initial public offering. Alibaba, which owns a stake in Weibo is expected to
raise about $ 15 billion New York this year in the highest profile Internet IPO
since Facebook’s in 2012.
Bharti Airtel has
raised Rs.2,453.2 crore (350 million Swiss Francs) by selling six-year bonds at
a coupon rate of three per cent and maturing in 2020. This is the largest ever
bond offering by an Indian company in Swiss Francs. Bharat Petroleum
Corporation raised 175 million Swiss Francs by selling five year bonds at 2.98
% coupon rate in February.
Indian Oil
Corporation plans to invest Rs 7650 crore in setting up a petrochemical complex
at its almost complete Paradip refinery in Odhisha in three to four years. The
company board is set to consider the setting up of a 700000 tonne per annum
polypropylene plant at an estimated cost at Rs.3150 crore.
Global chief
information officers at gathering in Bangalore in April to meet Indian startups
at an event called Tech50 Watchout for Little Eye Labs-Facebook type deals in
the making.
EXTERNAL AGENCY RATING
|
Rating Agency Name |
CARE |
|
Rating |
Long Term Bank Facilities=BBB (Withdrawn) |
|
Rating Explanation |
Moderate degree of safety and moderate
credit risk. |
|
Date |
31.12.2013 |
|
Rating Agency Name |
CARE |
|
Rating |
Short Term Non-Fund Based Limits=A3
(Withdrawn) |
|
Rating Explanation |
Moderate degree of safety and high credit
risk. |
|
Date |
31.12.2013 |
Reason For Withdrawn= Request of BDMCL
RBI DEFAULTERS’ LIST STATUS
Subject’s name is not enlisted as a defaulter
in the publicly available RBI Defaulters’ list.
EPF (Employee Provident Fund) DEFAULTERS’ LIST STATUS
Subject’s name is not enlisted as a defaulter
in the publicly available EPF (Employee Provident Fund) Defaulters’ list as of
31-03-2012.
INFORMATION DENIED BY
|
Name : |
Mr. Abhinandan |
|
Designation : |
Accounts Department |
|
Contact No.: |
91-22-22618071 |
|
Date : |
21.05.2014 |
LOCATIONS
|
Registered Office : |
Neville House, J.N. Heredia Marg, Ballard Estate, Mumbai – 400001, |
|
Tel. No.: |
91-22-66620000 /
22618071 / 4520 / 22693712 / 22655014 / 22657895 |
|
Mobile No.: |
91-9619198877 (Mr. Brajesh Sarda) |
|
Fax No.: |
91-22-22615622 /
22655014 / 22614520 / 22653530 |
|
E-Mail : |
|
|
Website : |
|
|
Area : |
70000 sq. ft. |
|
Location : |
Owned |
|
|
|
|
Administrative /
Corporate Office : |
C-1, Wadia International
Centre, Pandurang Budhkar Marg, Worli, Mumbai - 400025, |
|
|
|
|
Sales office: |
The Island City Center (ICC), GD Ambekar Marg, Dadar (East), Mumbai – 400014, Maharashtra, India |
|
Tel. No.: |
91-22-61912345 |
|
E-Mail : |
|
|
|
|
|
Factory 1 : |
Textile Processing Unit B-28, MIDC
Industrial Area, Ranjangaon, Taluka Shirur, District Pune - 412220, |
|
Tel. No.: |
91-21-38232700 /
38232800 |
|
Fax No.: |
91-21-38232600 |
|
|
|
|
Factory 2 : |
PSF Plant A-1, Patalganga
Industrial Area, District Raigad, Taluka Khalapur, |
|
Tel. No.: |
91-2192-251096 /
103 |
|
Fax No.: |
91-2192-250263 |
DIRECTORS
As on 31.03.2013
|
Name : |
Mr. Nusli N. Wadla |
|
Designation : |
Chairman |
|
|
|
|
Name : |
Mr. Keshub Mahindra |
|
Designation : |
Director |
|
Date of Birth/Age : |
89 Years |
|
|
|
|
Name : |
Mr. R. N. Tata |
|
Designation : |
Director |
|
|
|
|
Name : |
Mr. R. A. Shah |
|
Designation : |
Director |
|
Date of Birth/Age : |
81 Years |
|
|
|
|
Name : |
Mr. S. S. Kelkar |
|
Designation : |
Director |
|
Qualification : |
M. Com. |
|
Date of Appointment : |
09.10.1972 |
|
|
|
|
Name : |
Mr. S. Ragothaman |
|
Designation : |
Director |
|
Date of Birth/Age : |
67 Years |
|
|
|
|
Name : |
Mr. A. K. Hirjee |
|
Designation : |
Director |
|
|
|
|
Name : |
Mr. S. M. Palia |
|
Designation : |
Director |
|
Date of Birth/Age : |
75 Years |
|
|
|
|
Name : |
Ms. Vinita Bali |
|
Designation : |
Director |
|
Date of Birth/Age : |
57 Years |
|
Date of Appointment
: |
30.04.2009 |
|
|
|
|
Name : |
Mr. Ishaat Hussain |
|
Designation : |
Director |
|
Date of Birth/Age : |
65 Years |
|
Date of Appointment : |
01.06.2010 |
|
|
|
|
Name : |
Mr. Ness |
|
Designation : |
Joint Managing Director |
|
Date of Birth/Age : |
41 Years |
|
Qualification : |
M.S.C |
|
Date of Appointment : |
01.01.1994 |
|
|
|
|
Name : |
Mr. Jeh N. Wadia |
|
Designation : |
Director |
|
Date of Appointment : |
01.06.2010 |
|
|
|
|
Name : |
Mr. Durgesh Mehta |
|
Designation : |
Joint Managing Director and Chief Financial Officer |
|
Date of Appointment : |
01.04.2010 |
KEY EXECUTIVES
|
Name : |
J. C. Bham |
|
Designation : |
Company Secretary |
|
|
|
|
Name : |
Mr. Raghuraj Balakrishna |
|
Designation : |
Chief Financial Officer |
|
|
|
|
Name : |
Debashis Poddar |
|
Designation : |
Chief executive officers (Textiles) |
|
|
|
|
Name : |
Mr. Ashok Kaul |
|
Designation : |
Chief executive officers (Retail) |
|
|
|
|
Name : |
Mr. Suresh Khurana |
|
Designation : |
Chief executive officers (PSF) |
MAJOR SHAREHOLDERS / SHAREHOLDING PATTERN
As on 31.03.2014
|
Category of
Shareholder |
No. of Shares |
Percentage of
Holding |
|
(A) Shareholding of Promoter and Promoter Group |
|
|
|
|
|
|
|
Individuals / Hindu Undivided Family |
2085453 |
1.02 |
|
|
88297597 |
43.34 |
|
|
1983030 |
0.97 |
|
|
1983030 |
0.97 |
|
|
92366080 |
45.34 |
|
|
|
|
|
|
5222748 |
2.56 |
|
|
10533790 |
5.17 |
|
|
15756538 |
7.73 |
|
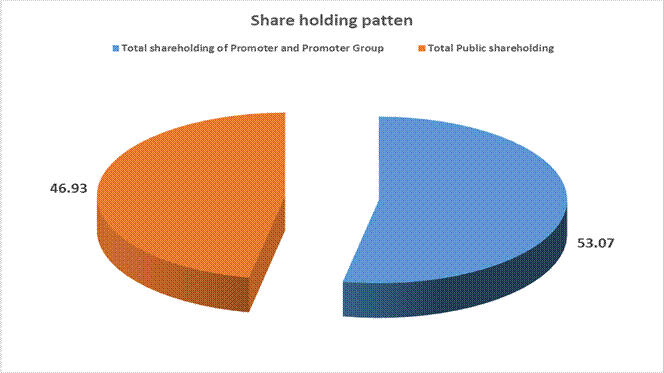
Total shareholding of Promoter and Promoter Group (A) |
108122618 |
53.07 |
|
(B) Public Shareholding |
|
|
|
|
|
|
|
|
15433984 |
7.58 |
|
|
428211 |
0.21 |
|
|
10483919 |
5.15 |
|
|
18173306 |
8.92 |
|
|
44519420 |
21.85 |
|
|
|
|
|
|
8705452 |
4.27 |
|
|
|
|
|
|
37465431 |
18.39 |
|
|
3650458 |
1.79 |
|
|
1269596 |
0.62 |
|
|
133010 |
0.07 |
|
|
1102720 |
0.54 |
|
|
18466 |
0.01 |
|
|
15400 |
0.01 |
|
|
51090937 |
25.08 |
|
Total Public shareholding (B) |
95610357 |
46.93 |
|
Total (A)+(B) |
203732975 |
100.00 |
|
(C) Shares held by Custodians and against which Depository
Receipts have been issued |
0 |
0.00 |
|
|
2725000 |
0.00 |
|
|
76925 |
0.00 |
|
|
2801925 |
0.00 |
|
Total (A)+(B)+(C) |
206534900 |
0.00 |
Shareholding of securities (including shares, warrants,
convertible securities) of persons belonging to the category Promoter and
Promoter Group
|
Category of Shareholder |
No. of Shares |
Percentage of
Holding |
|
Maureen Nusli Wadia Jtly With Nusli N Wadia |
1,80,180 |
0.09 |
|
Jehangir Nusli Wadia |
2,87,525 |
0.14 |
|
Ness Nusli Wadia |
11,51,918 |
0.56 |
|
Ness Nusli Wadia |
67,500 |
0.03 |
|
Maureen Nusli Wadia |
19,750 |
0.01 |
|
Maureen Nusli Wadia |
3,78,080 |
0.18 |
|
N N Wadia Admin Of Estate Of LT E F Dinshaw |
500 |
0.00 |
|
Bombay Burmah Trading Corporation Limited |
2,96,44,375 |
14.35 |
|
Jehreen Investments Limited |
53,00,500 |
2.57 |
|
Lochness Investments Limited |
27,60,000 |
1.34 |
|
Nowrosjee Wadia & Sons Limited |
55,86,070 |
2.70 |
|
N W Exports Limited |
2,77,71,550 |
13.45 |
|
National Peroxide Limited |
14,89,700 |
0.72 |
|
Wadia Investment Limited |
4,19,750 |
0.20 |
|
Macrofil Investment Limited |
4,09,700 |
0.20 |
|
Naperol Investments Limited |
4,06,200 |
0.20 |
|
DPI Products and Services Limited |
2,64,900 |
0.13 |
|
Wadia Techno Engineering Services Limited |
1,95,460 |
0.09 |
|
Lotus Viniyog Limited |
1,44,690 |
0.07 |
|
N W Exports Limited |
1,35,815 |
0.07 |
|
Havenkores Real Estates Private Limited |
1,22,640 |
0.06 |
|
Afco Industrial & Chemicals Limited |
59,660 |
0.03 |
|
Sunflower Investments and Textiles Private Limited |
1,35,59,037 |
6.57 |
|
Nessville Trading Private Limited |
24,550 |
0.01 |
|
Go Airlines India Private Limited |
1,000 |
0.00 |
|
Go Inv & Trading Private Limited |
500 |
0.00 |
|
Nidhivan INV & Trading Co Private Limited |
500 |
0.00 |
|
Heera Holding & Leasing Private Limited |
500 |
0.00 |
|
Sahara Investments Private Limited |
500 |
0.00 |
|
Nusli Neville Wadia ( Trust A/c) |
16,65,500 |
0.81 |
|
Nusli Neville Wadia ( Trust A/c) |
1,80,530 |
0.09 |
|
Nusli Neville Wadia ( Trust A/c) |
1,37,000 |
0.07 |
|
Diana Claire Wadia |
18,54,040 |
0.90 |
|
Nusli Wadia |
13,10,020 |
0.63 |
|
Estate of SMT Bachoobhai Woronzow |
8,14,030 |
0.39 |
|
Nusli Neville Wadia |
5,67,100 |
0.27 |
|
Dina Neville Wadia |
4,58,220 |
0.22 |
|
Elizabeth Anne Guhl |
1,69,688 |
0.08 |
|
Nusli Neville Wadia Jtly With Maureen N Wadia |
49,650 |
0.02 |
|
Ben Nevis Investments Limited |
1,02,83,790 |
4.98 |
|
Newpoint Enterprises Limited |
2,50,000 |
0.12 |
|
Total |
10,81,22,618 |
52.35 |
(*) The term encumbrance has the same meaning as assigned to
it in regulation 28(3) of the SAST Regulations, 2011.
Shareholding of securities (including shares, warrants,
convertible securities) of persons belonging to the category Public and holding
more than 1% of the total number of shares
|
Category of
Shareholder |
No. of Shares |
Percentage of
Holding |
|
Reliance Capital Trustee Company Limited A/c. Reliance
Growth Fund |
11297695 |
5.47 |
|
Life Insurance Corporation of India |
8281925 |
4.01 |
|
Government Pension Fund Global |
5526525 |
2.68 |
|
Morgan Stanley Asia (Singapore) Pte |
5863146 |
2.84 |
|
Oriental Insurance Company Limited |
2200244 |
1.07 |
|
Total |
33169535 |
16.06 |
Shareholding of securities (including shares, warrants, convertible
securities) of persons (together with PAC) belonging to the category “Public”
and holding more than 5% of the total number of shares of the company
|
Category of
Shareholder |
No. of Shares |
Percentage of
Holding |
|
Reliance Capital Trustee Company Limited |
11297695 |
5.47 |
|
Total |
11297695 |
5.47 |
Details of Locked-in Shares
|
Category of
Shareholder |
No. of Shares |
Percentage of
Holding |
|
Jehreen Investments Private. Limited |
38,00,000 |
1.84 |
|
Total |
38,00,000 |
1.84 |
BUSINESS DETAILS
|
Line of Business : |
Manufacturer of Cloth, Polyester Staple Fibre (PSF) and also in Real Estate Business. |
||||||||
|
|
|
||||||||
|
Products : |
|
GENERAL INFORMATION
|
No. of Employees : |
Not Available |
||||||||||||||||||||||||||||||
|
|
|
||||||||||||||||||||||||||||||
|
Bankers : |
· State Bank of India Axis Bank Limited IDBI Bank Limited State Bank of Hyderabad State Bank of Patiala Bank of India |
||||||||||||||||||||||||||||||
|
|
|
||||||||||||||||||||||||||||||
|
Facilities : |
|
||||||||||||||||||||||||||||||
|
|
|
|
Banking
Relations : |
-- |
|
|
|
|
Auditors : |
|
|
Name : |
Kalyaniwalla and Mistry Chartered Accountants |
|
Address : |
Kalpataru Heritage, 127, Mahatma Gandhi
Road, Mumbai – 400001, Maharashtra, India |
|
Tel. No.: |
91-22-61587200 |
|
Fax No.: |
91-22-22673964 |
|
|
|
|
Advocates and Solicitors : |
· Crawford Bayley and Company Karanjawala and Company Solomon and Company |
|
|
|
|
Associate Companies : |
· Archway Investment Company Limited Pentafil Textile Dealers Limited Scal Services Limited (upto 28.03.2012) Bombay Dyeing Real Estate Company Limited |
|
|
|
|
Co-venturer: |
Batra Group (Upto 27.03.2012) |
|
|
|
|
Joint Venture Companies: |
· PT.Five Star Textile Indonesia Proline India Limited (upto 27.03.2012) |
|
|
|
|
Entities
over which key management personnel and relatives exercise significant
influence : |
· Go Airlines (India) Limited The Bombay Burmah Trading Corporation Limited |
CAPITAL STRUCTURE
AS ON 31.03.2013
Authorised Capital :
|
No. of Shares |
Type |
Value |
Amount |
|
|
|
|
|
|
250000000 |
Equity Shares |
Rs. 2/- each |
Rs. 500.000 Millions |
|
|
|
|
|
Issued, Subscribed & Paid-up Capital :
|
No. of Shares |
Type |
Value |
Amount |
|
|
|
|
|
|
206534900 |
Equity Shares |
Rs. 2/- each |
Rs. 413.100
Millions |
|
|
|
|
|
(a) The Company had vide a postal ballot, whose results were declared on
18th October, 2012, approved the sub-division of each equity share of the
company having face value of Rs.10/ each fully paid into five equity shares of
the face value of Rs.2/- each fully paid up. The Authorised share capital of
the Company, was also sub divided into 250000000 Equity shares of Rs.2 each.
(b) Reconciliation of the shares outstanding at the beginning and at the
end of the reporting period
|
Equity shares |
31.03.2013 |
|
|
|
Numbers |
Rs. in Millions |
|
At the beginning of the period |
41306980 |
413.100 |
|
Add: Shares issued on exercise of warrants to promoters |
-- |
-- |
|
Add: Increase in number of shares on subdivision of shares from Rs.10 per share to Rs.2 per share |
165227920 |
-- |
|
Outstanding at the end of the period |
206534900 |
413.100 |
(c) Rights,
preferences and restrictions attached to Equity shares
The company has one class of equity shares having a par value of Rs.2 per
share. Each shareholder is eligible for one vote per share held. The dividend
proposed by the Board of Directors is subject to the approval of the
shareholders in the ensuing Annual General Meeting, except in case of interim
dividend. In the event of liquidation, the equity shareholders are eligible to
receive the remaining assets of the Company after distribution of all
preferential amounts, in proportion to their shareholding.
(d) Details of
shareholders holding more than 5% shares in the company
|
Equity shares |
31.03.2013 |
|
|
|
Numbers |
% holding |
|
The Bombay Burmah Trading Corporation Limited |
29644375 |
14.35 |
|
N.W. Exports Limited |
27771550 |
13.45 |
|
Jehreen Investments Limited |
12739725 |
6.17 |
|
Reliance Capital Trustee Company Limited |
11869785 |
5.75 |
|
|
82025435 |
39.72 |
(e) Shares
reserved for issue under options
Pursuant to the Employee Stock Option Scheme (ESOS) approved by the shareholders
on 13th August, 2002 and as further amended by the shareholders on 07th August,
2012, the Company has granted 14,000 options, (70,000 options post
sub-division) to the Joint Managing Director of the Company at an exercise
price of Rs. 528.25 (Rs.105.65 post sub-division) per share. As per the terms
of the ESOS, each option is excercisable for conversion into one equity share
of the Company
(f) Information regarding issue of shares during last five years
(i) No shares were allotted pursuant to contracts without payment being
received in cash.
(ii) No bonus shares have been issued.
(ii) No shares have been bought back.
(g) Shares held in Abeyance
Under orders from the Special Court (Trial of Offences relating to
Transactions in Securities) Act, 1992, - the allotment of 4,640 shares of face
value of Rs.2/- each (2011-12- 928 shares of face value of Rs.10/- each)
against warrants carrying rights of conversion into equity shares of the
Company has been kept in abeyance in accordance with section 206A of the
Companies Act, 1956, till such time as the title of the bonafide owner is
certified by the concerned Stock Exchanges.
(h) Shares allotted on exercise of warrants
In January, 2012, 760000 warrants were exercised for conversion into equity
shares as per the terms of the allotment of the warrants and 760000 equity
shares were allotted on 30th January, 2012 to a promoter group company. 1267000
warrants lapsed due to non-exercise of the conversion into equity shares and
the amount aggregating Rs.167.100 Millions was forfeited in terms of the SEBI
(DIP) Guidelines and conditions attached to the warrants. The forfeited amount
of Rs.167.100 Millions was credited to Capital Reserve.
FINANCIAL DATA
[all figures are
in Rupees Millions]
ABRIDGED BALANCE
SHEET
|
SOURCES OF FUNDS |
31.03.2013 |
31.03.2012 |
31.03.2011 |
|
I.
EQUITY
AND LIABILITIES |
|
|
|
|
(1)Shareholders' Funds |
|
|
|
|
(a) Share Capital |
413.100 |
413.100 |
405.400 |
|
(b) Reserves & Surplus |
16457.700 |
17510.900 |
10609.000 |
|
(c) Money
received against share warrants |
0.000 |
0.000 |
267.500 |
|
|
|
|
|
|
(2) Share Application money pending allotment |
0.000 |
0.000 |
0.000 |
|
Total
Shareholders’ Funds (1) + (2) |
16870.800 |
17924.000 |
11281.900 |
|
|
|
|
|
|
(3)
Non-Current Liabilities |
|
|
|
|
(a) long-term borrowings |
5596.400 |
5080.600 |
4978.600 |
|
(b) Deferred tax liabilities (Net) |
0.000 |
0.000 |
0.000 |
|
(c) Other long term liabilities |
26.900 |
12.300 |
11.700 |
|
(d) long-term provisions |
101.700 |
29.900 |
38.900 |
|
Total Non-current Liabilities (3) |
5725.000 |
5122.800 |
5029.200 |
|
|
|
|
|
|
(4) Current Liabilities |
|
|
|
|
(a) Short term borrowings |
4019.600 |
3038.300 |
3244.400 |
|
(b) Trade payables |
5865.300 |
3428.300 |
1885.800 |
|
(c) Other current
liabilities |
4944.700 |
6079.400 |
5101.100 |
|
(d) Short-term provisions |
285.600 |
288.200 |
214.100 |
|
Total Current Liabilities (4) |
15115.200 |
12834.200 |
10445.400 |
|
|
|
|
|
|
TOTAL |
37711.000 |
35881.000 |
26756.500 |
|
|
|
|
|
|
II.
ASSETS |
|
|
|
|
(1) Non-current assets |
|
|
|
|
(a) Fixed Assets |
|
|
|
|
(i) Tangible assets |
9027.100 |
9253.300 |
8924.400 |
|
(ii) Intangible Assets |
52.400 |
40.900 |
48.900 |
|
(iii) Capital
work-in-progress |
690.400 |
443.800 |
32.000 |
|
(iv) Incidental
expenditure relating to construction / development |
578.700 |
576.600 |
1933.200 |
|
(b) Non-current Investments |
559.600 |
559.600 |
601.900 |
|
(c) Deferred tax assets (net) |
0.000 |
0.000 |
0.000 |
|
(d) Long-term Loan and Advances |
614.800 |
528.200 |
682.900 |
|
(e) Other Non-current assets |
249.900 |
42.700 |
0.000 |
|
Total Non-Current Assets |
11772.900 |
11445.100 |
12223.300 |
|
|
|
|
|
|
(2) Current assets |
|
|
|
|
(a) Current investments |
0.000 |
0.000 |
0.000 |
|
(b) Inventories |
12859.900 |
15497.300 |
10317.200 |
|
(c) Trade receivables |
2168.000 |
1375.900 |
1198.500 |
|
(d) Cash and cash
equivalents |
425.500 |
333.100 |
210.200 |
|
(e) Short-term loans and
advances |
1610.100 |
1847.600 |
2072.500 |
|
(f) Other current assets |
8874.600 |
5382.000 |
734.800 |
|
Total Current Assets |
25938.100 |
24435.900 |
14533.200 |
|
|
|
|
|
|
TOTAL |
37711.000 |
35881.000 |
26756.500 |
PROFIT & LOSS
ACCOUNT
|
|
PARTICULARS |
31.03.2013 |
31.03.2012 |
31.03.2011 |
|
|
|
SALES |
|
|
|
|
|
|
|
Revenue from operations (net) |
23292.600 |
22308.100 |
18592.400 |
|
|
|
Other Income |
459.700 |
545.700 |
522.200 |
|
|
|
TOTAL (A) |
23752.300 |
22853.800 |
19114.600 |
|
|
|
|
|
|
|
|
Less |
EXPENSES |
|
|
|
|
|
|
|
Cost of materials
consumed |
11942.500 |
12645.000 |
11159.400 |
|
|
|
Purchases of
Stock-in-Trade |
1240.900 |
1181.400 |
965.600 |
|
|
|
Changes in inventories
of finished goods, work-in-progress and Stock-in-Trade |
1736.700 |
(6833.800) |
(8503.200) |
|
|
|
Employee benefits expense |
984.600 |
842.100 |
672.200 |
|
|
|
Other expenses |
4501.800 |
11851.000 |
12144.500 |
|
|
|
TOTAL (B) |
20406.500 |
19685.700 |
16438.500 |
|
|
|
|
|
|
|
|
Less |
PROFIT
BEFORE INTEREST, TAX, DEPRECIATION AND AMORTISATION (A-B) (C) |
3345.800 |
3168.100 |
2676.100 |
|
|
|
|
|
|
|
|
|
Less |
FINANCIAL
EXPENSES (D) |
1747.400 |
1805.700 |
1791.600 |
|
|
|
|
|
|
|
|
|
|
PROFIT
BEFORE TAX, DEPRECIATION AND AMORTISATION (C-D) (E) |
1598.400 |
1362.400 |
884.500 |
|
|
|
|
|
|
|
|
|
Less |
DEPRECIATION/
AMORTISATION (F) |
620.300 |
613.900 |
620.800 |
|
|
|
|
|
|
|
|
|
|
PROFIT BEFORE
TAX (E-F) (G) |
978.100 |
748.500 |
263.700 |
|
|
|
|
|
|
|
|
|
Less |
TAX (H) |
221.100 |
155.000 |
49.800 |
|
|
|
|
|
|
|
|
|
|
PROFIT AFTER TAX
(G-H) (I) |
757.000 |
593.500 |
213.900 |
|
|
|
|
|
|
|
|
|
Add |
PREVIOUS YEARS’
BALANCE BROUGHT FORWARD |
538.200 |
244.200 |
216.600 |
|
|
|
|
|
|
|
|
|
Less |
APPROPRIATIONS |
|
|
|
|
|
|
|
Proposed dividend |
206.600 |
206.600 |
141.900 |
|
|
|
Dividend Distribution Tax |
35.000 |
33.600 |
23.000 |
|
|
|
Transferred to General Reserve |
75.700 |
59.300 |
21.400 |
|
|
BALANCE CARRIED
TO THE B/S |
977.900 |
538.200 |
244.200 |
|
|
|
|
|
|
|
|
|
|
EARNINGS IN
FOREIGN CURRENCY |
|
|
|
|
|
|
|
Export of goods
calculated on FOB basis |
2655.200 |
2401.300 |
2490.000 |
|
|
|
Reimbursement of
insurance and freight on exports |
73.700 |
63.900 |
91.700 |
|
|
|
Sale of Flats |
0.700 |
0.000 |
360.800 |
|
|
|
Local sales for exports |
0.000 |
0.000 |
7.400 |
|
|
TOTAL EARNINGS |
2729.600 |
2465.200 |
2949.900 |
|
|
|
|
|
|
|
|
|
|
IMPORTS |
|
|
|
|
|
|
|
Raw Materials |
8509.100 |
8313.300 |
6204.400 |
|
|
|
Stores, spare parts & catalysts |
197.200 |
146.200 |
721.700 |
|
|
|
Capital Goods |
3.600 |
6.800 |
8.800 |
|
|
|
Construction material |
9.600 |
4.400 |
0.000 |
|
|
TOTAL IMPORTS |
8719.500 |
8470.700 |
6934.900 |
|
|
|
|
|
|
|
|
|
|
Earnings Per
Share (Rs.) |
3.67 |
2.92 |
5.54 |
|
KEY RATIOS
|
PARTICULARS |
|
31.03.2013 |
31.03.2012 |
31.03.2011 |
|
PAT / Total Income |
(%) |
3.19
|
2.60 |
1.12 |
|
|
|
|
|
|
|
Net Profit Margin (PBT/Sales) |
(%) |
4.20
|
3.36 |
1.42 |
|
|
|
|
|
|
|
Return on Total Assets (PBT/Total Assets} |
(%) |
2.73
|
2.18 |
1.09 |
|
|
|
|
|
|
|
Return on Investment (ROI) (PBT/Networth) |
|
0.06
|
0.04 |
0.02 |
|
|
|
|
|
|
|
Debt Equity Ratio (Total Debt/Networth) |
|
0.57
|
0.45 |
0.73 |
|
|
|
|
|
|
|
Current Ratio (Current Asset/Current Liability) |
|
1.72
|
1.90 |
1.39 |
FINANCIAL ANALYSIS
[all figures are
in Rupees Millions]
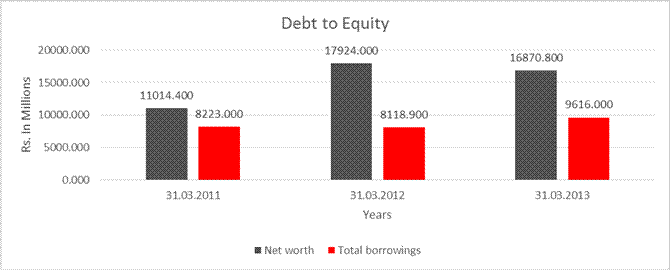
DEBT EQUITY RATIO
|
Particular |
31.03.2011 |
31.03.2012 |
31.03.2013 |
|
|
Rs. In
Millions |
Rs.
In Millions |
Rs.
In Millions |
|
Share Capital |
405.400 |
413.100 |
413.100 |
|
Reserves & Surplus |
10609.000 |
17510.900 |
16457.700 |
|
Net
worth |
11014.400 |
17924.000 |
16870.800 |
|
|
|
|
|
|
long-term borrowings |
4978.600 |
5080.600 |
5596.400 |
|
Short term borrowings |
3244.400 |
3038.300 |
4019.600 |
|
Total
borrowings |
8223.000 |
8118.900 |
9616.000 |
|
Debt/Equity
ratio |
0.747 |
0.453 |
0.570 |
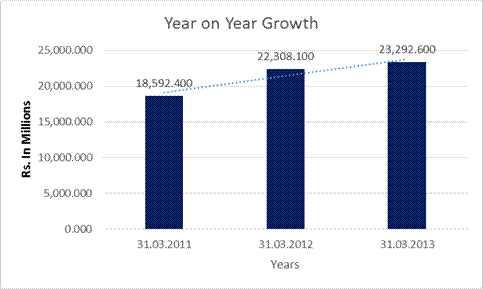
YEAR-ON-YEAR GROWTH
|
Year
on Year Growth |
31.03.2011 |
31.03.2012 |
31.03.2013 |
|
|
Rs.
In Millions |
Rs.
In Millions |
Rs.
In Millions |
|
Sales |
18,592.400 |
22,308.100 |
23,292.600 |
|
|
|
19.985 |
4.413 |
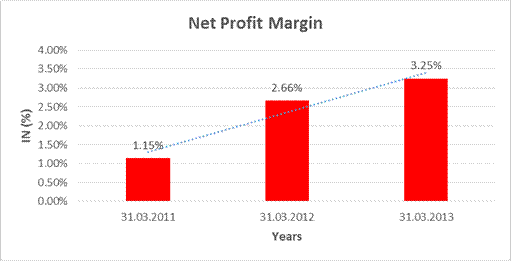
NET PROFIT MARGIN
|
Net
Profit Margin |
31.03.2011 |
31.03.2012 |
31.03.2013 |
|
|
Rs.
In Millions |
Rs.
In Millions |
Rs.
In Millions |
|
Sales
|
18,592.400 |
22,308.100 |
23,292.600 |
|
Profit |
213.900 |
593.500 |
757.000 |
|
|
1.15% |
2.66% |
3.25% |
LOCAL AGENCY FURTHER INFORMATION
CURRENT MATURITIES
OF LONG-TERM DEBT
(Rs.
In Millions)
|
SOURCES OF FUNDS |
31.03.2013 |
31.03.2012 |
31.03.2011 |
|
Current maturities of long-term debt |
2862.800 |
4834.100 |
4185.700 |
|
Sr. No. |
Check List by Info Agents |
Available in
Report (Yes / No) |
|
1] |
Year of Establishment |
Yes |
|
2] |
Locality of the firm |
Yes |
|
3] |
Constitutions of the firm |
Yes |
|
4] |
Premises details |
Yes |
|
5] |
Type of Business |
Yes |
|
6] |
Line of Business |
Yes |
|
7] |
Promoter's background |
Yes |
|
8] |
No. of employees |
No |
|
9] |
Name of person contacted |
Yes |
|
10] |
Designation of contact
person |
Yes |
|
11] |
Turnover of firm for last
three years |
Yes |
|
12] |
Profitability for last
three years |
Yes |
|
13] |
Reasons for variation
<> 20% |
----- |
|
14] |
Estimation for coming
financial year |
No |
|
15] |
Capital in the business |
Yes |
|
16] |
Details of sister
concerns |
Yes |
|
17] |
Major suppliers |
No |
|
18] |
Major customers |
No |
|
19] |
Payments terms |
No |
|
20] |
Export / Import details (if
applicable) |
No |
|
21] |
Market information |
----- |
|
22] |
Litigations that the firm
/ promoter involved in |
Yes |
|
23] |
Banking Details |
Yes |
|
24] |
Banking facility details |
Yes |
|
25] |
Conduct of the banking
account |
----- |
|
26] |
Buyer visit details |
----- |
|
27] |
Financials, if provided |
Yes |
|
28] |
Incorporation details, if
applicable |
Yes |
|
29] |
Last accounts filed at
ROC |
Yes |
|
30] |
Major Shareholders, if
available |
Yes |
|
31] |
Date of Birth of Proprietor/Partner/Director,
if available |
Yes |
|
32] |
PAN of
Proprietor/Partner/Director, if available |
No |
|
33] |
Voter ID No of
Proprietor/Partner/Director, if available |
No |
|
34] |
External Agency Rating,
if available |
Yes |
LITIGATION DETAILS:
|
HIGH
COURT OF BOMBAY
|
INDEX OF CHARGES
|
S.NO. |
CHARGE ID |
DATE OF CHARGE
CREATION/MODIFICATION |
CHARGE AMOUNT
SECURED |
CHARGE HOLDER |
ADDRESS |
SERVICE REQUEST
NUMBER (SRN) |
|
1 |
10460764 |
21/11/2013 |
1,000,000,000.00 |
STATE BANK OF MYSORE |
CORPORATE ACCOUNTS BRANCH, 224-C, MITTAL COURT, 4TH FLOOR, NARIMAN POINT, MUMBAI - 400021, MAHARASHTRA, INDIA |
B89762728 |
|
2 |
10437603 |
16/07/2013 |
1,500,000,000.00 |
IDBI BANK LIMITED |
IDBI TOWERWTC COMPLEX, CUFFE PARADE, MUMBAI - 400005, MAHARASHTRA, INDIA |
B79943197 |
|
3 |
10440863 |
15/07/2013 |
270,000,000.00 |
IDBI BANK LIMITED |
IDBI TOWERWTC COMPLEX, CUFFE PARADE, MUMBAI - 400005, MAHARASHTRA, INDIA |
B81029357 |
|
4 |
10413461 |
26/03/2013 |
1,000,000,000.00 |
STATE BANK OF MYSORE |
CORPORATE ACCOUNTS BRANCH, 224-C, MITTAL COURT, 4TH FLOOR, NARIMAN POINT, MUMBAI - 400021, MAHARASHTRA, INDIA |
B71302160 |
|
5 |
10411690 |
18/03/2013 |
4,000,000,000.00 |
ICICI BANK LIMITED |
ICICI BANK TOWERS, BANDRA KURLA COMPLEX, BANDRA (EAST), MUMBAI - 400051, MAHARASHTRA, INDIA |
B70738000 |
|
6 |
10366705 |
06/07/2012 |
1,200,000,000.00 |
TATA CAPITAL FINANCIAL SERVICES LIMITED |
ONE FORBES, DR. V. B. GANDHI MARG, FORT, MUMBAI -
400001, |
B44246148 |
|
7 |
10360536 |
30/05/2012 |
1,500,000,000.00 |
CENTRAL BANK OF INDIA |
CORPORATE FINANCE BRANCH, MMO BUILDING, 1ST FLOOR, M. G. ROAD, FORT, MUMBAI - 400023, MAHARASHTRA, INDIA |
B41590134 |
|
8 |
10334184 |
06/05/2013 * |
1,015,400,250.00 |
BANK OF BAHRAIN AND KUWAIT BSC |
43, GOVERNMENT AVENUE, P O BOX 597, MANAMA, - 00 |
B76301977 |
|
9 |
10319823 |
23/11/2011 |
175,000,000.00 |
BANK OF BAHRAIN AND KUWAIT B.S.C |
JOLLY MAKER CHAMBERS II, 225, NARIMAN POINT, MUMBAI - 400021, MAHARASHTRA, INDIA |
B26145672 |
|
10 |
10308936 |
27/09/2011 |
3,000,000,000.00 |
ICICI BANK LIMITED |
ICICI BANK TOWERS, BANDRA KURLA COMPLEX, BANDRA (EAST), MUMBAI - 400051, MAHARASHTRA, INDIA |
B22008544 |
|
11 |
10292461 |
09/06/2011 |
2,500,000,000.00 |
STATE BANK OF INDIA |
CORPORATE ACCOUNTS GROUP BRANCH, NEVILLE HOUSE, J .N.HEREDIA MARG, BALLARD ESTATE, MUMBAI - 400001, MAHARASHTRA, INDIA |
B15087299 |
|
12 |
10202231 |
06/05/2013 * |
1,350,000,000.00 |
IDBI BANK LIMITED |
IDBI TOWERWTC COMPLEX, CUFFE PARADE, MUMBAI - 400005, MAHARASHTRA, INDIA |
B76031921 |
|
13 |
10120154 |
11/09/2008 |
400,000,000.00 |
STATE BANK OF MYSORE |
CORPORATE ACCOUNTS BRANCH, MITTAL COURT, C WING, NARIMAN POINT, MUMBAI - 400021, MAHARASHTRA, INDIA |
A44837011 |
|
14 |
10061356 |
29/01/2010 * |
320,000,000.00 |
STATE BANK OF PATIALA |
COMMERCIAL BRANCH, ATLANTA, 1ST FLOOR, JAMNALAL BAJAJ
MARG, NARIMAN POINT, MUMBAI - |
A77925758 |
|
15 |
10061354 |
29/01/2010 * |
500,000,000.00 |
STATE BANK OF PATIALA |
COMMERCIAL BRANCH, ATLANTA, 1ST FLOOR, JAMNALAL BAJAJ
MARG, NARIMAN POINT, MUMBAI - |
A77907699 |
|
16 |
80024603 |
21/07/2009 * |
2,750,000,000.00 |
AXIS BANK LIMITED |
UNIVERSAL INSURANCE BUILDING, SIR P.M.ROAD, FORT, MUMBAI - 400001, MAHARASHTRA, INDIA |
A69789881 |
|
17 |
80063972 |
25/01/2006 |
2,750,000,000.00 |
UTI BANK |
UNIVERSAL INSURANCE BLDG; SIR P. M. ROAD, FORT, |
- |
|
18 |
90238030 |
13/02/2007 * |
3,550,000,000.00 |
STATE BANK OF INDIA |
EXPRESSTOWERS,20TH FLOOR, NARIMAN POINT, MUMBAI - 400021, MAHARASHTRA, INDIA |
- |
|
19 |
90234840 |
21/03/2002 * |
245,000,000.00 |
UTI BANK LIMITED |
SAKAR, ASHRAM ROAD, AHMEDABAD - 380009, GUJARAT, INDIA |
- |
|
20 |
90234828 |
15/01/2002 |
245,000,000.00 |
UTI BANK LIMITED |
SAKAR, ASHRAM ROAD, AHMEDABAD - 380009, GUJARAT, INDIA |
- |
|
21 |
90234779 |
31/12/2001 * |
60,000,000.00 |
ICICI LIMITED |
ICICI TOWERS, BANDRA KURLA, MUMBAI - 400051, MAHARASHTRA, INDIA |
- |
|
22 |
90234778 |
13/10/2011 * |
7,750,000,000.00 |
STATE BANK OF INDIA |
CORPORATE ACCOUNTS GROUP BRANCH, NEVILLE HOUSE, 3RD FLOOR,
J N HEREDIA MARG, MUMBAI - |
B25592825 |
|
23 |
90234771 |
31/05/2001 |
1,000,000,000.00 |
ICICI LIMITED |
ICICI TOWER, BANDRA KURLA COMPLEX, MUMBAI - 400051, MAHARA SHTRA, INDIA |
- |
|
24 |
90234634 |
07/09/2000 * |
14,400,000.00 |
ICICI LIMITED |
ICICI TOWERS, BANDRA KURLA, MUMBAI - |
- |
|
25 |
90235973 |
11/01/2000 |
200,000,000.00 |
DEUTSCHE BANK |
HAZARIMAL SORINANAI MARG, FORT, MUMBAI - 400001, MAHARASHTRA, INDIA |
- |
|
26 |
90235950 |
20/10/1999 |
250,000,000.00 |
ICICI LIMITED |
ICICI TOWERS, BANDRA KURLA, MUMBAI - |
- |
|
27 |
90235935 |
11/03/2003 * |
922,895,800.00 |
ICICI BANK LIMITED |
ICICI TOWERS, BANDRA KURLA, MUMBAI - |
- |
|
28 |
90235921 |
17/05/1999 |
100,000,000.00 |
DEUTSCHE BANK |
HAZARIMAL SORINANAI MARG, FORT, MUMBAI - 400001, MAHARASHTRA, INDIA |
- |
|
29 |
90235904 |
09/03/1999 |
200,000,000.00 |
DEUTSCHE BANK |
HAZARIMAL SORINANAI MARG, FORT, MUMBAI - 400001, MAHARASHTRA, INDIA |
- |
|
30 |
90235864 |
27/08/1998 |
200,000,000.00 |
CANARA BANK |
STOCK EXCHANGE TOWER, J.C. ROAD, BANGALORE, KARNATAKA, INDIA |
- |
|
31 |
90233991 |
08/04/1994 |
47,500,000.00 |
BANK OF BARODA |
IND. FINANCE BRANCH, C.P. STREET, MUMBAI - 400023, MAHARAS HTRA, INDIA |
- |
|
32 |
90237900 |
28/03/1994 * |
1,000,000.00 |
THE INDUSTRIAL CREDIT AND INVEST. CORP. OF INIDA L |
163; BACKBAY RECLAMATION, MUMBAI - 400023, MAHARASHTRA, INDIA |
- |
|
33 |
90237897 |
26/07/1993 |
833,000.00 |
STATE BANK OF INDIA |
BANK STREET, MUMBAI - 400023, MAHARASHTRA, INDIA |
- |
|
34 |
90233931 |
13/08/2002 * |
922,895,800.00 |
ICICI LIMITED |
ICICI TOWERS, BANDRA KURLA, MUMBAI - |
- |
|
35 |
90237896 |
26/07/1993 * |
922,895,800.00 |
THE INDUSTRIAL CREDIT AND INVEST; CORP. OF INDIA L |
163; BACKBAY RECLAMATION, MUMBAI - 400020, MAHARASHTRA, INDIA |
- |
|
36 |
90233921 |
28/03/1994 * |
150,000,000.00 |
SCICI LIMITED |
MAKER TOWER, CUFFE PARADE, MUMBAI - |
- |
|
37 |
90233918 |
26/07/1993 * |
200,000,000.00 |
THE INDUSTRIAL CREDIT AND INVEST. CORP. OF INIDA LIMITED |
163; BACKBAY RECLAMATION, MUMBAI - 400023, MAHARASHTRA, INDIA |
- |
|
38 |
90233912 |
26/07/1993 * |
113,500,000.00 |
THE INDUSTRIAL CREDIT AND INVEST. CORP. OF INIDA LIMITED |
163; BACKBAY RECLAMATION, MUMBAI - 400023, MAHARASHTRA, INDIA |
- |
|
39 |
90233798 |
25/08/1992 * |
42,400,000.00 |
THE INDUSTRIAL CREDIT AND INVEST. CORP. OF INIDA LIMITED |
163; BACKBAY RECLAMATION, MUMBAI - 400023, MAHARASHTRA, INDIA |
- |
* Date of charge modification
UNSECURED LOANS
|
Unsecured Loans |
31.03.2013 (Rs.
In Millions) |
31.03.2012 (Rs.
In Millions) |
|
LONG-TERM BORROWINGS |
|
|
|
Fixed Deposits |
1311.000 |
329.200 |
|
SHORT-TERM
BORROWINGS |
|
|
|
Bills discounted with banks |
138.600 |
182.300 |
|
Intercorporate deposits |
230.000 |
0.000 |
|
Total |
1679.600 |
511.500 |
REAL ESTATE DIVISION
The revenue from real estate activity was Rs. 6660.000 millions as compared to Rs. 5660.000 millions in the previous year. The operating profit for the year was Rs. 3500.000 millions as against Rs. 2690.000 millions in the previous year.
Bombay Realty (BR), the real estate division of the Company, has launched two high rise luxury residential towers viz. ‘One ICC’ and ‘Two ICC’ at Island City Center (ICC), which will have world class amenities and features.
A renowned Architect has been appointed as Lead Consultant for the project. Consultants for Structural Engineering, Mechanical, Electrical and Plumbing, Vertical transportation, Facade, LEED Gold certification etc. have also been appointed. The consultants would be supported by internal experts in these areas. The project will include energy efficient features and use of sustainable material which will ensure substantial operational cost savings in energy and water consumption leading to higher satisfaction levels of occupants as compared to conventional buildings.
During 2012, the Company was required to amend the building designs for ICC to meet the requirements of new Development Control Regulations. The modified building design has been prepared with a view to optimize the building efficiency.
MCGM has issued a Stop Work Order at Company’s Worli Textiles Mill site (WIC) pursuant to withdrawal of approval granted in 2004 for modification to the Textile Mill Modernisation scheme by the Textiles Department of Government of Maharashtra. This has been challenged by the Company in its Writ Petition before Hon’ble Bombay High Court.
Pursuant to the Order of Hon’ble Supreme Court dated 9th August, 2012 for handing over the share of land to MHADA and MCGM at the two mills respectively, the Company has submitted plans for consolidated hand over as per Integrated Development Scheme. Subsequently, as directed by MCGM, the Company has filed an application before Hon’ble Supreme Court for modification of its Order of 9th August, 2012 to enable hand over at single location.
The Directors believe that irrespective of the outcome of the case, the Company’s development plans are not likely to be affected.
The handover of land admeasuring over 66,000 square meters would be one of the largest handover of land in Mumbai. This will enable MHADA to provide housing to over 4,000 families. Besides, the Company would also be rehabilitating over 1,000 families currently residing on the site.
TEXTILE DIVISION:
The Textile turnover has increased from Rs. 4330.000 millions in the previous year to Rs. 4620.000 millions for the year ended on 31st March, 2013 i.e. a growth of 7% over previous year. Despite this the division suffered an operational loss of Rs. 120.000 millions in the current year compared to a profit of Rs. 50.000 millions in the previous year due to lower margin and adverse product mix.
Domestic business grew by 5% led by mix improvement. Exports turnover grew by 35% from Rs. 340.000 millions to Rs. 460.000 millions However, there was a severe pressure on the margins due to slowdown of growth both in domestic and international markets.
In order to provide thrust to domestic retail business, the Company has created a new Retail Division to drive growth in the domestic market.
POLYESTER DIVISION:
The Division achieved a turnover of Rs. 13280.000 millions during the year as compared to Rs. 13490.000 millions in the previous year. The demand and prices of PSF are to a significant extent linked to supply and prices of cotton. During the year, cotton prices continued to remain depressed, leading to lower realization for PSF. Further, it also led to a large number of spinners remaining away from PSF, thereby adversely impacting the volume. Increased capacity in the recycled PSF industry also adversely impacted the PSF business. The average capacity utilization of 81.5%, though lower than 84% achieved in the previous year was significantly better than industry capacity utilization of 71% during the year.
The margins of the PSF Division were adversely impacted due to a sharp increase in the raw material prices in the backdrop of escalating crude oil prices, continuing adverse impact of rupee depreciation and sharp increase in conversion cost due to increase in RLNG and power cost, during the year.
MANAGEMENT DISCUSSION
AND ANALYSIS
The year was a challenging year. The global economy continued to witness slower economic growth despite modest recovery in US economy led by housing and consumer sectors. The economies of India and China were forced to tighten liquidity to control inflation, resulting in slow-down. These global events also had dampening impact on Indian economy. Deceleration in industrial output and lower export weakened India’s economic growth. The economy grew by about 5% during the year 2012-13 which is one of the lowest in the
current decade.
The good sign is that the Indian economy appears to have bottomed out and is on its way to recovery on the back of improved external demand, growing internal consumption, expected better monsoon, moderation of inflation and policy reforms. Significant improvement from current low levels of economic growth is certainly feasible. Overall economic growth is expected to rise to 6.4% in 2013-14 as per Government forecast.
REAL ESTATE BUSINESS
INDUSTRY STRUCTURE
AND DEVELOPMENTS
The Real Estate market in the country has been hitherto dominated by players from the unorganized sector. Due to some unscrupulous players the developers were perceived as unreliable and undependable by the authorities as well as by the potential buyers. The entry of reputed industry houses in recent years has not only changed the basic rules of the game but also has provided the customers with greater choice for a reliable provider of home. Thus, the profile of the industry is undergoing a significant change with an increasing share of market moving to organized players and large corporates.
At present, the sector is highly regulated with complex administrative and legal frame work with multiple authorities laying down stringent conditions for development in an area which is a basic need of the people. Moreover, several of these regulations are localized thereby preventing a Pan India approach by large corporate developers. Recently, the cabinet has approved the draft Real Estate Regulations bill which will bring clarity and transparency to both, industry as well as the customers. This will streamline and bring uniformity in the approval process and ensure greater accountability, as well as a speedy governance process by the authorities.
The Real Estate market in Mumbai city has experienced a significant growth in the past 15 years and the prices have shot up multifold in past decade. The growing urbanization and increase in the younger population is expected to fuel the market growth. It may be noted that currently 64% of the country’s population is in the working age group. This, coupled with income levels which are catching up with more affluent nations especially amongst the professional classes is expected to drive the demand for luxury apartments priced above Rs. 30.000 Millions.
Notwithstanding various challenges in the present macroeconomic environment, the market for real estate has witnessed several new project launches. While the prices have remained stable in Mumbai city in the last year, the demand has started picking up. The expected interest rate reduction and turning around of the economy will boost the demand. This is likely to be further supplemented by increasing demand from Non-Resident Indians for whom the weakening Rupee has made India an attractive investment destination.
TEXTILE BUSINESS
INDUSTRY STRUCTURE
AND DEVELOPMENTS
The textile industry plays a crucial role in the Indian Economy. Apart from providing one of the basic necessities of life, it also contributes significantly to the industrial output, employment generation and export earning of the country.
The country’s economic growth has created significant opportunities for Textile Retail Growth.
The textile sector, contributes about 14% to the Industrial output, 4% to the GDP, and accounts for 17% of the country’s exports. It provides direct employment to over 35 million people, next only to agriculture.
Within the overall Textile sector, Home Textile market size is estimated at over Rs. 100000.000 millions. The share of organized sector, however, in this sector is less than 10% while the market size is expected to grow at 9% per annum; the share of organized sector is expected to increase significantly over next few years.
Traditionally, the consumers are being serviced through Wholesale and Multi Brand Outlets. However, in the recent years substantial growth has been witnessed in Large Format Stores which offer a variety of products under a single roof, and are therefore popular among young consumers, pressed for time. The consumers are also becoming far more conscious of brands and are making their choice based on various features such as range of designs, shopping ambience and brand position in addition to pricing. The policy initiatives like exempting Textile made up articles from excise duty are likely to help in growth of this sector.
OUTLOOK
The raw material prices are expected to remain stable due to good cotton production. The demand growth is likely to pick up resulting from the overall economic recovery. The margins are likely to be under pressure due to aggressive competition. The Company proposes to focus on improving design range, driving fast growth through expanding store network, introducing more value added products and aggressive marketing.
Export markets may continue to remain weak. The Company will focus on building continuous relationship with large and medium sized buyers abroad.
POLYESTER BUSINESS
INDUSTRY STRUCTURE
AND DEVELOPMENTS
Polyester Staple Fibre (PSF) is produced from two major petrochemical intermediates, Purified Terephthalic Acid (PTA) and Mono Ethylene Glycol (MEG), and is used as substitute for cotton to manufacture spun yarns, either wholly with polyester or blended with cotton or with Viscose Staple Fibre (VSF). There are three major producers of PSF in the country. A fourth small producer has entered the PSF business during the year. While the market leader is fully vertically integrated, the other producers including the Company are stand-alone PSF manufacturers.
Over the past few years, the yarn industry has enhanced use of recycled polyester, derived from recycling of PET bottles and other waste material. However, the quality of such fibre is significantly inferior.
With 60% of global PSF capacity, China remains a dominant influence on polyester and downstream textile products.
The Indian PSF business saw a marginal reduction in volume and realization due to continuing weak cotton prices and other extraneous factors like weakness in euro zone economies and consequent increase in crude, RLNG and petrochemical prices in the world market. The sharp rise in Rupee to US Dollar exchange rate has resulted in further rise in key raw materials prices. The overall polyester industry’s capacity utilization thus came down to barely 70-72%, even though the Company could manage to deliver 81.5% (as against 84% in the previous year).
The world PSF market remained subdued due to a static demand in the western countries, and slower growth in China.
OUTLOOK
While the year 2012-13 was not a rewarding period from business perspective, few positives could be derived out of the operation such as efforts toward energy conservation and maintaining reasonable healthy capacity utilization compared to the industry average. With their sustained efforts in these fronts coupled with anticipated improved demand and higher capacity utilization, they expect the business to improve and become profitable. This will further be aided by the Company’s focus on speciality fibre, innovative product mix and long term measures for cost reduction by converting fuel from RLNG to coal.
UNAUDITED FINANCIAL RESULTS FOR THE QUARTER ENDED 30TH JUNE, 2013
(Rs. In millions)
|
|
PARTICULARS |
|
QUARTER ENDED |
|
|
|
30.06.2013 |
|
|
|
|
(Unaudited) |
|
|
|
PART I |
|
|
|
1 |
Income from operations (a) Net sales/income from operations (Net of excise duty) (b) Other operating income Total income from operations (net) |
|
5163.700 109.000 5272.700 |
|
2 |
Expenses |
|
|
|
|
(a) Cost of materials consumed |
|
2807.600 |
|
|
(b) Purchase of stock-in-trade |
|
232.600 |
|
|
(c) Change in inventories of finished goods, |
|
|
|
|
work-in-progress and stock-in-trade |
|
716.900 |
|
|
(d) Employee benefits expense |
|
239.500 |
|
|
(e) Depreciation and amortisation expenses |
|
155.600 |
|
|
(f) Other expenses |
|
1068.000 |
|
|
Total expenses |
|
5220.200 |
|
3 |
Profit/(Loss) from operations before other income finance costs and exceptional items (1-2) |
|
|
|
4 |
Other Income |
|
103.400 |
|
5 |
Profit / (Loss) from ordinary activities before finance costs |
|
|
|
|
and exceptional items (3+4) |
|
155.900 |
|
6 |
Finance costs |
|
431.600 |
|
7 |
Profit / (Loss) from ordinary activities after finance costs but before exceptional items (5-6) |
|
(275.700) |
|
8 |
Exceptional Items |
|
- |
|
9 |
Profit/ (Loss) from ordinary activities before tax (7-8) |
|
(275.700) |
|
10 |
Tax expense -Current |
|
- |
|
11 |
Net Profit/ (Loss) from ordinary activities after tax (9-10) |
|
(275.700) |
|
12 |
Extraordinary items (net of tax expense) |
|
- |
|
13 |
Net Profit/ (Loss) for the period (11 -12) |
|
(275.700) |
|
14 |
Paid up equity share capital |
|
413.100 |
|
|
(Face value Rs.2 per share) |
|
|
|
15 |
Reserves excluding revaluation reserves |
|
- |
|
16.i |
Earnings per share (before extraordinary items) |
|
|
|
|
Basic (Rs.) |
|
(1.34) |
|
|
Diluted (Rs.) |
|
(1.34) |
|
6.ii |
Earnings per share (after extraordinary items) |
|
|
|
|
Basic (Rs.) |
|
(1.34) |
|
|
Diluted (Rs.) |
|
(1.34) |
|
|
|
|
|
|
|
PARTICULARS |
|
QUARTER ENDED |
|
|
|
|
30.06.2013 |
|
|
|
|
(Unaudited) |
|
|
PART II |
|
|
|
A |
PARTICULARS OF
SHAREHOLDING |
|
|
|
1 |
Public Shareholding |
|
|
|
|
- Number of shares |
|
9,58,15,807 |
|
|
- Percentage of shareholding |
|
46.39 |
|
2 |
Promoters & promoter group Shareholding |
|
|
|
|
a) Pledged/Encumbered |
|
|
|
|
- Number of Shares |
|
59,78,500 |
|
|
- Percentage of shares |
|
5.40 |
|
|
(as a % of total shareholding of promoter and promoter group) |
|
|
|
|
- Percentage of shares |
|
2.89 |
|
|
(as a % of total share capital on the company) |
|
|
|
|
b) Non-encumbered |
|
|
|
|
- Number of Shares |
|
10,47,40,593 |
|
|
- Percentage of shares |
|
94.60 |
|
|
(as a % of total shareholding of promoter and promoter group) |
|
|
|
|
- Percentage of shares |
|
50.72 |
|
|
(as a % of total share capital on the company) |
|
|
|
|
Face value per share in Rupees |
|
2 |
SEGMENT WISE REVENUE, RESULTS AND CAPITAL EMPLOYED
(Rs. In millions)
|
PARTICULARS |
|
QUARTER ENDED |
|
|
30.06.2013 |
|
|
|
(Unaudited) |
|
|
1. Segment
Revenue |
|
|
|
(net sales/income
from each segment) (a) Textile (b) Polyester (c) Real Estate |
|
1098.100 2970.000 1216.800 |
|
(d) Unallocated |
|
0.100 |
|
Total |
|
5285.000 |
|
Add/(Less) :Inter
segment revenue |
|
(12.300) |
|
Net
Sales/Income from Operations |
|
5272.700 |
|
2.
Segment Results - Profit/ (Loss) |
|
|
|
(a) Textile |
|
(14.100) |
|
(b) Polyester |
|
(398.300) |
|
(c) Real Estate |
|
671.000 |
|
Total |
|
258.600 |
|
Less: (i) Net Interest expense |
|
431.600 |
|
(ii) Other un-allocable
expenditure |
|
|
|
net of un-allocable income |
|
102.700 |
|
Total Profit/ (Loss) before
Tax |
|
(275.700) |
|
3. Capital
Employed |
|
|
|
(Segment Assets - Segment
Liabilities) |
|
|
|
(a) Textile |
|
3829.600 |
|
(b) Polyester |
|
1915.700 |
|
(c) Real Estate |
|
20891.400 |
|
Unallocated: |
|
1178.800 |
|
(i) Others |
|
|
|
Total Capital Employed |
|
27815.500 |
NOTES :
1 The above results were reviewed by the Audit Committee at their meeting held on 05th August, 2013 and approved by the Board of Directors at their meeting held on 06th August, 2013. The Statutory Auditors have carried out a limited review of these results pursuant to Clause 41 of the Listing Agreement.
2 The Company has during the quarter ended 30th June, 2013, pursuant to various agreements for sale, sold certain apartments in the proposed residential towers being constructed and in accordance with the accounting policy formulated by the Company, recognised revenue of Rs. 1165.400 millions (June'2012 Rs.973.200 millions) [including an amount of Rs.598.200 millions (June'2012 Rs.657.000 millions) on sale to an associate company] and an amount of Rs. 304.000 millions (June'2012 Rs.300.300 millions) has been released from the revaluation reserve to the Statement of Profit and Loss in proportion of the reveune recognised.
3 The equity shares of the Company having face value of Rs.10/- each have been sub-divided into 5 equity shares of face value of Rs.2/- effective 1st November, 2012 pursuant to the approval of the shareholders on 18th October, 2012. In accordance with AS-20 "Earnings per Share", the per share calculations for the quarter ended 30th June, 2013 and the pervious periods have been presented based on the revised number of shares to make them comparable.
4 Figures for the previous periods have been regrouped / restated wherever necessary.
CONTINGENT
LIABILITIES:
(Rs. in millions)
|
PARTICULARS |
31.03.2013 |
31.03.2012 |
|
A. Claims against
the company not acknowledged as debt. |
|
|
|
(a) Income-tax matters in respect of earlier years under dispute (including interest of Rs. 58.500 millions) [31.03.2012. Rs. 58.500 millions] as follows: |
257.700 |
336.800 |
|
(i) Decided in Company’s favour by appellate authorities and department in further appeal |
7.400 |
51.100 |
|
(ii) Pending in appeal - matters decided against the Company |
250.300 |
285.700 |
|
(b) Sales Tax, Service Tax and Excise Duties |
18.600 |
18.600 |
|
(c) Customs duty |
9.500 |
2.500 |
|
(d) Others (Claims against the Company not acknowledged as debts) (with interest thereon) |
345.900 |
364.200 |
|
In respect of items (a) to (d) above, future cash outflows in respect of contingent liabilities are determinable only on receipt of judgments pending at various forums/authorities. |
|
|
|
B. Guarantees Counter indemnity for an amount of Rs. 1341.200 millions (31.3.2011 Rs. 1134.700 millions) issued in favour of banks which in turn have guaranteed loans granted by other banks abroad to PT Five Star Textile, Indonesia, (PTFS), a joint venture company as under:- (i) Rs. 1166.700 millions (31.3.2012 Rs. 840.800 millions) in favour of IDBI Bank Limited against guarantees issued to Punjab National Bank International London for loans granted to PTFS secured by first Mortgage/charge over part of the land of the Company at Spring Mills at Mumbai admeasuring 46,442.13 square metres and buildings and structures thereon. (ii) Rs. Nil (31.3.2012 Rs. 120.000 millions) in favour of IDBI Bank Limited against guarantees issued to Punjab National Bank International London for loans granted to PTFS is secured by fixed deposit of Rs. 125.100 millions earmarked in favour of IDBI Bank Limited. (iii) Rs. 174.500 millions (31.3.2012 Rs. 173.900 millions) in favour of Bank of Bahrain and Kuwait, Bahrain for loans granted to PTFS secured by first Mortgage/charge over part of the land of the Company at Textile Mills at Mumbai admeasuring 89,819.85 square metres and plant and machinery, buildings and structures thereon. The Company has a pari passu charge on PTFS’s assets, which would cover the aforesaid indemnity amount. |
|
|
|
C. Other money for which the company is contingently liable Bills discounted |
305.800 |
379.400 |
FIXED ASSETS:
TANGIBLE ASSETS
·
Freehold Land
·
Leasehold Land
·
Building
·
Office Equipments
·
Plant and Machinery
·
Furniture and Fixture
·
Motor Vehicles
INTANGIBLE ASSETS
·
Technical Know How
·
Software
CMT REPORT (Corruption, Money Laundering & Terrorism]
The Public Notice information has been collected from various sources
including but not limited to: The Courts,
1] INFORMATION ON
DESIGNATED PARTY
No exist designating subject or any of its beneficial owners, controlling
shareholders or senior officers as terrorist or terrorist organization or whom
notice had been received that all financial transactions involving their assets
have been blocked or convicted, found guilty or against whom a judgement or
order had been entered in a proceedings for violating money-laundering,
anti-corruption or bribery or international economic or anti-terrorism sanction
laws or whose assets were seized, blocked, frozen or ordered forfeited for
violation of money laundering or international anti-terrorism laws.
2] Court Declaration :
No exist to suggest that subject is or was
the subject of any formal or informal allegations, prosecutions or other
official proceeding for making any prohibited payments or other improper payments
to government officials for engaging in prohibited transactions or with
designated parties.
3] Asset Declaration :
No records exist to suggest that the property or assets of the subject
are derived from criminal conduct or a prohibited transaction.
4] Record on Financial
Crime :
Charges or conviction
registered against subject: None
5] Records on Violation of
Anti-Corruption Laws :
Charges or
investigation registered against subject: None
6] Records on Int’l
Anti-Money Laundering Laws/Standards :
Charges or
investigation registered against subject: None
7] Criminal Records
No
available information exist that suggest that subject or any of its principals
have been formally charged or convicted by a competent governmental authority
for any financial crime or under any formal investigation by a competent
government authority for any violation of anti-corruption laws or international
anti-money laundering laws or standard.
8] Affiliation with
Government :
No record
exists to suggest that any director or indirect owners, controlling
shareholders, director, officer or employee of the company is a government
official or a family member or close business associate of a Government
official.
9] Compensation Package :
Our market
survey revealed that the amount of compensation sought by the subject is fair
and reasonable and comparable to compensation paid to others for similar
services.
10] Press Report :
No press reports / filings exists on
the subject.
CORPORATE GOVERNANCE
MIRA INFORM as part of its Due Diligence do provide comments on
Corporate Governance to identify management and governance. These factors often
have been predictive and in some cases have created vulnerabilities to credit
deterioration.
Our Governance Assessment focuses principally on the interactions
between a company’s management, its Board of Directors, Shareholders and other
financial stakeholders.
CONTRAVENTION
Subject is not known to have contravened any existing local laws,
regulations or policies that prohibit, restrict or otherwise affect the terms
and conditions that could be included in the agreement with the subject.
FOREIGN EXCHANGE RATES
|
Currency |
Unit
|
Indian Rupees |
|
US Dollar |
1 |
Rs.58.48 |
|
|
1 |
Rs.98.67 |
|
Euro |
1 |
Rs.79.81 |
INFORMATION DETAILS
|
Information
Gathered by : |
SVA |
|
|
|
|
Analysis Done by
: |
SUB |
|
|
|
|
Report Prepared
by : |
NKT |
SCORE & RATING EXPLANATIONS
|
SCORE FACTORS |
RANGE |
POINTS |
|
HISTORY |
1~10 |
6 |
|
PAID-UP CAPITAL |
1~10 |
5 |
|
OPERATING SCALE |
1~10 |
6 |
|
FINANCIAL CONDITION |
|
|
|
--BUSINESS SCALE |
1~10 |
6 |
|
--PROFITABILIRY |
1~10 |
5 |
|
--LIQUIDITY |
1~10 |
5 |
|
--LEVERAGE |
1~10 |
5 |
|
--RESERVES |
1~10 |
5 |
|
--CREDIT LINES |
1~10 |
5 |
|
--MARGINS |
-5~5 |
-- |
|
DEMERIT POINTS |
|
|
|
--BANK CHARGES |
YES/NO |
YES |
|
--LITIGATION |
YES/NO |
YES |
|
--OTHER ADVERSE INFORMATION |
YES/NO |
NO |
|
MERIT POINTS |
|
|
|
--SOLE DISTRIBUTORSHIP |
YES/NO |
NO |
|
--EXPORT ACTIVITIES |
YES/NO |
NO |
|
--AFFILIATION |
YES/NO |
YES |
|
--LISTED |
YES/NO |
YES |
|
--OTHER MERIT FACTORS |
YES/NO |
YES |
|
DEFAULTER |
|
|
|
--RBI |
YES/NO |
NO |
|
--EPF |
YES/NO |
NO |
|
|
|
|
|
TOTAL |
|
48 |
This score serves as a reference to assess SC’s credit risk
and to set the amount of credit to be extended. It is calculated from a
composite of weighted scores obtained from each of the major sections of this
report. The assessed factors and their relative weights (as indicated through
%) are as follows:
Financial
condition (40%) Ownership
background (20%) Payment
record (10%)
Credit history
(10%) Market trend
(10%) Operational
size (10%)
RATING EXPLANATIONS
|
RATING |
STATUS |
PROPOSED CREDIT LINE |
|
|
>86 |
Aaa |
Possesses an extremely sound financial base with the strongest
capability for timely payment of interest and principal sums |
Unlimited |
|
71-85 |
Aa |
Possesses adequate working capital. No caution needed for credit transaction.
It has above average (strong) capability for payment of interest and
principal sums |
Large |
|
56-70 |
A |
Financial & operational base are regarded healthy. General unfavourable
factors will not cause fatal effect. Satisfactory capability for payment of
interest and principal sums |
Fairly Large |
|
41-55 |
Ba |
Overall operation is considered normal. Capable to meet normal
commitments. |
Satisfactory |
|
26-40 |
B |
Capability to overcome financial difficulties seems comparatively
below average. |
Small |
|
11-25 |
Ca |
Adverse factors are apparent. Repayment of interest and principal sums
in default or expected to be in default upon maturity |
Limited with full
security |
|
<10 |
C |
Absolute credit risk exists. Caution needed to be exercised |
Credit not
recommended |
|
-- |
NB |
New Business |
-- |
This report is issued at your request without any
risk and responsibility on the part of MIRA INFORM PRIVATE LIMITED (MIPL) or
its officials.