MIRA
INFORM REPORT
|
Report Date : |
27.05.2014 |
IDENTIFICATION DETAILS
|
Name : |
COROMANDEL INTERNATIONAL LIMITED |
|
|
|
|
Registered
Office : |
1-2-10, Sardar Patel Road, Secunderabad, Hyderabad – 500003, Andhra
Pradesh |
|
|
|
|
Country : |
India |
|
|
|
|
Financials (as
on) : |
31.03.2013 |
|
|
|
|
Date of
Incorporation : |
16.10.1961 |
|
|
|
|
Com. Reg. No.: |
01-000892 |
|
|
|
|
Capital
Investment / Paid-up Capital : |
Rs. 283.100 Millions |
|
|
|
|
CIN No.: [Company Identification
No.] |
L24120AP1961PLC000892 |
|
|
|
|
TAN No.: [Tax Deduction &
Collection Account No.] |
HYDC00011E |
|
|
|
|
PAN No.: [Permanent Account No.] |
AAACC785ZK |
|
|
|
|
Legal Form : |
A Public Limited Liability company. The company’s Shares are Listed on
the Stock Exchanges. |
|
|
|
|
Line of Business
: |
Subject is engaged in the Manufacture and Trading of Farm Inputs. |
|
|
|
|
No. of Employees
: |
Not Available |
RATING & COMMENTS
|
MIRA’s Rating : |
A (57) |
|
RATING |
STATUS |
PROPOSED CREDIT LINE |
|
|
56-70 |
A |
Financial & operational base are regarded healthy. General unfavourable
factors will not cause fatal effect. Satisfactory capability for payment of
interest and principal sums |
Fairly Large |
|
Maximum Credit Limit : |
USD 87000000 |
|
|
|
|
Status : |
Good |
|
|
|
|
Payment Behaviour : |
Regular |
|
|
|
|
Litigation : |
Clear |
|
|
|
|
Comments : |
Subject is an old and established company having fine track record.
Financial positions of the company appear to be sound. Fundamentals are strong
and healthy. Trade relations are reported as fair. Business is active.
Payments are reported to be regular and as per commitments. The company can be considered good for normal business dealings at
usual trade terms and conditions. |
NOTES :
Any query related to this report can be made
on e-mail : infodept@mirainform.com
while quoting report number, name and date.
ECGC Country Risk Classification List – March 31, 2014
|
Country Name |
Previous Rating (31.12.2013) |
Current Rating (31.03.2014) |
|
India |
A1 |
A1 |
|
Risk Category |
ECGC
Classification |
|
Insignificant |
A1 |
|
Low |
A2 |
|
Moderate |
B1 |
|
High |
B2 |
|
Very High |
C1 |
|
Restricted |
C2 |
|
Off-credit |
D |
INDIAN ECONOMIC OVERVIEW
US investment bank
Goldman Sachs has upgraded its outlook on Indian markets as it expects
positive impact of the election cycle.
India’s economy may
grow 4.7 % in the current financial year, lower than the official estimate of 4.9
%, Fitch Rating said. The global rating agency expects the economy to pick up
in the next two financial years.
Global ratings
agency Standard & Poor said increasing focus by India Inc on lowering debt
is likely to improve their credit profiles.
Singapore (1.1
million Indian tourists in 2012), Thailand (one million), the United Arab
Emirates ().98 million) and Malaysia ().82 million) emerged as the preferred
holidays hotspots for Indians. The total figure is expected to increase to 1.93
million by 2017, according to the latest Eurmonitor international report.
There is a $29.34 bn
outward foreign direct investment by domestic companies between April and
January of 2013/14 which has seen some signs of recovery according to a Care
Ratings report.
There are 264 number
of new companies being set up every day on average during 2014. Most of them
are registered in Mumbai. India had 1.38 million registered companies at the
end of January, 2014.
Twitter like
messaging service Weibo Corporation has filed to raise $ 500 million via a US
initial public offering. Alibaba, which owns a stake in Weibo is expected to
raise about $ 15 billion New York this year in the highest profile Internet IPO
since Facebook’s in 2012.
Bharti Airtel has
raised Rs.2,453.2 crore (350 million Swiss Francs) by selling six-year bonds at
a coupon rate of three per cent and maturing in 2020. This is the largest ever
bond offering by an Indian company in Swiss Francs. Bharat Petroleum
Corporation raised 175 million Swiss Francs by selling five year bonds at 2.98
% coupon rate in February.
Indian Oil
Corporation plans to invest Rs 7650 crore in setting up a petrochemical complex
at its almost complete Paradip refinery in Odhisha in three to four years. The
company board is set to consider the setting up of a 700000 tonne per annum
polypropylene plant at an estimated cost at Rs.3150 crore.
Global chief
information officers at gathering in Bangalore in April to meet Indian startups
at an event called Tech50 Watchout for Little Eye Labs-Facebook type deals in
the making.
EXTERNAL AGENCY RATING
|
Rating Agency Name |
CRISIL |
|
Rating |
Long term rating: “AA+” |
|
Rating Explanation |
High degree of safety and low credit risk. |
|
Date |
11.12.2013 |
|
Rating Agency Name |
CRISIL |
|
Rating |
Short term rating: “A1+” |
|
Rating Explanation |
Very strong degree of safety and lowest
credit risk. |
|
Date |
11.12.2013 |
RBI DEFAULTERS’ LIST STATUS
Subject’s name is not enlisted as a defaulter in
the publicly available RBI Defaulters’ list.
EPF (Employee Provident Fund) DEFAULTERS’ LIST STATUS
Subject’s name is not enlisted as a defaulter
in the publicly available EPF (Employee Provident Fund) Defaulters’ list as of
31-03-2012.
INFORMATION PARTED BY
|
Name : |
Mr. Sriram |
|
Designation : |
General Manager Finance |
|
Contact No.: |
91-40-27842034 |
|
Date : |
24.05.2014 |
LOCATIONS
|
Registered Office : |
1-2-10, Sardar Patel Road, Secunderabad, Hyderabad – 500003, Andhra
Pradesh, India |
|
Tel. No.: |
91-40-27842034/ 27847212 |
|
Fax No.: |
91-40-27844117 |
|
E-Mail : |
|
|
Website : |
|
|
|
|
|
Factory : |
Fertiliser
Plants : Sriharipuram, Po Box No. 1116, Malkapuram Post, Visakhapatnam –
530011, Andhra Pradesh, India Phone: 91-891-2578400 to 2578419 Fax: 91-891-2577665 N. Seetaram - General Manager - Mfg. Email:Seetaramn@cfl.murugappa.com
Compound
Fertilisers Factory Ennore, Chennai – 600507, Tamilnadu, India Phone: 91-44-5733600 Satyanarayana Rao - General Works Manager Email:Satyanarayanarao@cfl.murugappa.com CROP PROTECTION
PLANTS AT: ·
Ranipet in Tamilnadu · Beach Road, Kakinada, Andhra Pradesh ·
Ankleshwar in Gujarat ·
Baribrahmana, Jammu and Kashmir |
DIRECTORS
As on: 31.03.2013
|
Name : |
Mr. A Vellayan |
|
Designation : |
Chairman |
|
|
|
|
Name : |
Mr. V Ravichandran |
|
Designation : |
Vice Chairman |
|
|
|
|
Name : |
Mr. Kapil Mehan |
|
Designation : |
Managing Director |
|
|
|
|
Name : |
Mr. K Balasubramanian |
|
Designation : |
Director |
|
|
|
|
Name : |
Mr. B V R Mohan
Reddy |
|
Designation : |
Director |
|
|
|
|
Name : |
Mr. Uday Chander Khanna |
|
Designation : |
Director |
|
|
|
|
Name : |
Mr. M M
Venkatachalam |
|
Designation : |
Director |
|
|
|
|
Name : |
Ms. Ranjana Kumar |
|
Designation : |
Director |
KEY EXECUTIVES
|
Name : |
Mr. G Ravi Prasad |
|
Designation : |
President - Marketing Fertilisers and SND |
|
|
|
|
Name : |
Mr. P Gopalakrishna |
|
Designation : |
Sr Vice President - Retail |
|
|
|
|
Name : |
Mr. Harish Malhotra |
|
Designation : |
Sr Vice President - Commercial |
|
|
|
|
Name : |
Mr. Arun Leslie
George |
|
Designation : |
Sr Vice President and Head of HR |
|
|
|
|
Name : |
Mr. Amir Alvi |
|
Designation : |
Sr Vice President and Head of Manufacturing |
|
|
|
|
Name : |
Mr. S
Sankarasubramanian |
|
Designation : |
Chief Financial Officer |
|
|
|
|
Name : |
Mr. M R Rajaram |
|
Designation : |
Company Secretary |
|
|
|
|
Name : |
Mr. P Varadarajan |
|
Designation : |
Vice President - Legal & Company Secretary - (w.e.f. June 12, 2013) |
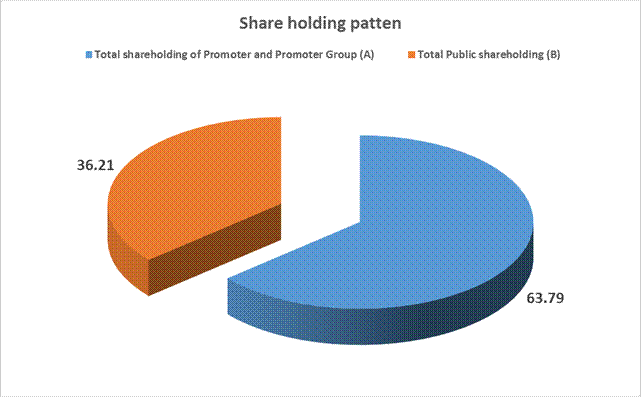
MAJOR SHAREHOLDERS / SHAREHOLDING PATTERN
As on: 31.03.2014
|
Category of
Shareholder |
No. of Shares |
Percentage of
Holding |
|
(A) Shareholding of
Promoter and Promoter Group |
|
|
|
|
|
|
|
|
3404464 |
1.20 |
|
|
177186160 |
62.57 |
|
|
42140 |
0.01 |
|
|
42140 |
0.01 |
|
|
180632764 |
63.79 |
|
|
|
|
|
Total shareholding
of Promoter and Promoter Group (A) |
180632764 |
63.79 |
|
(B) Public
Shareholding |
|
|
|
|
|
|
|
|
11119209 |
3.93 |
|
|
157783 |
0.06 |
|
|
4663309 |
1.65 |
|
|
19258058 |
6.80 |
|
|
1840 |
0.00 |
|
|
35200199 |
12.43 |
|
|
|
|
|
|
20236376 |
7.15 |
|
|
|
|
|
|
23290377 |
8.22 |
|
|
9463152 |
3.34 |
|
|
14358954 |
5.07 |
|
|
71960 |
0.03 |
|
|
9600000 |
3.39 |
|
|
39333 |
0.01 |
|
|
3230137 |
1.14 |
|
|
1417524 |
0.50 |
|
|
67348859 |
23.78 |
|
Total Public
shareholding (B) |
102549058 |
36.21 |
|
Total (A)+(B) |
283181822 |
100.00 |
|
(C) Shares held by
Custodians and against which Depository Receipts have been issued |
0 |
0.00 |
|
|
0 |
0.00 |
|
|
0 |
0.00 |
|
|
0 |
0.00 |
|
Total (A)+(B)+(C) |
283181822 |
0.00 |
BUSINESS DETAILS
|
Line of Business : |
Subject is engaged in the Manufacture and Trading of Farm Inputs. |
|
|
|
|
Exports : |
|
|
Products : |
Not Divulged |
|
Countries : |
Not Divulged |
|
|
|
|
Imports : |
|
|
Products : |
Not Divulged |
|
Countries : |
Not Divulged |
PRODUCTION STATUS (AS ON 31.03.2011)
|
Particulars |
Unit |
Installed Capacity |
Actual Production |
|
(i)
Fertilisers |
|
|
|
|
Ammonium Phosphatic Fertilisers |
MT |
2315000 |
2104014 |
|
Di-Ammonium Phosphate (DAP) |
MT |
815000 |
434475 |
|
Single Super Phosphate |
MT |
132000 |
104472 |
|
|
|
|
|
|
(ii) Plant Protection Products |
|
|
|
|
Technicals |
MT |
11840 |
7204 |
|
Formulations
- Liquids (in KL) |
MT |
10400 |
7171 |
|
Formulations
– Granules/Powder |
MT |
6920 |
5338 |
Note:
Installed capacities
are as certified by the management and not verified by the auditors, being a
technical matter. Fertiliser and Plant Protection Products are not covered by
the list of industries in respect of which industrial licensing is compulsory.
GENERAL INFORMATION
|
Suppliers : |
Not Divulged |
|||||||||||||||||||||||||||
|
|
|
|||||||||||||||||||||||||||
|
Customers : |
Not Divulged |
|||||||||||||||||||||||||||
|
|
|
|||||||||||||||||||||||||||
|
No. of Employees : |
Not Available |
|||||||||||||||||||||||||||
|
|
|
|||||||||||||||||||||||||||
|
Bankers : |
· State Bank of India · Hongkong and Shanghai · Banking Corporation Limited · HDFC Bank · ICICI Bank · IDBI Bank · Yes Bank |
|||||||||||||||||||||||||||
|
|
|
|||||||||||||||||||||||||||
|
Facilities : |
(Rs.
In Millions)
|
|||||||||||||||||||||||||||
|
|
|
|
Banking
Relations : |
-- |
|
|
|
|
Auditors : |
|
|
Name : |
Deloitte Haskins and Sells Chartered Accountants |
|
Address : |
1-8-384 and 385,
3rd Floor, Gowra Grand, S.P. Road, Begumpet, Secunderabad – 500003, Andhra
Pradesh, India |
|
|
|
|
Cost Auditors: |
·
Mr. V Kalyanaraman ·
Mr. Dantu Mitra |
|
|
|
|
Holding Company: |
·
E.I.D. Parry (India) Limited |
|
|
|
|
Subsidiaries : |
·
Sabero Organics Gujarat Limited (Sabero) ·
Sabero Organics America Ltda (SOAL) ·
Sabero Australia Pty Limited, Australia (Sabero
Australia) ·
Sabero Europe BV (Sabero Europe) ·
Sabero Argentina S.A. (Sabero Argentina) ·
Parry Chemicals Limited (PCL) ·
CFL Mauritius Limited (CML) ·
Coromandel Brasil Limitada (CBL) ·
Liberty Phosphate Limited (LPL ·
Liberty Urvarak Limited (LUL) ·
Liberty Pesticides and Fertilisers Limited (LPFL) ·
Dare Investments Limited |
|
|
|
|
Fellow subsidiary: |
·
Parry Infrastructure Company Private Limited
(PICPL) ·
Sadashiva Sugars Limited (SSL) ·
Parry Sugar Industries Limited (PSIL) |
|
|
|
|
Joint venture: |
·
Coromandel Getax Phosphates Pte Limited (CGPL) ·
Coromandel SQM (India) Private Limited (CSQM) ·
Tunisian Indian Fertilisers. SA (TIFERT) |
CAPITAL STRUCTURE
As on: 31.03.2013
Authorised Capital :
|
No. of Shares |
Type |
Value |
Amount |
|
|
|
|
|
|
350000000 |
Equity Shares |
Re.1/- each |
Rs. 350.000 Millions |
|
|
|
|
|
Issued, Subscribed & Paid-up Capital :
|
No. of Shares |
Type |
Value |
Amount |
|
|
|
|
|
|
283057818 |
Equity Shares |
Re.1/- each |
Rs. 283.100 Millions |
|
|
|
|
|
Reconciliation of number
of equity shares and amount outstanding at the beginning and at the end of the
year:
|
|
31.03.2013 |
|
|
|
Number |
Rs. in Millions |
|
Per last Balance Sheet |
282569542 |
282.600 |
|
Add: Equity shares allotted pursuant to exercise of stock options |
488276 |
0.500 |
|
Balance at the
end of the year |
283057818 |
283.100 |
Rights, preferences
and restrictions attached to equity shares
The Company has one class of equity shares having a face value of Rs. 1/- each. Each shareholder is eligible for one vote per share held. The dividend proposed by the Board of Directors is subject to the approval of the Shareholders in the ensuing Annual General Meeting, except in the case of interim dividend.
(iii) As at 31 March 2013, E.I.D Parry (India) Limited (Holding Company) held 17,71,55,580 (2012: 17,71,55,580) equity shares of Rs.1/- each fully paid-up representing 62.59% (2012: 62.69%) of the paid-up capital. There are no other shareholders holding more than 5% of the issued capital.
(iv) As at 31 March 2013, shares reserved for issue under the ‘ESOP 2007’ scheme is 95,22,054 (2012: 1,00,10,330) equity shares of Rs.1/- each
Details of bonus shares issued, shares issued for consideration other
than cash during the period of five years immediately preceding the reporting
date:
8,31,981 equity shares of Rs.2/- each fully paid up were allotted to the shareholders of Ficom Organics Limited in the ratio of 3 shares of the Company for every 11 shares of Ficom Organics Limited pursuant to the Scheme of Amalgamation between Ficom Organics Limited, Rasilah Investments Limited and the Company during the year ended 31 March 2007.
(b) 1,20,37,182 equity shares of Rs. 2/- each fully paid up were allotted to the shareholders of Godavari Fertilisers and Chemicals Limited in the ratio of 3 shares of the Company for every 2 shares of Godavari Fertilisers and Chemicals Limited pursuant to the Scheme of Amalgamation between Godavari Fertilisers and Chemicals Limited and the Company during the year ended 31 March 2008.
LISTING DETAILS:
|
|
BSE: Physical Scrip Code No.6395 Demat Scrip Code No.506395 NSE : COROMANDELEQ |
|
Stock Exchange Place : |
Ø Bombay Stock
Exchange Limited Ø National Stock
Exchange of India Limited |
|
Listed Date : |
Not Available |
FINANCIAL DATA
[all figures are
in Rupees Millions]
ABRIDGED BALANCE
SHEET
|
SOURCES
OF FUNDS |
31.03.2013 |
31.03.2012 |
31.03.2011 |
|
I.
EQUITY AND LIABILITIES |
|
|
|
|
(1)Shareholders' Funds |
|
|
|
|
(a) Share Capital |
283.100 |
282.600 |
281.800 |
|
(b) Reserves & Surplus |
21473.000 |
23429.300 |
18759.300 |
|
(c) Money received against
share warrants |
0.000 |
0.000 |
0.000 |
|
|
|
|
|
|
(2) Share Application money
pending allotment |
0.000 |
0.000 |
0.000 |
|
Total
Shareholders’ Funds (1) + (2) |
21756.100 |
23711.900 |
19041.100 |
|
|
|
|
|
|
(3) Non-Current Liabilities |
|
|
|
|
(a) long-term borrowings |
7720.300 |
2727.900 |
1408.000 |
|
(b) Deferred tax liabilities
(Net) |
1797.900 |
674.500 |
814.500 |
|
(c) Other long term
liabilities |
301.200 |
339.900 |
300.000 |
|
(d) long-term provisions |
164.000 |
162.900 |
145.900 |
|
Total
Non-current Liabilities (3) |
9983.400 |
3905.200 |
2668.400 |
|
|
|
|
|
|
(4) Current Liabilities |
|
|
|
|
(a) Short term borrowings |
14675.500 |
21447.500 |
12234.000 |
|
(b) Trade payables |
22026.500 |
20427.200 |
15108.200 |
|
(c) Other current liabilities |
3209.300 |
2245.100 |
2009.500 |
|
(d) Short-term provisions |
1822.000 |
1323.400 |
1176.800 |
|
Total
Current Liabilities (4) |
41733.300 |
45443.200 |
30528.500 |
|
|
|
|
|
|
TOTAL |
73472.800 |
73060.300 |
52238.000 |
|
|
|
|
|
|
II.
ASSETS |
|
|
|
|
(1) Non-current assets |
|
|
|
|
(a) Fixed Assets |
|
|
|
|
(i) Tangible assets |
11362.400 |
8004.000 |
7937.000 |
|
(ii) Intangible Assets |
58.100 |
67.000 |
0.000 |
|
(iii) Capital work-in-progress |
279.400 |
1331.300 |
206.400 |
|
(iv) Intangible assets under
development |
0.000 |
0.000 |
0.000 |
|
(b) Non-current Investments |
8795.100 |
6279.000 |
2123.100 |
|
(c) Deferred tax assets (net) |
0.000 |
0.000 |
0.000 |
|
(d) Long-term Loan and Advances |
877.900 |
514.000 |
538.300 |
|
(e) Other Non-current assets |
0.000 |
0.000 |
0.000 |
|
Total
Non-Current Assets |
21372.900 |
16195.300 |
10804.800 |
|
|
|
|
|
|
(2) Current assets |
|
|
|
|
(a) Current investments |
0.400 |
0.400 |
0.400 |
|
(b) Inventories |
12648.900 |
18556.100 |
15131.200 |
|
(c) Trade receivables |
16108.900 |
8870.200 |
2024.100 |
|
(d) Cash and cash equivalents |
4527.600 |
9178.500 |
9020.500 |
|
(e) Short-term loans and
advances |
18741.700 |
20133.800 |
10876.300 |
|
(f) Other current assets |
72.400 |
126.000 |
4380.700 |
|
Total
Current Assets |
52099.900 |
56865.000 |
41433.200 |
|
|
|
|
|
|
TOTAL |
73472.800 |
73060.300 |
52238.000 |
PROFIT & LOSS
ACCOUNT
|
|
PARTICULARS |
31.03.2013 |
31.03.2012 |
31.03.2011 |
|
|
SALES |
|
|
|
|
|
Income |
55585.400 |
49688.700 |
32679.300 |
|
|
Government subsidies |
29620.500 |
47463.900 |
42628.900 |
|
|
Other operating revenue |
396.500 |
1080.100 |
1084.400 |
|
|
Other Income |
670.300 |
1166.700 |
797.600 |
|
|
TOTAL
(A) |
86272.700 |
99399.400 |
77190.200 |
|
|
|
|
|
|
|
Less |
EXPENSES |
|
|
|
|
|
Cost of Materials Consumed |
48586.900 |
58606.500 |
49910.700 |
|
|
Purchases of Stock-in-Trade |
15299.900 |
19349.100 |
8856.900 |
|
|
Changes in inventories of
finished goods, work-in-progress and Stock-in-Trade |
1472.000 |
(2588.700) |
(2199.700) |
|
|
Employees benefits expense |
2050.200 |
1882.200 |
1578.800 |
|
|
Other expenses |
10848.300 |
10370.600 |
7678.600 |
|
|
Exceptional item |
0.000 |
355.300 |
0.000 |
|
|
TOTAL
(B) |
78257.300 |
87975.000 |
65825.300 |
|
|
|
|
|
|
|
Less |
PROFIT/
(LOSS) BEFORE INTEREST, TAX,
DEPRECIATION AND AMORTISATION (C) |
8015.400 |
11424.400 |
11364.900 |
|
|
|
|
|
|
|
Less |
FINANCIAL
EXPENSES (D) |
1766.700 |
1165.100 |
862.900 |
|
|
|
|
|
|
|
|
PROFIT
/ (LOSS) BEFORE TAX, DEPRECIATION AND AMORTISATION (C-D) (E) |
6248.700 |
10259.300 |
10502.000 |
|
|
|
|
|
|
|
Less/
Add |
DEPRECIATION/
AMORTISATION (F) |
585.400 |
561.600 |
617.400 |
|
|
|
|
|
|
|
|
PROFIT/
(LOSS) BEFORE TAX (E-F) (G) |
5663.300 |
9697.700 |
9884.600 |
|
|
|
|
|
|
|
Less |
TAX
(H) |
1223.400 |
2765.000 |
2940.000 |
|
|
|
|
|
|
|
|
PROFIT/
(LOSS) AFTER TAX (G-H)
(I) |
4439.900 |
6932.700 |
6944.600 |
|
|
|
|
|
|
|
Add |
PREVIOUS
YEARS’ BALANCE BROUGHT FORWARD |
4817.300 |
3184.600 |
2030.000 |
|
|
|
|
|
|
|
Less |
APPROPRIATIONS |
|
|
|
|
|
Transfer to General Reserve |
2500.000 |
3000.000 |
3500.000 |
|
|
Interim Dividend |
0.000 |
1130.000 |
1310.000 |
|
|
Proposed Final Dividend |
1270.000 |
850.000 |
980.000 |
|
|
Dividend distribution tax |
220.000 |
320.000 |
0.000 |
|
|
Transferred to debenture
redemption reserve |
250.000 |
0.000 |
0.000 |
|
|
BALANCE
CARRIED TO THE B/S |
5017.200 |
4817.300 |
3184.600 |
|
|
|
|
|
|
|
|
EARNINGS
IN FOREIGN CURRENCY |
|
|
|
|
|
F.O.B. Value of export of goods |
729.400 |
579.200 |
663.791 |
|
|
Service Income |
0.000 |
25.200 |
26.876 |
|
|
Dividend from subsidiary company |
0.000 |
448.300 |
0.000 |
|
|
Dividend from others |
5.200 |
9.500 |
0.000 |
|
|
Others |
353.700 |
86.200 |
38.306 |
|
|
TOTAL
EARNINGS |
1088.300 |
1148.400 |
728.973 |
|
|
|
|
|
|
|
|
IMPORTS |
|
|
|
|
|
Raw Materials |
38666.200 |
52057.500 |
45207.158 |
|
|
Components and Stores parts |
17.400 |
20.400 |
26.000 |
|
|
Capital Goods |
51.500 |
61.000 |
1.000 |
|
|
Stock in Trade |
|
16394.200 |
6034.800 |
|
|
TOTAL
IMPORTS |
38735.100 |
68533.100 |
51268.958 |
|
|
|
|
|
|
|
|
Earnings
/ (Loss) Per Share (Rs.) |
|
|
|
|
|
Basic |
15.70 |
24.57 |
24.69 |
|
|
Diluted |
15.65 |
24.43 |
24.46 |
KEY RATIOS
|
PARTICULARS |
|
31.03.2013 |
31.03.2012 |
31.03.2011 |
|
PAT / Total Income |
(%) |
5.15 |
6.97 |
9.00 |
|
|
|
|
|
|
|
Net Profit Margin (PBT/Sales) |
(%) |
10.19 |
19.52 |
30.25 |
|
|
|
|
|
|
|
Return on Total Assets (PBT/Total Assets} |
(%) |
8.79 |
14.82 |
19.81 |
|
|
|
|
|
|
|
Return on Investment (ROI) (PBT/Networth) |
|
0.26 |
0.41 |
0.51 |
|
|
|
|
|
|
|
Debt Equity Ratio (Total Debt/Networth) |
|
1.02 |
1.01 |
0.71 |
|
|
|
|
|
|
|
Current Ratio (Current Asset/Current Liability) |
|
1.25 |
1.25 |
1.36 |
FINANCIAL ANALYSIS
[all figures are
in Rupees Millions]
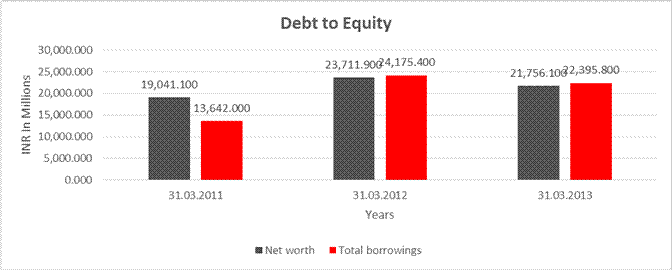
DEBT EQUITY RATIO
|
Particular |
31.03.2011 |
31.03.2012 |
31.03.2013 |
|
|
(Rs.
In Millions) |
(Rs.
In Millions) |
(Rs.
In Millions) |
|
Share Capital |
281.800 |
282.600 |
283.100 |
|
Reserves & Surplus |
18759.300 |
23429.300 |
21473.000 |
|
Net
worth |
19041.100 |
23711.900 |
21756.100 |
|
|
|
|
|
|
long-term borrowings |
1408.000 |
2727.900 |
7720.300 |
|
Short term borrowings |
12234.000 |
21447.500 |
14675.500 |
|
Total
borrowings |
13642.000 |
24175.400 |
22395.800 |
|
Debt/Equity
ratio |
0.716 |
1.020 |
1.029 |
YEAR-ON-YEAR GROWTH
|
Year
on Year Growth |
31.03.2011 |
31.03.2012 |
31.03.2013 |
|
|
(Rs.
In Millions) |
(Rs.
In Millions) |
(Rs.
In Millions) |
|
Sales |
32679.300 |
49688.700 |
55585.400 |
|
|
|
52.049 |
11.867 |
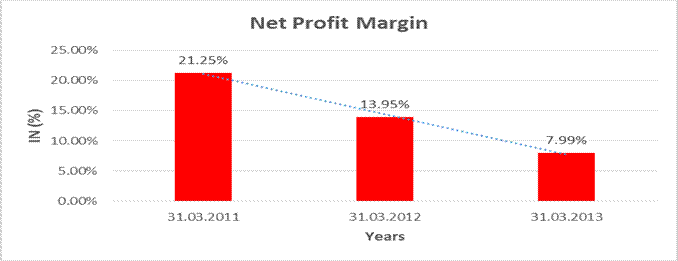
NET PROFIT MARGIN
|
Net
Profit Margin |
31.03.2011 |
31.03.2012 |
31.03.2013 |
|
|
(Rs.
In Millions) |
(Rs.
In Millions) |
(Rs.
In Millions) |
|
Sales |
32679.300 |
49688.700 |
55585.400 |
|
Profit |
6944.600 |
6932.700 |
4439.900 |
|
|
21.25% |
13.95% |
7.99% |
LOCAL AGENCY FURTHER INFORMATION
|
Sr. No. |
Check List by Info
Agents |
Available in Report
(Yes / No) |
|
1] |
Year of Establishment |
Yes |
|
2] |
Locality of the firm |
Yes |
|
3] |
Constitutions of the firm |
Yes |
|
4] |
Premises details |
No |
|
5] |
Type of Business |
Yes |
|
6] |
Line of Business |
Yes |
|
7] |
Promoter's background |
No |
|
8] |
No. of employees |
No |
|
9] |
Name of person contacted |
Yes |
|
10] |
Designation of contact person |
Yes |
|
11] |
Turnover of firm for last three years |
Yes |
|
12] |
Profitability for last three years |
Yes |
|
13] |
Reasons for variation <> 20% |
-- |
|
14] |
Estimation for coming financial year |
No |
|
15] |
Capital in the business |
Yes |
|
16] |
Details of sister concerns |
Yes |
|
17] |
Major suppliers |
No |
|
18] |
Major customers |
No |
|
19] |
Payments terms |
Yes |
|
20] |
Export / Import details (if applicable) |
No |
|
21] |
Market information |
-- |
|
22] |
Litigations that the firm / promoter involved in |
-- |
|
23] |
Banking Details |
Yes |
|
24] |
Banking facility details |
Yes |
|
25] |
Conduct of the banking account |
-- |
|
26] |
Buyer visit details |
-- |
|
27] |
Financials, if provided |
Yes |
|
28] |
Incorporation details, if applicable |
Yes |
|
29] |
Last accounts filed at ROC |
Yes |
|
30] |
Major Shareholders, if available |
Yes |
|
31] |
Date of Birth of Proprietor/Partner/Director, if available |
No |
|
32] |
PAN of Proprietor/Partner/Director, if available |
No |
|
33] |
Voter ID No of Proprietor/Partner/Director, if available |
No |
|
34] |
External Agency Rating, if available |
Yes |
UNSECURED LOAN
(Rs.
In Millions)
|
Particulars |
As on 31.03.2013 |
As on 31.03.2012 |
|
Long term
borrowings |
|
|
|
9% Unsecured redeemable non-convertible fully paid bonus debentures of
Rs.15/- each |
4242.300 |
0.000 |
|
|
|
|
|
Short term
borrowings |
|
|
|
Loans repayable on demand from banks |
13907.800 |
11839.000 |
|
loans from banks |
0.000 |
5000.000 |
|
|
|
|
|
Total |
18150.100 |
16839.000 |
|
Note:
9% Unsecured redeemable non-convertible fully paid bonus debentures are redeemable at par over three years commencing from 23 July 2014 (Rs.5 each year) and interest is payable on an annual basis commencing from 23 July 2013 upto 23 July 2016. Unsecured loans repayable on demand comprises buyers credit denominated in foreign currency loans from banks. |
||
Operations
The year gone by was a very eventful one with a strategic acquisition of
Liberty Phosphate Limited, market leader in SSP segment, on the one side and a
steep decline in demand for P and K fertilisers on the other side. Demand
contraction was driven by near drought conditions in key addressable market
states of Andhra Pradesh, Karnataka and Maharashtra and steep increase in P and
K fertilisers prices due to rupee depreciation. A very high disparity between
Urea and Phosphates prices also impacted the demand for phosphatic fertilisers.
These factors impacted sales volumes of the Company during the year, which in
turn impacted adversely profitability of the Company for the year. The Company
had under the adverse conditions, improved its market share in the primary
markets and recorded a total revenue of Rs.86270.000 millions. Profit for the
year before depreciation, interest and taxation was Rs.8020.000 millions and
profit after tax was Rs.4440.000 millions. The Company also improved the
financial performance of Sabero Organics Gujarat Limited (Sabero) with company
turning in EBIDTA of Rs.508.000 millions as against (Rs.343.600) millions in
the previous year.
Deficient monsoon during the year impacted other businesses as well
viz., Crop Protection and Speciality Nutrients. With the acquisition of Sabero,
Crop Protection business has expanded its product portfolio and increased the
share of global business. The main thrust during the year was to integrate
Sabero operations with the Company's business and enhance its presence in both
domestic and global markets. These efforts have started yielding positive
results with the formulations business registering a sales growth of 16% over
the previous year. The business successfully redeployed the manufacturing
capacity of Endosulfan plant to produce alternate products.
In Speciality Nutrient Business, while the adverse monsoon had impacted
sulphur volumes, sale of Water Soluble Fertilisers registered a growth of 14%.
In line with the overall strategy to enhance the Speciality Nutrients business
the Company has adopted crop based approach for demand creation and also put in
place dedicated sales force to improve the performance. Organic Manure
business, despite adverse market conditions registered volume growth of 12%.
The Company would continue to drive this business in helping the farmer to improve
soil fertility.
Retail business, despite low off take of fertilisers, reported a 26%
growth in non fertiliser products and the Company continues to focus on
expanding its product portfolio. There are 550 outlets in the state of Andhra
Pradesh and 96 outlets in Karnataka. The retail outlets have become the face of
the Company and has helped in the increased sales of Pesticides and Speciality
Nutrients. The Company's efforts are directed towards making these retail
outlets a complete farm solution platform.
Subsidiary
Companies:
Acquisition of Liberty Phosphate Limited and Liberty Urvarak Limited
(Liberty group)
During the year, the Company entered into a Share Purchase Agreement with
the erstwhile promoters of Liberty group and acquired 70,19,406 equity shares
(representing 48.62%) of Liberty Phosphate Limited (LPL) at Rs.241/- per share.
Consequent to this on March 7, 2013 the Company reconstituted the Board of LPL
and took control of the management of LPL.
The Company, also made a public announcement to further acquire
37,53,933 equity shares (26%) of LPL through an Open Offer from the
shareholders of LPL at a price of Rs.241/- per share, pursuant to the
provisions of SEBI (Substantial Acquisition of Shares and Takeover)
Regulations, 2011. Approval of SEBI is awaited for completing the process of
the open offer.
The Company also acquired 100% equity shares of Liberty Urvarak Limited
(LUL) from its shareholders. LUL has a manufacturing unit in Nimrani in the
state of Madhya Pradesh. LUL holds 7,22,928 equity shares (representing 5%) of
LPL. The Company along with LUL holds 77,42,334 equity shares (representing
53.62%) of LPL. With completion of the abovesaid acquisition, both LPL and LUL
have become subsidiaries of Coromandel.
LPL and LUL manufacture Single Super Phosphate (SSP) grade fertilisers
with 5 manufacturing facilities spread across the States of Gujarat, Madhya
Pradesh, Rajasthan and Uttar Pradesh. The shares of LPL are listed on the
Bombay Stock Exchange.
The Company had also signed a term sheet with the M/s Tungabhadra
Fertilisers and Chemicals Company Limited (TFCL) for buying its business
undertaking on slump sale basis.
The acquisition of LPL, LUL and proposed acquisition of the business
undertaking of TFCL would make the Company a pan India Company and also would
make the Company a formidable and leading player in SSP segment.
Despite adverse market conditions and deficient monsoon, LPL's total
revenue for the year ended March 31, 2013 was Rs.4696.500 millions with a Net
profit of Rs.320.500 millions.
LUL's total revenue for the year ended March 31, 2013 was Rs.907.600
millions with a Net profit of Rs.53.700 millions.
In view of these acquisitions, the Company has deferred the setting up
of SSP plant at Bhatinda, Punjab for the present.
Sabero Organics
Gujarat Limited (Sabero)
Sabero's total revenue for the year ended March 31, 2013 was Rs.5157.800
millions with a Net profit of Rs.77.300 millions as compared to a loss of
Rs.612.400 millions in the previous year.
CFL Mauritius
Limited:
The company (a 100% subsidiary) earned a total revenue of US $ 0.49
million (equivalent to Rs.2.650 millions) and net profit of US $ 0.09 million (equivalent
to Rs.0.48 millions) during the year ended December 31, 2012.
Parry Chemicals Limited (PCL):
The company (a 100% subsidiary) earned a total revenue of Rs.8.700
millions for the year ended March 31, 2013 and Profit after Tax was Rs.3.600
millions.
PCL, during the year had acquired 100000 equity shares of Sabero
Organics Gujarat Limited representing 0.295% from the stock market.
Joint Venture
Companies
Tunisian Indian
Fertilizers S.A. (TIFERT)
TIFERT, a joint venture company, was formed in Tunisia in 2008, to set
up a phosphoric acid plant. The plant which was originally expected to be
commissioned by the first quarter of 2011 got delayed mainly due to the
political developments in Tunisia in the last two years. With the restoration
of near normalcy in Tunisia the plant has been commissioned and is in the
process of being stabilized and the phosphoric acid supplies are expected to
commence during the current financial year onwards. The Company during the year
had given a loan of US $ 4.65 million to TIFERT to part fund the cost overrun
of the project. The Company's strategic investment towards 15% equity stake in
TIFERT is aimed at securing uninterrupted supply of phosphoric acid for the
Company's operations especially for the expanded capacity in Kakinada.
Coromandel Getax
Phosphates Pte Limited
The joint venture Company based in Singapore formed for leveraging
opportunities for rock phosphate mining/sourcing continued scouting for
opportunities during the year.
Coromandel SQM
(India) Private Limited
The joint venture company formed to set up a Water Soluble Fertilisers
(WSF) Plant at Kakinada, Andhra Pradesh, has commenced its operations during
the year 2011-12. The company earned a total revenue of Rs.369.600 millions for
the year ended March 31, 2013 and a Net profit of Rs.16.100 millions.
Awards/Recognition
The Company continues to receive numerous awards/accolades from industry
associations. During the year the Company received the following
awards/accolades:
·
Company was awarded Significant Achievement in the
CII-EXIM Bank Business Excellence Award 2012 and Significant Achievement in HR
Excellence Award 2012.
·
Company received Institute of Directors Golden
Peacock National Training Award for the year 2013.
·
Company was awarded 'Retail Marketing Campaign of
the Year award' under Awards for Retail Excellence presented by ET Now.
MANAGEMENT DISCUSSION
AND ANALYSIS
Performance:
The fiscal year 2012-13 has been a challenging one for the Fertiliser industry. The high prices for DAP and Complexes relative to Urea and erratic south west monsoon have affected the application rates and fertilizer sales. This lowered consumption of DAP and Complex fertilisers has led to the inventory build-up across the supply chain resulting in a situation of oversupply. As a result, the industry as a whole recorded DAP sales of 91lakh tons and Complex sales of 73 lakh tons in 2012-13 which is 15% and 33% lower than previous year levels respectively. Coromandel's combined DAP, Complex and SSP fertiliser sales for 2012-13 was 21.50 lakh tons.
The total production of DAP, Complex and SSP in 2012-13 from Coromandel's production facilities was 18.57 lakh tons. The Company has slowed down production during the year to align with the market requirement and also to avoid excess inventory buildup. All four fertiliser plants have reported improved operational efficiencies and maintained safety and environmental standards. The timely purchase of raw materials and pro-active foreign exchange management has helped the Company to improve overall performance.
In 2012-13, the Company has repositioned the brands for its products and organized all chemical fertilisers under the flagship "GROMOR" brand and all organic fertilisers under the flagship "Godavari" brand. This rebranding exercise has been completed and launched with redesigned high quality bags. These efforts will further strengthen the brand equity of these brands which are currently measuring 6.7.Based on the brand re-launch and marketing efforts, Coromandel increased its market-share in AP, TN, KA and MH.
The Company completed the capacity expansion at Kakinada and commissioned the new third granulation train (C-Train) and all associated support facilities in 2012-13. The newly installed capacity at Kakinada will allow Coromandel to manufacture unique grades of fertilisers and provide value added products to the farmer. As part of its tie up with Shell for manufacture of Sulfur enhanced fertilisers, the Visakhapatnam plant successfully commenced trial production of 24:24:0:8S using Shell's Thiogro technology.
The Company has been investing continuously in meeting its obligations towards protecting the environment.
Towards this step, during the year the Green Visaka project was continued with the planting of over 20,000 trees.
Safety of the employees and the community is of paramount importance to the Company and in order to maintain a safe working culture in all its manufacturing locations, the Company has invested and improved the structural integrity at its Vishakapatnam and Ennore plants. The Company will continue to undertake investments in further improving the safety culture at its plants.
Outlook
Increasing urbanization, higher disposable income levels, growing population base to feed and changes in consumption patterns towards higher protein, fruits and vegetables intake will continue to be the long-term growth drivers for the agricultural inputs sector. The core long term demand drivers for the fertiliser industry remain steady with improving farm economics and rising thrust on irrigation. While the long-term demand side fundamentals are firmly in place, the short-term supply side fundamentals are continuing to emerge in India.
The pro-Nitrogen subsidy policy that is currently in place will continue to face pressure from multiple fronts – imbalanced nutrient application resulting in poor soil health and productivity, high fiscal deficit and industrial advocacy to name a few. The Government will continue to lower subsidies for the decontrolled fertilisers in the near term to reduce the burgeoning subsidy payments and reduce fiscal deficit. Substantial increase in Urea price and its eventual move to NBS is an need to correct nutrient use balance which has worsened over the last three years.
While the policy issues will continue to be debated and developed over a period of time, the Company has been actively planning to meet the long term demands of the agricultural inputs sector. With the recent commissioning of C-Train, the Company has positioned itself to be the leading Phosphatic fertiliser player in private sector in the country. In addition, the Company has improved its manufacturing facilities at Visakhapatnam and Ennore to ensure sustainable operations for the long-term. With these changes, the manufacturing base of the Company has been positioned to be capable of meeting the needs of the phosphatic fertiliser sector.
Further, the Company has been continuing to pursue strategic alliances for raw material supply. The TIFERT JV project in Tunisia has been commissioned and is expected to commence supply soon. In addition, the Company will continue to actively scout for other raw material and backward integration opportunities.
In the Crop Protection Business, the Company will continue to focus on specialities and will scale up formulation sales based on captive technicals including additional range being manufactured by Sabero. The Company is also actively expanding its global footprint by leveraging Sabero and will continue to increase its presence in Latin America, Africa and South East Asia. In addition, the Company will continue to maintain a global focus and increase its reach by increasing its portfolio of global registrations.
The Specialty Nutrient Business will continue to be a growing business segment. Increased consumption of high value products like fruits and vegetables resulting from rising income levels will be the primary engine behind growth in this segment. Acreage under drip irrigation will continue to increase and drive the usage of Water Soluble Fertilisers (WSF). This business segment will assume a crop based focus and expand its basket of offerings by leveraging its joint venture with SQM.
The Rural Retail Business will continue to be the face of the Company in rural India. In 2012-13 the Company has restructured its retail footprint - Mana Gromor Centers in Andhra Pradesh and Namma Gromor Centers in Karnataka - by repositioning some existing outlets.In addition to these outlets being the primary source of cash sales of agri-inputs, the retail outlets are vital to the dissemination of scientific agricultural techniques and will continue to host webinars to connect the farmers to the scientific community.
CONTINGENT
LIABILITIES (TO THE EXTENT NOT PROVIDED FOR)
a) Guarantees:
(i) The Company
has provided guarantee to third parties on behalf of its subsidiary CFL
Mauritius Limited - Rs.16.800 Millions (2012: Rs.671.600 Millions) in respect
of which the contingent liability is Rs.109.800 Millions (2012: Rs.203.500
Millions).
(ii) The Company
has provided a guarantee towards the borrowing of Tunisian Indian Fertilisers
S.A., Tunisia (TIFERT), a joint venture company, up to Rs.1810.000 Millions
(2012: Rs.2633.000 Millions) in respect of which the contingent liability is
Rs.2519.100 Millions (2012: Rs.2388.700 Millions).
b) Claims against
the Company not acknowledged as debt
(Rs.
in Millions)
|
Particulars |
31.03.2013 |
|
In respect of matters under dispute: |
|
|
Excise duty |
150.100 |
|
Sales tax |
18.500 |
|
Income tax |
-- |
|
Others |
166.100 |
The amounts shown
in the item (a) represent guarantees given in the normal course of business and
not expected to result in any loss to the Company on the basis of the
beneficiaries fulfilling their obligations as they arise. The amounts in item
(b) represent best estimate and the uncertainties are dependent on the outcome
of the legal processes initiated by the Company or the claimant as the case may
be.
c) Other money for
which the Company is contingently liable
(Rs.
in Millions)
|
Particulars |
31.03.2013 |
|
In respect of assignment of receivables from fertiliser dealers |
795.800 |
|
In respect of
assignment/ sale of trade and subsidy receivables where option to buy-back rests with the Company |
2500.000 |
The Management expects to realise all the amounts reflected above in the normal course of business.
STATEMENT OF STANDALONE AND CONSOLIDATED AUDITED FINANCIAL RESULTS FOR
THE QUARTER AND YEAR ENDED 31 MARCH 2014
(Rs.
In Millions)
|
|
Particulars |
Stand-alone results |
||
|
|
Quarter Ended |
Nine Months ended |
||
|
|
31.03.2014 |
31.12.2013 |
31.03.2014 |
|
|
1 |
Income from
operations |
|
|
|
|
|
(a) Net sales/income from operations (net of excise duty) |
23205.500 |
24896.300 |
93386.900 |
|
|
(b) Other operating income |
164.100 |
111.900 |
418.300 |
|
|
Total income from
operations (net) |
23369.600 |
25007.200 |
93805.200 |
|
2 |
Expenses |
|
|
|
|
|
a) Cost of materials consumed |
13398.700 |
17926.900 |
69475.500 |
|
|
b) Purchases of stock-in-trade |
1378.000 |
2963.100 |
12292.200 |
|
|
c) Changes in inventories of finished goods, work-in- process and stock-in-trade |
1389.800 |
-2198.000 |
-1239.500 |
|
|
d) Employee benefits expense |
685.700 |
620.500 |
2437.600 |
|
|
e) Depreciation and amortisation expense |
228.600 |
197.100 |
820.300 |
|
|
f) Freight and distributors expenses |
1605.700 |
1705.000 |
3951.300 |
|
|
g) Other expenses |
2093.900 |
1902.700 |
7502.000 |
|
|
Total expenses |
21780.400 |
23117.300 |
87239.400 |
|
3 |
Profit from
operations before other income, finance costs and exceptional items (1-2) |
1589.200 |
1889.900 |
6565.800 |
|
4 |
Other income |
204.500 |
125.500 |
613.700 |
|
5 |
Profit before
finance costs and exceptional items (3+4) |
1793.700 |
2015.400 |
7179.500 |
|
6 |
Finance costs |
558.200 |
506.900 |
2109.600 |
|
7 |
Profit after
finance costs but before exceptional items (5-6) |
1235.500 |
1508.500 |
5069.900 |
|
8 |
Exceptional items |
0.000 |
0.000 |
-126.100 |
|
9 |
Profit before tax
(7+8) |
1235.500 |
1508.500 |
4943.800 |
|
10 |
Tax expense |
404.600 |
487.700 |
1495.300 |
|
11 |
Net Profit after
tax (9-10) |
830.000 |
1020.800 |
3448.500 |
|
12 |
Minority interest |
0.000 |
0.000 |
0.000 |
|
13 |
Net Profit after
taxes and minority interest (11-12) |
830.900 |
1020.800 |
3448.500 |
|
14 |
Paid-up equity share capital (Face value-7l per equity share) |
283.200 |
283.200 |
283.200 |
|
15 |
Paid-up debt capital (Face value - 715 pet debenture) |
0.000 |
4242.300 |
0.000 |
|
16 |
Reserves (excluding revaluation reserves) as per Balance Sheet of previous accounting year |
|
|
22047.400 |
|
17 |
Debenture redemption reserve |
|
|
|
|
18 |
Earnings per share (of 71 each) (for the period - not annualised) |
|
|
|
|
|
- Basic (7) |
2.89 |
3.60 |
12.05 |
|
|
- Diluted (7) |
2.89 |
3.60 |
12.03 |
|
|
|
|
|
|
|
A |
Particulars of
Shareholding |
|
|
|
|
1 |
Public Shareholding |
|
|
|
|
|
- Number of shares |
102549058 |
102534558 |
102549058 |
|
|
- Percentage of shareholding |
36.21% |
36.21% |
36.18% |
|
2 |
Promoters and Promoter group Shareholding a) Pledged/encumbered |
|
|
|
|
|
-Number of shares |
10000 |
10000 |
10000 |
|
|
-Percentage of shares (as a % of the total shareholding of promoter and promoter group) |
0.01% |
0.00% |
0.01% |
|
|
-Percentage of shares (as a % of the total share capital of the Company) |
0.00% |
0.00% |
0.00% |
|
|
b) Non-encumbered |
|
|
|
|
|
-Number of shares |
180622264 |
180625264 |
180622264 |
|
|
-Percentage of shares (as a u u of the total shareholding of promoter and promoter group) |
99.99% |
99.99% |
99.99% |
|
1 |
-Percentage of shares (as a % of the total share capital of |
63.78% |
63.78% |
63.78% |
|
|
Particulars |
Quarter Ended 31.03.2014 |
|
B |
Investor
complaints |
|
|
|
Pending at the beginning of the quarter |
- |
|
|
Received during the quarter |
5 |
|
|
Disposed of during the quarter |
4 |
|
|
Remaining unresolved at the end of the quarter |
1 |
|
SOURCES
OF FUNDS |
31.03.2014 |
|
I.
EQUITY AND LIABILITIES |
|
|
(1)Shareholders' Funds |
|
|
(a) Share Capital |
263.200 |
|
Share capital suspense |
2.600 |
|
(b) Reserves & Surplus |
22047.400 |
|
|
22313.200 |
|
Minority Interest |
|
|
(3) Non-Current Liabilities |
|
|
(a) long-term borrowings |
2313.200 |
|
(b) Deferred tax liabilities
(Net) |
1868.600 |
|
(c) Other long term
liabilities |
300.900 |
|
(d) long-term provisions |
171.100 |
|
|
4653.800 |
|
(4) Current Liabilities |
|
|
(a) Short term borrowings |
11617.400 |
|
(b) Trade payables |
25724.200 |
|
(c) Other current liabilities |
4548.800 |
|
(d) Short-term provisions |
1745.900 |
|
|
43636.300 |
|
|
|
|
TOTAL |
70623.300 |
|
|
|
|
II.
ASSETS |
|
|
(1) Non-current assets |
|
|
(a) Fixed Assets |
12380.300 |
|
(b) Goodwill on consolidation |
0.000 |
|
(b) Non-current Investments |
7438.300 |
|
(d) Long-term Loan and Advances |
576.800 |
|
|
20395.400 |
|
(2) Current assets |
|
|
(a) Current investments |
1.800 |
|
(b) Inventories |
16714.000 |
|
(c) Trade receivables |
12941.400 |
|
(d) Cash and cash equivalents |
4570.300 |
|
(e) Short-term loans and
advances |
15860.500 |
|
(f) Other current assets |
139.900 |
|
|
50227.900 |
|
|
|
|
TOTAL |
70623.300 |
Note:
The above financial results are drawn in accordance with the
accounting policies consistently followed by the Company.
The above results were reviewed and recommended by the Audit Committee and
approved by the Board of Directors at their meeting held on May 12, 2014.
The Board of Directors at their meeting held on May 12, 2014 have recommended a
dividend of Rs. 4.50/- per share (450% on face value of Rs. 1/- share).
During the quarter, pursuant to the exercise of stock options by certain
employees under the 'ESOP 2007' scheme, the Company has allotted 12,000
(Quarter ended March 31, 2013: 108,600) equity shares of Rs. 1 each at the
respective exercise price.
During the year, the Board of Directors of the Company, LPL and LUL in their
respective meetings held on September 28, 2013 approved a Scheme of
Amalgamation under Sections 391 and 394 of the Companies Act, 1956 ('the
Scheme') for amalgamation of LPL and LUL with the Company. Pursuant to the
Scheme sanctioned by the Hon’ble High Court of Judicature of Andhra Pradesh
vide its Order dated April 07, 2014 and by the Hon’ble High Court of Judicature
of Gujarat vide its order dated April 24, 2014, the entire business undertaking
of LPL and LUL including all assets and properties, debts, liabilities and duties
and obligations have been transferred to and vested in the Company
retrospectively with effect from April 01, 2013 (the Appointed Date as per the
Scheme). The certified copies of the aforesaid High Court Orders have been
filed with respective Registrar of Companies and the Scheme has been given
effect to in these financial results.
In terms of the scheme, on the record date to be fixed, the Company is required
to allot 25,74,193 equity shares of Rs. 1 each as fully paid up to the public
shareholders of LPL in the proportion of 7 equity shares of Rs. 1 each in the
Company for every 8 equity shares of Rs. 10 each held in LPL, LUL being a
wholly-owned subsidiary of the Company, no equity shares will be issued. The
equity shares held by the Company in LPL totaling 1,14,96,267 and LUL totaling
29,97,552 shall accordingly get extinguished and anulled.
The Amalgamation has been accounted for under the ‘Pooling of interests method’
as prescribed under Accounting Standard 14 ‘Accounting for Amalgamations’ and
has been effected in the financial statements. Pursuant to the Scheme, the
difference between the net assets acquired and cost of investments of the
Company together with the shares to be issued to the shareholders of LPL
amounting to Rs. 1370.800 milllions has been adjusted in the Reserves.
Consequent to giving effect to the Scheme during the quarter ended March 31,
2014, the standalone figures relating to this quarter include 12 months'
figures of LPL and LUL. The summary of the standalone figures relating to the
quarter ended March 31, 2014 including those relating to LPL and LUL for the
same quarter is given in Note
Minority interest as appearing in the Part-I to the consolidated results for
the quarter ended March 31, 2014 has been accordingly adjusted to give effect
of the Scheme.
During the quarter, the Company entered into a Business Transfer Agreement
(BTA) and acquired the Business undertaking of M/s. Tungabhadra Fertilizers and
Chemicals Company Limited (TFCCL), as a going concern on a slump sale basis.
The Board of Directors of the Company and its subsidiary, Sabero Organics
Gujarat Limited (“Sabero”) , in their meetings held on January 24, 2014
approved a Scheme of Amalgamation under Sections 391 and 394 of the Companies
Act, 1956 ('the Scheme') for amalgamation of Sabero with the Company subject to
the approvals of the stock exchanges, the respective shareholders and
creditors, the concerned High Courts and other regulators. The Company has
received their no-objection to the Scheme from the stock exchanges and has
filed application before the concerned High courts for convening the
shareholders and creditors meetings. As per the Scheme, the Appointed /
Transfer date for amalgamation is April 01, 2014 and on the Record Date to be
fixed after receipt of all approvals, the shareholders of Sabero shall be
issued 5 equity shares of Rs. 1 each in the Company for every 8 equity shares
of Rs.10 each held in Sabero. The shares held by the Company in Sabero shall
accordingly get extinguished.
Exceptional item represents interest demand in respect of disputed taxes
relating to earlier years.
The Company has recognised subsidy income as per the prevalent Nutrient Based
Subsidy Policy (NBS). Net sales/ income from operations for the quarter and
year ended March 31, 2014 includes Rs. Nil and Rs. 348.800 millions
respectively (quarter and year ended March 31, 2013: Rs. 14.700 millions and
Rs. 1088.400 millions respectively) relating to earlier periods.
During the quarter, the Company has exercised the option to prepay the bonus
debentures and accordingly the said debentures were redeemed at par during the
quarter. Consequently, the debenture redemption reserve of Rs. 255.300 millions
created in the previous year has been transferred to the surplus in the Statement
of Profit and Loss.
The Consolidated Results for the quarter and year ended March 31, 2014 include
consolidated results of subsidiaries - Sabero Organics Gujarat Limited, its
subsidiaries and associate, results of wholly-owned subsidiaries - Liberty Pesticides
and Fertilisers Limited, Parry Chemicals Limited, Dare Investments Limited, CFL
Mauritius Limited, Coromandel Brasil Limited and Joint venture Companies -
Coromandel Getax Phosphates Pte Limited, Coromandel SQM (India) Private Limited
and TIFERT upto March 31, 2013.
During the quarter and year ended March 31, 2014, certain entities of the Group
have hedged the risk of fluctuation in foreign currency arising from certain
contracted export sales by entering into foreign currency forward contracts. In
respect of such foreign currency forward contracts, those entities have applied
hedge accounting principles of Accounting Standard 30 "Financial
Instruments: Recognition and Measurement" (AS 30). Accordingly,
mark-to-market effect of Rs. Nil on such forward contracts as on March 31, 2014
has been debited to Hedging reserve.
The Company, its subsidiaries and its joint ventures are primarily engaged in
the farm inputs business, which in the context of Accounting Standard 17, is
considered the only significant business segment.
The figures of the current quarter and quarter ended March 31, 2013 are the
balancing figures between the audited figures of the full financial year ended
March 31, 2014 and March 31, 2013, respectively and the published year to date figures
upto third quarter ended December 31, 2013 and December 31, 2012, respectively.
Figures of the previous quarters / period / year have been regrouped and
reclassified, wherever considered necessary to correspond with current period
presentation.
|
|
PARTICULARS |
31.03.2014 |
|
|
SALES |
|
|
|
Income |
20176.800 |
|
|
Other Income |
136.200 |
|
|
TOTAL
(A) |
20313.000 |
|
|
|
|
|
Less |
EXPENSES |
|
|
|
Cost of Materials Consumed |
4151.100 |
|
|
Purchases of Stock-in-Trade |
1375.700 |
|
|
Changes in inventories of
finished goods, work-in-progress and Stock-in-Trade |
2460.400 |
|
|
Employees benefits expense |
600.000 |
|
|
Depreciation/
Amortisation |
181.400 |
|
|
Freight and distributors expenses
|
1324.000 |
|
|
Other expenses |
1774.000 |
|
|
TOTAL
(B) |
11866.600 |
|
|
|
|
|
Less |
Profit from operations before other income, finance costs
and exceptional items (1-2) |
1446.400 |
|
|
Other income |
190.800 |
|
Less |
Profit before finance costs and exceptional items (3+4) |
1637.200 |
|
|
Finance costs |
496.800 |
|
|
Profit after finance costs but before exceptional items
(5-6) |
1140.400 |
|
|
Exceptional items |
-- |
|
Less/
Add |
Profit before tax (7+8) |
373.600 |
|
|
Tax expense |
766.800 |
|
|
|
|
|
18 |
Earnings
per share (of 71 each) (for the period - not annualised) |
|
|
|
-
Basic (7) |
2.67 |
|
|
-
Diluted (7) |
2.66 |
FIXED ASSETS:
·
Land
·
Buildings
·
Railway siding
·
Plant and equipment
·
Office equipment
·
Furniture and fixtures
·
Vehicles
CMT REPORT (Corruption, Money Laundering & Terrorism]
The Public Notice information has been collected from various sources
including but not limited to: The Courts,
1] INFORMATION ON
DESIGNATED PARTY
No exist designating subject or any of its beneficial owners,
controlling shareholders or senior officers as terrorist or terrorist
organization or whom notice had been received that all financial transactions
involving their assets have been blocked or convicted, found guilty or against
whom a judgement or order had been entered in a proceedings for violating
money-laundering, anti-corruption or bribery or international economic or
anti-terrorism sanction laws or whose assets were seized, blocked, frozen or
ordered forfeited for violation of money laundering or international
anti-terrorism laws.
2] Court Declaration :
No records exist to suggest that subject is
or was the subject of any formal or informal allegations, prosecutions or other
official proceeding for making any prohibited payments or other improper
payments to government officials for engaging in prohibited transactions or
with designated parties.
3] Asset Declaration :
No records exist to suggest that the property or assets of the subject
are derived from criminal conduct or a prohibited transaction.
4] Record on Financial
Crime :
Charges or conviction
registered against subject: None
5] Records on Violation of
Anti-Corruption Laws :
Charges or
investigation registered against subject: None
6] Records on Int’l
Anti-Money Laundering Laws/Standards :
Charges or
investigation registered against subject: None
7] Criminal Records
No
available information exist that suggest that subject or any of its principals
have been formally charged or convicted by a competent governmental authority
for any financial crime or under any formal investigation by a competent
government authority for any violation of anti-corruption laws or international
anti-money laundering laws or standard.
8] Affiliation with
Government :
No record
exists to suggest that any director or indirect owners, controlling
shareholders, director, officer or employee of the company is a government official
or a family member or close business associate of a Government official.
9] Compensation Package :
Our market
survey revealed that the amount of compensation sought by the subject is fair
and reasonable and comparable to compensation paid to others for similar
services.
10] Press Report :
No press reports / filings exists on
the subject.
CORPORATE GOVERNANCE
MIRA INFORM as part of its Due Diligence do provide comments on Corporate
Governance to identify management and governance. These factors often have been
predictive and in some cases have created vulnerabilities to credit
deterioration.
Our Governance Assessment focuses principally on the interactions
between a company’s management, its Board of Directors, Shareholders and other
financial stakeholders.
CONTRAVENTION
Subject is not known to have contravened any existing local laws,
regulations or policies that prohibit, restrict or otherwise affect the terms
and conditions that could be included in the agreement with the subject.
FOREIGN EXCHANGE RATES
|
Currency |
Unit
|
Indian Rupees |
|
US Dollar |
1 |
Rs. 58.59 |
|
|
1 |
Rs. 98.66 |
|
Euro |
1 |
Rs. 79.81 |
INFORMATION DETAILS
|
Information Gathered
by : |
SVA |
|
|
|
|
Analysis Done by
: |
SUB |
|
|
|
|
Report Prepared
by : |
DPH |
SCORE & RATING EXPLANATIONS
|
SCORE FACTORS |
RANGE |
POINTS |
|
HISTORY |
1~10 |
7 |
|
PAID-UP CAPITAL |
1~10 |
6 |
|
OPERATING SCALE |
1~10 |
6 |
|
FINANCIAL CONDITION |
|
|
|
--BUSINESS SCALE |
1~10 |
6 |
|
--PROFITABILIRY |
1~10 |
6 |
|
--LIQUIDITY |
1~10 |
6 |
|
--LEVERAGE |
1~10 |
6 |
|
--RESERVES |
1~10 |
7 |
|
--CREDIT LINES |
1~10 |
7 |
|
--MARGINS |
-5~5 |
- |
|
DEMERIT POINTS |
|
|
|
--BANK CHARGES |
YES/NO |
YES |
|
--LITIGATION |
YES/NO |
NO |
|
--OTHER ADVERSE INFORMATION |
YES/NO |
NO |
|
MERIT POINTS |
|
|
|
--SOLE DISTRIBUTORSHIP |
YES/NO |
NO |
|
--EXPORT ACTIVITIES |
YES/NO |
NO |
|
--AFFILIATION |
YES/NO |
YES |
|
--LISTED |
YES/NO |
YES |
|
--OTHER MERIT FACTORS |
YES/NO |
YES |
|
DEFAULTER |
|
|
|
--RBI |
YES/NO |
NO |
|
--EPF |
YES/NO |
NO |
|
TOTAL |
|
57 |
This score serves as a reference to assess SC’s credit risk
and to set the amount of credit to be extended. It is calculated from a
composite of weighted scores obtained from each of the major sections of this
report. The assessed factors and their relative weights (as indicated through
%) are as follows:
Financial
condition (40%) Ownership
background (20%) Payment
record (10%)
Credit history
(10%) Market trend
(10%) Operational
size (10%)
RATING EXPLANATIONS
|
RATING |
STATUS |
PROPOSED CREDIT LINE |
|
|
>86 |
Aaa |
Possesses an extremely
sound financial base with the strongest capability for timely payment of
interest and principal sums |
Unlimited |
|
71-85 |
Aa |
Possesses adequate
working capital. No caution needed for credit transaction. It has above
average (strong) capability for payment of interest and principal sums |
Large |
|
56-70 |
A |
Financial &
operational base are regarded healthy. General unfavourable factors will not
cause fatal effect. Satisfactory capability for payment of interest and principal
sums |
Fairly
Large |
|
41-55 |
Ba |
Overall operation is
considered normal. Capable to meet normal commitments. |
Satisfactory |
|
26-40 |
B |
Capability to overcome
financial difficulties seems comparatively below average. |
Small |
|
11-25 |
Ca |
Adverse factors are
apparent. Repayment of interest and principal sums in default or expected to
be in default upon maturity |
Limited
with full security |
|
<10 |
C |
Absolute credit risk
exists. Caution needed to be exercised |
Credit
not recommended |
|
-- |
NB |
New
Business |
-- |
This report is issued at your request without any
risk and responsibility on the part of MIRA INFORM PRIVATE LIMITED (MIPL)
or its officials.