MIRA INFORM REPORT
|
Report Date : |
29.05.2014 |
IDENTIFICATION DETAILS
|
Name : |
NOXON STAINLESS B.V. |
|
|
|
|
Registered Office : |
Vossenbeend 51, 5705 CL Helmond |
|
|
|
|
Country : |
Netherlands |
|
|
|
|
Financials (as on) : |
31.12.2012 |
|
|
|
|
Date of Incorporation : |
21.06.1990 |
|
|
|
|
Com. Reg. No.: |
KvK-Nummer: 17069403 |
|
|
|
|
Legal Form : |
Private Company |
|
|
|
|
Line of Business : |
Wholesale of Ferrous Metals and Ferrous Semi-Finished Products |
|
|
|
|
No. of Employees : |
81 |
RATING & COMMENTS
|
MIRA’s Rating : |
Ba |
|
RATING |
STATUS |
PROPOSED CREDIT LINE |
|
|
41-55 |
Ba |
Overall operation is considered normal. Capable to meet normal
commitments. |
Satisfactory |
|
Status : |
Satisfactory |
|
|
|
|
Payment Behaviour : |
No Complaints |
|
|
|
|
Litigation : |
Clear |
NOTES:
Any query related to this report can be made
on e-mail : infodept@mirainform.com
while quoting report number, name and date.
ECGC Country Risk Classification List – March 31, 2014
|
Country Name |
Previous Rating (31.12.2013) |
Current Rating (31.03.2014) |
|
Netherlands |
A1 |
A1 |
|
Risk Category |
ECGC
Classification |
|
Insignificant |
A1 |
|
Low Risk |
A2 |
|
Moderate Low Risk |
B1 |
|
Moderate Risk |
B2 |
|
Moderate High Risk |
C1 |
|
High Risk |
C2 |
|
Very High Risk |
D |
NETHERLANDS - ECONOMIC OVERVIEW
Netherlands is the
sixth-largest economy in the euro-zone and is noted for its stable industrial
relations, moderate unemployment and inflation, sizable trade surplus, and important
role as a European transportation hub. Industrial activity is predominantly in
food processing, chemicals, petroleum refining, and electrical machinery. A
highly mechanized agricultural sector employs only 2% of the labor force but
provides large surpluses for the food-processing industry and for exports.
Netherlands, along with 11 of its EU partners, began circulating the euro
currency on 1 January 2002. The Dutch financial sector suffered as a result of
the global financial crisis, due in part to the high exposure of some Dutch
banks to US mortgage-backed securities. In 2008, the government nationalized
two banks and injected billions of dollars of capital into other financial
institutions, to prevent further deterioration of a crucial sector. After 26
years of uninterrupted economic growth, the Dutch economy - highly dependent on
an international financial sector and international trade - contracted by 3.5%
in 2009. To recover, the government sought to boost the domestic economy by
accelerating infrastructure programs, offering corporate tax breaks for
employers to retain workers, and expanding export credit facilities. The
stimulus programs and bank bailouts, however, resulted in a government budget
deficit of 5.3% of GDP in 2010 that contrasted sharply with a surplus of 0.7%
in 2008. The government of Prime Minister Mark RUTTE began implementing
austerity measures in early 2011, mainly reducting expenditures, which resulted
in an improved budget deficit in 2011. However, in 2012 tax revenues dropped,
GDP contracted, and the budget deficit deteriorated. In 2013, the government
budget deficit decreased to 3.3% of GDP due to increased government revenue
from higher taxes. However, spending on social benefits also increased, due to
a rise in unemployment benefits and payments for pensions. The high
unemployment rate and tax increases have contributed to continued decreases in
household disposable income, causing the Dutch economy to contract.
|
Source
: CIA |
Summary
Company name Noxon Stainless
B.V.
Operative address Vossenbeemd 51
5705CL Helmond
Netherlands
Legal form Private
Company
Registration number KvK-nummer:
17069403
VAT-number 008537343
|
Year |
2012 |
|
Mutation |
2011 |
|
Mutation |
2010 |
|
Fixed
assets |
1.129.000 |
% |
-23,97 |
1.485.000 |
|
-21,09 |
1.882.000 |
|
Total
receivables |
4.778.000 |
% |
-17,15 |
5.767.000 |
|
-8,76 |
6.321.000 |
|
|
|||||||
|
Total
equity |
4.398.000 |
|
5,82 |
4.156.000 |
|
7,95 |
3.850.000 |
|
Short term
liabilities |
12.705.000 |
% |
-18,14 |
15.520.000 |
|
4,51 |
14.850.000 |
|
|
|||||||
|
Net result |
242.000 |
% |
-20,92 |
306.000 |
|
115,51 |
-1.973.000 |
|
|
|||||||
|
Working
capital |
3.651.000 |
|
14,42 |
3.191.000 |
|
20,87 |
2.640.000 |
|
Quick ratio |
0,38 |
|
2,70 |
0,37 |
|
-13,95 |
0,43 |
Contact information
Company name Noxon Stainless
B.V.
Trade names Noxon Stainless
B.V.
Operative address Vossenbeemd 51
5705CL Helmond
Netherlands
Correspondence address Postbus 6096
5700ET Helmond
Netherlands
Telephone number 0492582111
Fax number 0492538970
Email address info@noxonstainless.nl
Website www.noxon.nl
Registration
Registration number KvK-nummer:
17069403
Branch number 000017851777
VAT-number 008537343
Status Active
First registration
company register 1991-09-17
Memorandum 1991-07-18
Establishment date 1990-06-21
Legal form Private
Company
Last proposed admendment 2012-11-23
Activities
SBI Wholesale of
ferrous metals and ferrous semi-finished products (46722)
ISO certified Yes
Exporter No
Importer No
Goal Groothandel in
roestvrijstalen halffabrikaten en aanverwante artikelen
Relations
Shareholders Naam: Stappert
Deutschland GmbH
Bezoekadres: Willstätter Strasse 13, 40549
Düsseldorf, Bondsrepubliek Duitsland
Ingeschreven in: Handelsregister
Handelsregister B des amtsgerichts Düsseldorf,
Bondsrepubliek Duitsland onder nummer HRB 20
Enig aandeelhouder sedert: 21-12-2011 (datum
registratie: 29-12-2011)
Companies on same address Noxon
Personeelsvereniging
Registration
number: 544229810000
Management
Active management
T.R.A. Philippe (Thierry
Robert Arthur)
Netherlands
Competence: Fully authorized
Function: Manager
Starting date: 2012-11-23
Date of birth: 1975-07-02,
Toulouse, FR
S. Muller-Bernhardt (Stefan)
Netherlands
Competence: Jointly
authorized
Function: Manager
Starting date: 2012-11-23
Date of birth: 1965-06-22,
Munchen, NL
E.M. Jacquet (Eric Michel)
Netherlands
Function: Commissaris
Starting date: 2010-07-01
Date of birth: 1959-01-09,
Lyon, FR
P. Goczol (Philippe)
Netherlands
Function: Commissaris
Starting date: 2010-07-01
Date of birth: 1965-12-05,
Mons, BE
P.M.P. de Groot (Paulus
Martinus Petrus)
Netherlands
Competence: Limited
authorization
Function: Proxy
Starting date: 2013-10-28
Date of birth: 1969-01-27,
Asten, NL
M. Dankers (Mark)
Netherlands
Competence: Limited
authorization
Function: Proxy
Starting date: 2013-10-28
Date of birth: 1972-12-26,
Helmond, NL
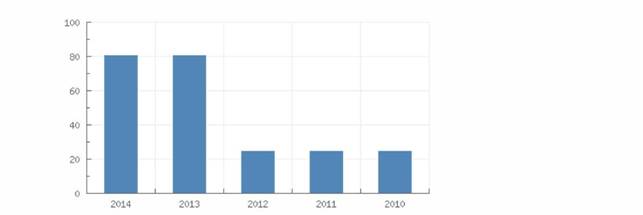
Employees
Total according to the
Chamber of Commerce 81
|
Year |
2014 |
2013 |
2012 |
2011 |
2010 |
|
Total |
81 |
81 |
25 |
25 |
25 |
Payments
Description
Payments
made under regular condition
Key figures
|
Year |
2012 |
2011 |
2010 |
2009 |
2008 |
|
Quick ratio |
0,38 |
0,37 |
0,43 |
0,51 |
0,71 |
|
Current
ratio |
1,29 |
1,21 |
1,18 |
1,49 |
2,16 |
|
|
|||||
|
Working
capital/ balance total |
0,21 |
0,16 |
0,14 |
0,29 |
0,47 |
|
Equity /
balance total |
0,25 |
0,21 |
0,20 |
0,34 |
0,51 |
|
Equity /
Fixed assets |
3,90 |
2,80 |
2,05 |
3,33 |
4,22 |
|
Equity /
liabilities |
0,34 |
0,26 |
0,26 |
0,52 |
1,04 |
|
Balance
total / liabilities |
1,34 |
1,26 |
1,29 |
1,52 |
2,04 |
|
|
|||||
|
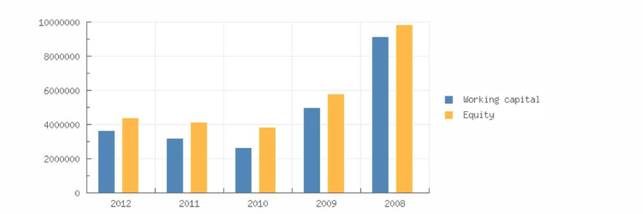
Working
capital |
3.651.000 |
3.191.000 |
2.640.000 |
5.024.246 |
9.147.172 |
|
Equity |
4.398.000 |
4.156.000 |
3.850.000 |
5.823.458 |
9.870.344 |
|
Mutation
equity |
5,82 |
7,95 |
-33,89 |
-41,00 |
17,66 |
|
Mutation short
term liabilities |
-18,14 |
4,51 |
43,86 |
31,15 |
-41,87 |
|
|
|||||
|
Return on
total assets (ROA) |
1,85 |
2,02 |
-13,77 |
-34,01 |
7,74 |
|
Return on
equity (ROE) |
7,34 |
9,82 |
-69,27 |
-99,82 |
15,17 |
|
Gross
profit margin |
1,52 |
1,71 |
-5,71 |
-23,18 |
-0,63 |
|
Net profit
margin |
0,56 |
0,69 |
-4,97 |
-17,14 |
3,59 |
|
|
|||||
|
Average
collection ratio |
3,39 |
2,87 |
2,67 |
2,36 |
5,73 |
|
Average
payment ratio |
9,00 |
7,72 |
6,28 |
4,67 |
8,18 |
|
Equity
turnover ratio |
9,78 |
10,71 |
10,31 |
4,19 |
4,57 |
|
Total
assets turnover ratio |
2,46 |
2,20 |
2,05 |
1,43 |
2,33 |
|
Fixed
assets turnover ratio |
38,10 |
29,97 |
21,09 |
13,97 |
19,30 |
|
Inventory
conversion ratio |
3,72 |
3,44 |
3,56 |
2,42 |
3,95 |
|
|
|||||
|
Turnover |
43.020.000 |
44.510.000 |
39.689.000 |
24.404.364 |
45.134.615 |
|
Gross
margin |
9.210.000 |
9.849.000 |
|
2.339.114 |
7.219.146 |
|
Operating
result |
655.000 |
759.000 |
-2.267.000 |
-5.657.761 |
-283.134 |
|
Net result
after taxes |
242.000 |
306.000 |
-1.973.000 |
-4.183.498 |
1.618.374 |
|
Noxon
Stainless B.V. |
23-05-2014 |
|
|
|
Applicant |
|
Year |
2012 |
2011 |
2010 |
2009 |
2008 |
|
|
|||||
|
Cashflow |
483.000 |
600.000 |
-1.412.000 |
-3.766.510 |
2.026.295 |
|
Gross profit |
|
|
39.689.000 |
|
|
|
EBIT |
655.000 |
759.000 |
-2.267.000 |
-5.657.761 |
-283.134 |
|
EBITDA |
896.000 |
1.053.000 |
-1.706.000 |
-5.240.773 |
124.787 |
SUMMARY
The 2012 financial result
structure is a postive working captial of 3.651.000 euro, which is in agreement
with 21 % of the total assets of the company.
The working capital
has increased with 14.42 % compared to previous year. The ratio, with respect
to the total assets of the company has however, increased.
The improvement
between 2011 and 2012 has mainly been caused by an increase of the current
assets.
The current ratio of
the company in 2012 was 1.29. When the current ratio is below 1.5, the company
may have problems meeting its short-term obligations.
The quick ratio in
2012 of the company was 0.38. A company with a Quick Ratio of less than 1
cannot currently pay back its current liabilities.
The 2011 financial
result structure is a postive working captial of 3.191.000 euro, which is in
agreement with 16 % of the total assets of the company.
The working capital
has increased with 20.87 % compared to previous year. The ratio, with respect
to the total assets of the company has however, increased.
The improvement
between 2010 and 2011 has mainly been caused by an increase of the current
assets.
The current ratio of
the company in 2011 was 1.21. When the current ratio is below 1.5, the company
may have problems meeting its short-term obligations.
The quick ratio in
2011 of the company was 0.37. A company with a Quick Ratio of less than 1
cannot currently pay back its current liabilities.
Financial statement
Type of annual account Corporate
Annual account Noxon Stainless
B.V.
Vossenbeemd 51
5705CL Helmond
Netherlands
Registration
number: 170694030000
Balance
|
Year |
2012 |
2011 |
2010 |
2009 |
2008 |
|
End date |
2012-12-31 |
2011-12-31 |
2010-12-31 |
2009-12-31 |
2008-12-31 |
|
Other
tangible fixed assets |
|
|
1.110.000 |
|
|
|
Tangible fixed assets |
598.000 |
818.000 |
1.110.000 |
1.607.705 |
2.016.888 |
|
Other
financial fixed assets |
|
|
773.000 |
|
|
|
Financial fixed assets |
531.000 |
667.000 |
773.000 |
138.720 |
322.293 |
|
Fixed assets |
1.129.000 |
1.485.000 |
1.882.000 |
1.746.425 |
2.339.181 |
|
|
|||||
|
Other stock |
|
|
11.154.000 |
|
|
|
Total stock |
11.577.000 |
12.932.000 |
11.154.000 |
10.095.983 |
11.439.330 |
|
Accounts
receivable |
4.350.000 |
5.480.000 |
5.814.000 |
3.081.994 |
5.019.800 |
|
Other
receivables |
428.000 |
287.000 |
507.000 |
2.147.122 |
497.099 |
|
Total receivables |
4.778.000 |
5.767.000 |
6.321.000 |
5.229.116 |
5.516.899 |
|
Liquid
funds |
1.000 |
12.000 |
15.000 |
21.935 |
61.753 |
|
accruals |
|
|
507.000 |
|
|
|
Current assets |
16.356.000 |
18.711.000 |
17.490.000 |
15.347.034 |
17.017.982 |
|
Total assets |
17.485.000 |
20.196.000 |
19.373.000 |
17.093.459 |
19.357.163 |
|
|
|||||
|
Issued capital |
2.632.000 |
2.632.000 |
2.632.000 |
2.631.925 |
2.631.925 |
|
Other
reserves |
1.766.000 |
1.524.000 |
1.218.000 |
3.191.533 |
7.238.419 |
|
Total reserves |
1.766.000 |
1.524.000 |
1.218.000 |
3.191.533 |
7.238.419 |
|
Total equity |
4.398.000 |
4.156.000 |
3.850.000 |
5.823.458 |
9.870.344 |
|
|
|||||
|
Provisions |
382.000 |
415.000 |
462.000 |
620.719 |
789.084 |
|
Long term
interest yielding debt |
|
105.000 |
|
326.494 |
826.925 |
|
Other long
term liabilities |
|
|
210.000 |
|
|
|
Long term liabilities |
|
105.000 |
210.000 |
326.494 |
826.925 |
|
Accounts payable |
3.009.000 |
6.933.000 |
3.846.000 |
3.806.501 |
4.018.167 |
|
Other short
term liabilities |
9.696.000 |
8.587.000 |
11.005.000 |
6.516.287 |
3.852.643 |
|
Short term liabilities |
12.705.000 |
15.520.000 |
14.850.000 |
10.322.788 |
7.870.810 |
|
Total short and long term
liabilities |
13.087.000 |
16.040.000 |
15.060.000 |
11.270.001 |
9.486.819 |
|
Total liabilities |
17.485.000 |
20.196.000 |
19.373.000 |
17.093.459 |
19.357.163 |
SUMMARY
The total assets of the company decreased with -13.42 % between 2011 and
2012.
This downturn is mainly retrievable in the fixed asset decrease of
-23.97 %.
The asset reduction is in contrast with the equity growth of 5.82 %. Due
to this the total debt decreased with -18.41 %.
In 2012 the assets of the company were 6.46 % composed of fixed assets
and 93.54 % by current assets. The assets are being financed by an equity of
25.15 %, and total debt of 74.85 %.
The total assets of the company increased with 4.25 % between 2010 and
2011.
Despite the assets growth, the non current assets decreased with -21.09
%.
The asset growth has mainly been financed by a Net Worth increase of
7.95 %. Debt, however, grew with 6.51 %.
In 2011 the assets of the company were 7.35 % composed of fixed assets
and 92.65 % by current assets. The assets are being financed by an equity of
20.58 %, and total debt of 79.42 %.
Profit and loss
|
Year |
2012 |
2011 |
2010 |
2009 |
2008 |
|
Revenues |
43.020.000 |
44.510.000 |
39.689.000 |
24.404.364 |
45.134.615 |
|
Net turnover |
43.020.000 |
44.510.000 |
39.689.000 |
24.404.364 |
45.134.615 |
|
|
|||||
|
Gross margin |
9.210.000 |
9.849.000 |
|
2.339.114 |
7.219.146 |
|
|
|||||
|
Wages and
salaries |
3.938.000 |
4.635.000 |
5.615.000 |
3.710.732 |
2.781.854 |
|
Amorization
and depreciation |
241.000 |
294.000 |
561.000 |
416.988 |
407.921 |
|
Sales |
33.810.000 |
34.661.000 |
|
22.065.250 |
37.915.469 |
|
other
operating costs |
4.376.000 |
4.161.000 |
5.071.000 |
3.869.155 |
4.312.505 |
|
Raw
materials and consumables |
|
|
30.709.000 |
|
|
|
Operating
expenses |
42.365.000 |
43.751.000 |
41.956.000 |
30.062.125 |
45.417.749 |
|
Result in
subsidiaries |
|
|
|
|
2.128.955 |
|
Operating result |
655.000 |
759.000 |
-2.267.000 |
-5.657.761 |
-283.134 |
|
|
|||||
|
Financial
income |
|
161.000 |
129.000 |
|
|
|
Financial
expenses |
332.000 |
512.000 |
528.000 |
155.380 |
|
|
Year |
2012 |
2011 |
2010 |
2009 |
2008 |
|
Financial
result |
-332.000 |
-351.000 |
-400.000 |
-155.380 |
-348.524 |
|
Result on ordinary operations
before taxes |
323.000 |
408.000 |
-2.667.000 |
-5.813.141 |
1.497.297 |
|
|
|||||
|
Taxation on
the result of ordinary activities |
81.000 |
102.000 |
-657.000 |
-1.629.643 |
-121.077 |
|
Result of ordinary activities after
taxes |
242.000 |
306.000 |
-2.009.000 |
-4.183.498 |
1.618.374 |
|
|
|||||
|
Extraordinary
income |
|
|
36.000 |
|
|
|
Extraordinary
result after taxation |
|
|
36.000 |
|
|
|
Net result |
242.000 |
306.000 |
-1.973.000 |
-4.183.498 |
1.618.374 |
SUMMARY
The turnover of the company decreased by -3.35 % between 2011 and 2012.
The gross profit of the company decreased by -6.49 % between 2011 and 2012.
The operating result of the company declined with -13.7 % between 2011 and 2012. This evolution implies an decrease of the company's economic profitability.
The result of these changes is a reduction of the company's Economic Profitability of -8.42 % of the analysed period, being equal to 2011 % in the year 2012.
Despite the decline the assets turnover increased by 11.82 % reaching 2.46.
The Net Result of the company increased by -20.92 % between 2011 and 2012.
The company's Financial Profitability has been positively affected by the financial activities in comparison to the EBITs behaviour. The result of these variations is a profitability increase of -25.25 % of the analysed period, being 7.34 % in the year 2012.
The company's financial profitability has been positively affected by its financial structure.
The turnover of the company grew with 12.15 % between 2010 and 2011.
The operating result of the company grew with 133.48 % between 2010 and 2011. This evolution implies an increase of the company's economic profitability.
The result of these changes is an increase of the company's Economic Profitability of 114.67 % of the analysed period, being equal to 2010 % in the year 2011.
This growth has contributed to the increase in assets turnover, increasing by 7.32 % reaching 2.2.
The Net Result of the company decreased by 115.51 % between 2010 and 2011.
The company's Financial Profitability has been positively affected by the financial activities in comparison to the EBITs behaviour. The result of these variations is a profitability increase of 114.18 % of the analysed period, being 9.82 % in the year 2011.
The company's financial structure has slowed down its
financial profitability.
Analysis
Branch (SBI) Wholesale trade (no motor vehicles and motorcycles)
(46)
Region Zuid-Oost-Brabant
In
the Netherlands 109662 of the companies are registered with the SBI code 46
In
the region Zuid-Oost-Brabant 5034 of the companies are registered with the SBI
code 46
In
the Netherlands 2387 of the bankrupcties are published within this sector
In
the region Zuid-Oost-Brabant 97 of the bankruptcies are published within this
sector
The
risk of this specific sector in the Netherlands is normal
The
risk of this specific sector in the region Zuid-Oost-Brabant is normal
Publications
Filings
06-08-2013: De jaarrekening over 2012 is gepubliceerd.
14-11-2012: De jaarrekening over 2011 is gepubliceerd.
08-08-2011: De jaarrekening over 2010 is gepubliceerd.
25-01-2011: De jaarrekening over 2009 is gepubliceerd.
15-02-2010: De jaarrekening over 2008 is gepubliceerd.
Functions
04-11-2013: Per
28-10-2013 is gevolmachtigde Mark Dankers in functie getreden.
29-10-2013: Per 28-10-2013 is gevolmachtigde Paulus Martinus Petrus de
Groot in functie getreden.
24-10-2013: Per 10-10-2013 is bestuurder Antonius Cornelis Elisabeth van
der Heijden uit functie getreden.
03-12-2012: Per 23-11-2012 is commissaris Thierry Robert Arthur Philippe
uit functie getreden.
27-11-2012: Per 23-11-2012 is bestuurder Stefan Muller-Bernhardt in
functie getreden.
27-11-2012: Per 23-11-2012 is bestuurder Thierry Robert Arthur Philippe
in functie getreden.
31-01-2012: Per 19-01-2012 is gevolmachtigde Cornelis Nicolaas van
Lieshout uit functie getreden.
31-01-2012: Per 19-01-2012 is gevolmachtigde Léon Gerardus Antonius
Honings uit functie getreden.
31-01-2012: Per 31-01-2012 is gevolmachtigde Arie Buis uit functie
getreden.
31-01-2012: Per 31-01-2012 is gevolmachtigde Peter Christiaan Kom uit
functie getreden.
27-09-2010: Per 01-07-2010 is commissaris Thierry Robert Arthur Philippe
in functie getreden.
27-09-2010: Per 01-07-2010 is commissaris Philippe Goczol in functie
getreden.
27-09-2010: Per 01-07-2010 is commissaris Eric Michel Jacquet in functie
getreden.
27-09-2010: Per 01-07-2010 is commissaris Philippe Georges Brun uit
functie getreden.
27-09-2010: Per 01-07-2010 is commissaris Pierre-Yves Marie Le Daëron
uit functie getreden.
Amendments
27-11-2012: Geplaatst kapitaal gewijzigd in EUR 2.610.000,00 Gestort
kapitaal gewijzigd in EUR 2.610.000,00.
27-11-2012: Per 23-11-2012 is de bevoegdheid van Bestuurder Antonius
Cornelis Elisabeth van der Heijden gewijzigd.
27-11-2012: Per 23-11-2012 statuten gewijzigd.
Company structure
Relations 2
IMS International Metal service
Le Carr
92733 Nanterre
France
• Noxon Stainless B.V.
Vossenbeemd 51
5705CL Helmond
Netherlands
Registration number: 170694030000
FOREIGN EXCHANGE RATES
|
Currency |
Unit
|
Indian Rupees |
|
US Dollar |
1 |
Rs.59.08 |
|
|
1 |
Rs.99.20 |
|
Euro |
1 |
Rs.80.53 |
INFORMATION DETAILS
|
Analysis Done by
: |
DIV |
|
|
|
|
Report Prepared
by : |
NIT |
RATING EXPLANATIONS
|
RATING |
STATUS |
PROPOSED CREDIT LINE |
|
|
|
>86 |
Aaa |
Possesses an extremely sound financial base with the strongest
capability for timely payment of interest and principal sums |
Unlimited |
|
|
71-85 |
Aa |
Possesses adequate working capital. No caution needed for credit
transaction. It has above average (strong) capability for payment of interest
and principal sums |
Large |
|
|
56-70 |
A |
Financial & operational base are regarded healthy. General unfavourable
factors will not cause fatal effect. Satisfactory capability for payment of
interest and principal sums |
Fairly Large |
|
|
41-55 |
Ba |
Overall operation is considered normal. Capable to meet normal
commitments. |
Satisfactory |
|
|
26-40 |
B |
Capability to overcome financial difficulties seems comparatively
below average. |
Small |
|
|
11-25 |
Ca |
Adverse factors are apparent. Repayment of interest and principal sums
in default or expected to be in default upon maturity |
Limited with
full security |
|
|
<10 |
C |
Absolute credit risk exists. Caution needed to be exercised |
Credit not
recommended |
|
|
-- |
NB |
New Business |
-- |
|
This score serves as a reference to assess SC’s credit risk
and to set the amount of credit to be extended. It is calculated from a
composite of weighted scores obtained from each of the major sections of this
report. The assessed factors and their relative weights (as indicated through
%) are as follows:
Financial
condition (40%) Ownership
background (20%) Payment
record (10%)
Credit history
(10%) Market trend
(10%) Operational
size (10%)
This report is issued at your request without any
risk and responsibility on the part of MIRA INFORM PRIVATE LIMITED (MIPL)
or its officials.