MIRA
INFORM REPORT
|
Report Date : |
30.05.2014 |
IDENTIFICATION DETAILS
|
Name : |
VENTILEX B.V. |
|
|
|
|
Registered Office : |
Europaweg 8, 8181BH Heerde |
|
|
|
|
Country : |
Netherlands |
|
|
|
|
Financials (as on) : |
31.12.2013 |
|
|
|
|
Date of Incorporation : |
16.12.1985 |
|
|
|
|
Legal Form : |
Besloten Vennootschap |
|
|
|
|
Line of Business : |
Manufacture of machinery and equipment |
|
|
|
|
No. of Employees : |
76 |
RATING & COMMENTS
|
MIRA’s Rating : |
B |
|
RATING |
STATUS |
PROPOSED CREDIT LINE |
|
|
26-40 |
B |
Capability to overcome financial difficulties seems comparatively
below average. |
Small |
|
Status : |
Moderate |
|
Payment Behaviour : |
No Complaints |
|
Litigation : |
Clear |
NOTES :
Any query related to this report can be made
on e-mail : infodept@mirainform.com
while quoting report number, name and date.
ECGC Country Risk Classification List – March 31, 2014
|
Country Name |
Previous Rating (31.12.2013) |
Current Rating (31.03.2014) |
|
Netherlands |
A1 |
A1 |
|
Risk Category |
ECGC Classification |
|
Insignificant |
A1 |
|
Low Risk |
A2 |
|
Moderate Low Risk |
B1 |
|
Moderate Risk |
B2 |
|
Moderate High Risk |
C1 |
|
High Risk |
C2 |
|
Very High Risk |
D |
NETHERLANDS - ECONOMIC OVERVIEW
Netherlands is the
sixth-largest economy in the euro-zone and is noted for its stable industrial
relations, moderate unemployment and inflation, sizable trade surplus, and
important role as a European transportation hub. Industrial activity is
predominantly in food processing, chemicals, petroleum refining, and electrical
machinery. A highly mechanized agricultural sector employs only 2% of the labor
force but provides large surpluses for the food-processing industry and for
exports. Netherlands, along with 11 of its EU partners, began circulating the
euro currency on 1 January 2002. The Dutch financial sector suffered as a
result of the global financial crisis, due in part to the high exposure of some
Dutch banks to US mortgage-backed securities. In 2008, the government
nationalized two banks and injected billions of dollars of capital into other
financial institutions, to prevent further deterioration of a crucial sector.
After 26 years of uninterrupted economic growth, the Dutch economy - highly
dependent on an international financial sector and international trade -
contracted by 3.5% in 2009. To recover, the government sought to boost the
domestic economy by accelerating infrastructure programs, offering corporate
tax breaks for employers to retain workers, and expanding export credit
facilities. The stimulus programs and bank bailouts, however, resulted in a
government budget deficit of 5.3% of GDP in 2010 that contrasted sharply with a
surplus of 0.7% in 2008. The government of Prime Minister Mark RUTTE began
implementing austerity measures in early 2011, mainly reducting expenditures,
which resulted in an improved budget deficit in 2011. However, in 2012 tax
revenues dropped, GDP contracted, and the budget deficit deteriorated. In 2013,
the government budget deficit decreased to 3.3% of GDP due to increased
government revenue from higher taxes. However, spending on social benefits also
increased, due to a rise in unemployment benefits and payments for pensions.
The high unemployment rate and tax increases have contributed to continued
decreases in household disposable income, causing the Dutch economy to contract
|
Source
: CIA |
summary
Company name Ventilex
B.V.
Operative address Europaweg
8
8181BH
Heerde
Netherlands
Legal form Besloten
Vennootschap
VAT-number 008044144
|
Year |
2013 |
|
Mutation |
2012 |
|
Mutation |
2011 |
|
Fixed assets |
1.387.100.000 |
% |
-9,75 |
1.537.000.000 |
|
8,35 |
1.418.500.000 |
|
Total
receivables |
1.526.000.000 |
% |
-21,19 |
1.936.300.000 |
|
-0,52 |
1.946.400.000 |
|
|
|||||||
|
Total
equity |
313.300.000 |
4 |
-42,71 |
546.900.000 |
|
-40,95 |
926.100.000 |
|
Short term
liabilities |
1.772.900.000 |
|
-42,54 |
3.085.500.000 |
t |
65,92 |
1.859.600.000 |
|
|
|||||||
|
Net result |
-696.600.000 |
|
-207,82 |
-226.300.000 |
|
-246,85 |
154.101.000 |
|
|
|||||||
|
Working
capital |
122.300.000 |
* |
117,88 |
-684.100.000 |
|
-255,34 |
440.400.000 |
|
Quick ratio |
1,03 |
* |
37,33 |
0,75 |
|
-37,50 |
1,20 |

Contact information
Company name Ventilex
B.V.
Trade names Ventilex
B.V.
Imtech
Dry Genic
Imtech
DryGenic
Imtech
DryGenic
Imtech
Ventilex
Imtech
Ventilex
Operative address Europaweg
8
8181BH
Heerde
Netherlands
Correspondence address Postbus
158
8180AD Heerde
Netherlands
Telephone number 0578698200
Fax number 0578698282
Email address info@ventilex.nl
Website www.ventilex.com
Registration
Branch number 000016619323
VAT-number 008044144
Status Active
First registration company register 1986-01-08
Memorandum 1985-12-16
Establishment date 1985-12-16
Legal form Besloten
Vennootschap
Last proposed admendment 2003-11-10
Activities
SBI Manufacture
of machinery for food, beverage and tobacco processing (2893)
Exporter No
Importer No
Goal Fabricage, ontwerpen
en monteren van installaties op het gebied van milieu, alsmede de handel in
aanverwante artikelen, brandstoffen, oliën en vetten.
Relations
Shareholders Imtech
Benelux Group B.V.
Kampenringweg 45a
2803PE GOUDA
Netherlands
Registration number: 596991240000
Percentage:
100.00%
Branches Ventilex
B.V.
Oude Middenweg 19
2491AC
'S-GRAVENHAGE
Netherlands
Registration number: 080430030001
Ventilex
Filtertechnologie B.V.
Registration number: 080735860000
Companies on same address
Personeelsvereniging
Ventilex
Registration number: 082181830000
Liability
statements Royal Imtech N.V.
Kampenringweg 45a
2803PE Gouda
Netherlands
Registration number: 241148560000
date of issue: 2011-01-28
Starting date: 2009-01-01
Management
Active management Imtech Nederland B.V.
Oude Middenweg 11
2491AC 's-Gravenhage
Netherlands
Registration number: 271554510000
Competence: Fully authorized
Function: Manager
Starting date: 2013-11-22
R.J. Willems (Richard Johannes)
Netherlands
Competence: Limited authorization
Function: Managing Director
Starting date: 2014-01-17
Date of birth: 1965-05-25, Apeldoorn, NL
Involved with the following companies
• Imtech Trecom B.V.
Hogeweg 182
3815LZ Amersfoort
Netherlands
Registration number: 320723730000
Function: Managing Director
• Imtech Industry international B.V.
Modem 30
7741MJ Coevorden
Netherlands
Registration number: 040287080000
Function: Managing Director
Active management
R. Enkt (Raymond)
Netherlands
Competence: Limited authorization
Function: Managing Director
Starting date: 2014-01-17
Date of birth: 1972-04-19, Enschede, NL
Involved with the following companies
• Imtech Trecom B.V.
Hogeweg 182
3815LZ Amersfoort
Netherlands
Registration number: 320723730000
Function: Managing Director
• Imtech Industry international B.V.
Modem 30
7741MJ Coevorden
Netherlands
Registration number: 040287080000
Function: Managing Director
E. Schouten (Eric)
Netherlands
Competence: Limited authorization
Function: Proxy
Starting date: 2014-01-17
Date of birth: 1966-04-10, Uithoorn, NL
Involved with the following companies
• Kone Liften B.V.
Rijn 10
2491BG 'S-GRAVENHAGE
Netherlands
Registration number: 271624010000
Function: Manager
• Imtech Industrial Services B.V.
Oude Middenweg 19
2491AC 's-Gravenhage
Netherlands
Registration number: 350105030029
Function: Proxy
• Imtech Industrial Services B.V.
Oude Middenweg 11
2491AC 's-Gravenhage
Netherlands
Registration number: 350105030000
Function: Proxy
Imtech Trecom B.V.
Hogeweg 182
3815LZ Amersfoort
Netherlands
Registration number: 320723730000
Function: Proxy
• Imtech Industry international B.V.
Modem 30
7741MJ Coevorden
Netherlands
Registration number: 040287080000
Function: Proxy
• Hopmann Liftservice B.V.
Edisonweg 10
6101XJ ECHT
Netherlands
Registration number: 140306060000
Function: Manager
K.J.J. Egberts (Koenraad Josephus Johannes)
Netherlands
Competence: Limited authorization
Function: Proxy
Starting date: 2006-01-01
Date of birth: 1964-01-31, Bunnik, NL
E. Boschman - Eulink (Evert)
Netherlands
Competence: Limited authorization
Function: Proxy
Starting date: 2011-04-01
Date of birth: 1978-09-14, Oldebroek, NL
S.H. ter Burg (Steven Hendrik)
Netherlands
Competence: Limited authorization
Function: Proxy
Starting date: 2012-03-01
Date of birth: 1986-08-25, Hardenberg, NL
S.H. ter Burg (Steven Hendrik)
Netherlands
Competence: Limited authorization
Function: Proxy
Starting date: 2012-03-01
Date of birth: 1986-08-25, Hardenberg, NL
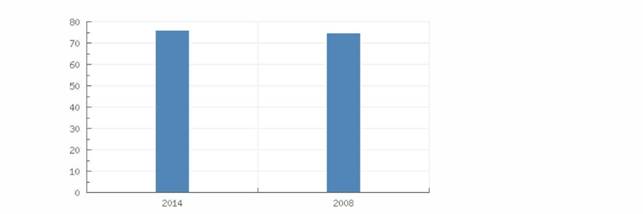
Employees
|
Total
according to the Chamber of Commerce |
76 |
|
Year |
2014 2008 |
|
Total |
76 75 |
Payments
|
Description |
Payments are made regularly no complaints are known |
|
|
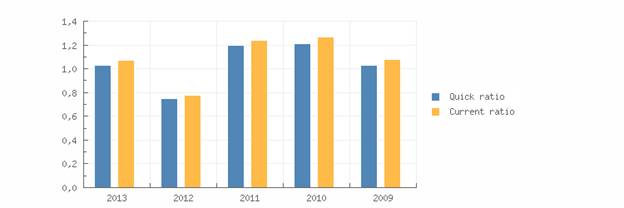
Key figures
|
|
|||||
|
Year |
2013 |
2012 |
2011 |
2010 |
2009 |
|
Quick ratio |
1,03 |
0,75 |
1,20 |
1,21 |
1,03 |
|
Current
ratio |
1,07 |
0,78 |
1,24 |
1,27 |
1,08 |
|
|
|||||
|
Working
capital/ balance total |
0,04 |
-0,17 |
0,12 |
0,13 |
0,05 |
|
Equity /
balance total |
0,10 |
0,14 |
0,25 |
0,27 |
0,19 |
|
Equity /
Fixed assets |
0,23 |
0,36 |
0,65 |
0,69 |
0,53 |
|
Year |
2013 |
2012 |
2011 |
2010 |
2009 |
|
Equity /
liabilities |
0,11 |
0,16 |
0,33 |
0,36 |
0,24 |
|
Balance
total / liabilities |
1,11 |
1,16 |
1,33 |
1,37 |
1,24 |
|
|
|||||
|
Working
capital |
122.300.000 |
-684.100.000 |
440.400.000 |
398.000.000 |
116.589.000 |
|
Equity |
313.300.000 |
546.900.000 |
926.100.000 |
812.400.000 |
498.053.000 |
|
Mutation
equity |
-42,71 |
-40,95 |
14,00 |
63,12 |
25,79 |
|
Mutation
short term liabilities |
-42,54 |
65,92 |
26,24 |
-3,31 |
1,16 |
|
|
|||||
|
Return on
total assets (ROA) |
-20,11 |
-5,03 |
5,69 |
6,24 |
7,11 |
|
Return on
equity (ROE) |
-210,66 |
-36,24 |
22,85 |
23,39 |
36,90 |
|
Gross
profit margin |
-11,11 |
|
|
|
|
|
Net profit
margin |
-14,09 |
|
|
|
|
|
|
|||||
|
Average
collection ratio |
2,79 |
|
|
|
|
|
Average
payment ratio |
3,24 |
|
|
|
|
|
Equity
turnover ratio |
15,78 |
|
|
|
|
|
Total
assets turnover ratio |
1,51 |
|
|
|
|
|
Fixed
assets turnover ratio |
3,56 |
|
|
|
|
|
Inventory
conversion ratio |
67,92 |
|
|
|
|
|
|
|||||
|
Turnover |
4.944.900.000 |
|
|
|
|
|
Operating
result |
-549.300.000 |
-135.200.000 |
263.660.000 |
234.200.000 |
225.650.000 |
|
Net result
after taxes |
-701.200.000 |
-226.300.000 |
154.101.000 |
140.400.000 |
127.055.000 |
|
|
|||||
|
Cashflow |
|
|
|
196.800.000 |
|
|
Gross
profit |
|
|
|
4.480.900.000 |
|
|
EBIT |
|
-135.200.000 |
263.660.000 |
234.200.000 |
225.650.000 |
|
EBITDA |
|
|
|
290.600.000 |
|
Summary
The 2013 financial result structure is a postive working captial of
122.300.000 euro, which is
in agreement with 4 % of the total assets of the company.
The working capital has increased with 117.88 % compared to previous
year. The ratio, with
respect to the total assets of the company has however, increased.
The improvement between 2012 and 2013 has mainly been caused by an
increase of the
current assets.
The current ratio of the company in 2013 was 1.07. When the current
ratio is below 1.5, the
company may have problems meeting its short-term obligations.
The quick ratio in 2013 of the company was 1.03. A company with a Quick
Ratio of more than
1 can currently pay back its current liabilities.
The 2012 financial result structure is a negative working captial of
-684.100.000 euro, which
is in agreement with -17 % of the total assets of the company.
The working capital has diminished with -255.34 % compared to previous
year. The ratio,
with respect to the total assets of the company has however, declined.
The deterioration between 2011 and 2012 has mainly been caused by an
increase of the
current liabilities.
The current ratio of the company in 2012 was 0.78. When the current
ratio is below 1.5, the
company may have problems meeting its short-term obligations.
The quick ratio in 2012 of the company was 0.75. A company with a Quick
Ratio of less than
1 cannot currently pay back its current liabilities.

Financial statement
Type of annual account Consolidated
Annual account Royal
Imtech N.V.
Kampenringweg 45a
2803PE Gouda
Netherlands
Registration number: 241148560000
Balance
|
Year |
2013 |
2012 |
2011 |
2010 |
2009 |
|
End date |
2013-12-31 |
2012-12-31 |
2011-12-31 |
2010-12-31 |
2009-12-31 |
|
Intangible
fixed assets |
1.181.800.000 |
1.299.700.000 |
1.187.500.000 |
989.400.000 |
763.738.000 |
|
Other
tangible fixed assets |
|
|
|
154.400.000 |
|
|
Tangible
fixed assets |
161.000.000 |
170.800.000 |
192.400.000 |
154.400.000 |
142.051.000 |
|
Other
financial fixed assets |
|
|
|
2.100.000 |
|
|
Financial
fixed assets |
44.300.000 |
66.500.000 |
38.600.000 |
31.300.000 |
37.944.000 |
|
Fixed assets |
1.387.100.000 |
1.537.000.000 |
1.418.500.000 |
1.175.100.000 |
943.733.000 |
|
|
|||||
|
Other stock |
|
|
|
82.600.000 |
|
|
Total stock |
72.800.000 |
80.000.000 |
75.500.000 |
82.600.000 |
77.658.000 |
|
Accounts
receivable |
859.300.000 |
1.128.600.000 |
1.308.900.000 |
|
|
|
Other
receivables |
666.700.000 |
807.700.000 |
637.500.000 |
1.678.500.000 |
|
|
Total
receivables |
1.526.000.000 |
1.936.300.000 |
1.946.400.000 |
1.678.500.000 |
1.453.032.000 |
|
Year |
2013 |
2012 |
2011 |
2010 |
2009 |
|
End date |
2013-12-31 |
2012-12-31 |
2011-12-31 |
2010-12-31 |
2009-12-31 |
|
Liquid
funds |
296.400.000 |
385.100.000 |
278.100.000 |
110.000.000 |
109.407.000 |
|
accruals |
|
|
|
1.678.500.000 |
|
|
Current
assets |
1.895.200.000 |
2.401.400.000 |
2.300.000.000 |
1.871.100.000 |
1.640.097.000 |
|
Total
assets |
3.282.300.000 |
3.938.400.000 |
3.718.500.000 |
3.046.200.000 |
2.583.830.000 |
|
|
|||||
|
Issued
capital |
373.800.000 |
|
|
73.300.000 |
|
|
Share
premium reserve |
|
|
|
210.600.000 |
|
|
Other
reserves |
632.000.000 |
|
|
388.100.000 |
|
|
Non-distributable
profit |
-701.200.000 |
|
|
140.400.000 |
|
|
Total
reserves |
|
|
|
739.100.000 |
|
|
Shareholders
equity |
304.600.000 |
|
|
|
|
|
Minority interests |
8.700.000 |
9.700.000 |
6.300.000 |
3.500.000 |
3.075.000 |
|
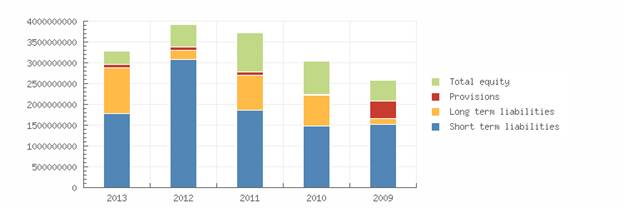
Total
equity |
313.300.000 |
546.900.000 |
926.100.000 |
812.400.000 |
498.053.000 |
|
|
|||||
|
Provisions |
81.700.000 |
89.100.000 |
77.100.000 |
3.500.000 |
414.710.000 |
|
Long term
interest yielding debt |
|
207.200.000 |
849.400.000 |
|
144.484.000 |
|
Other long
term liabilities |
|
|
|
753.700.000 |
|
|
Long term
liabilities |
1.114.400.000 |
207.200.000 |
849.400.000 |
753.700.000 |
144.484.000 |
|
Accounts
payable |
|
890.800.000 |
840.500.000 |
|
|
|
Other short
term liabilities |
|
2.194.700.000 |
1.019.100.000 |
1.473.100.000 |
|
|
Short term
liabilities |
1.772.900.000 |
3.085.500.000 |
1.859.600.000 |
1.473.100.000 |
1.523.508.000 |
|
Total short
and long term liabilities |
2.969.000.000 |
3.381.800.000 |
2.786.100.000 |
2.226.800.000 |
2.082.702.000 |
|
Total
liabilities |
3.282.300.000 |
3.938.400.000 |
3.718.500.000 |
3.046.200.000 |
2.583.830.000 |
Summary
The total assets of the company decreased with -16.66 % between 2012 and
2013.
This total assets decrease has been reflected in a reduction of non
current assets of -9.75 %.
Assets reduction is explained by a Net Worth decrease of -42.71 %, and
an indebtedness
reduction of -12.21 %.
In 2013 the assets of the company were 42.26 % composed of fixed assets
and 57.74 % by
current assets. The assets are being financed by an equity of 9.55 %,
and total debt of 90.45
%.
The total assets of the company increased with 5.91 % between 2011 and
2012.
The total asset increase is retrievable in the fixed asset growth of
8.35 %.
Asset growth is in contrasts with the net worth decline of -40.95 %. The
company's
indebtedness has, therefore, increased with 21.38 %.
In 2012 the assets of the company were 39.03 % composed of fixed assets
and 60.97 % by
current assets. The assets are being financed by an equity of 13.89 %,
and total debt of
86.11 %.

Profit and loss
|
Year |
2013 |
2012 |
2011 |
2010 |
2009 |
|
Revenues |
|
5.432.900.000 |
5.113.800.000 |
4.480.900.000 |
4.323.252.000 |
|
Net
turnover |
4.944.900.000 |
|
|||
|
|
|||||
|
Cost of
sales |
2.982.600.000 |
|
|
|
|
|
Gross
margin |
1.962.300.000 |
|
|||
|
|
|||||
|
Wages and
salaries |
1.772.000.000 |
|
|
1.306.500.000 |
|
|
Amorization
and depreciation |
125.400.000 |
|
|
56.400.000 |
|
|
other
operating costs |
614.200.000 |
|
|
338.600.000 |
|
|
Production
costs |
|
|
|
1.026.300.000 |
|
|
Raw
materials and consumables |
|
|
|
1.517.800.000 |
|
|
Operating
expenses |
2.511.600.000 |
5.568.100.000 |
4.850.140.000 |
4.246.700.000 |
4.097.602.000 |
|
Result in
subsidiaries |
|
2.900.000 |
|
700.000 |
226.000 |
|
Operating
result |
-549.300.000 |
-135.200.000 |
263.660.000 |
234.200.000 |
225.650.000 |
|
|
|||||
|
Financial
income |
20.200.000 |
18.200.000 |
14.800.000 |
11.100.000 |
13.313.000 |
|
Financial
expenses |
125.200.000 |
84.100.000 |
66.800.000 |
56.000.000 |
55.422.000 |
|
Financial
result |
-105.000.000 |
-65.900.000 |
-52.000.000 |
-44.900.000 |
-42.109.000 |
|
Result
subsidiaries before taxes |
-5.700.000 |
|
|
|
|
|
Result on
ordinary operations before taxes |
-660.000.000 |
-198.200.000 |
211.660.000 |
190.000.000 |
183.767.000 |
|
|
|||||
|
Taxation on
the result of ordinary activities |
20.400.000 |
4.800.000 |
53.299.000 |
48.300.000 |
44.004.000 |
|
Year |
2013 |
2012 |
2011 |
2010 |
2009 |
|
Result of
ordinary activities after taxes |
-639.600.000 |
-203.000.000 |
158.361.000 |
141.700.000 |
139.763.000 |
|
|
|||||
|
Extraordinary
expense |
|
23.300.000 |
4.260.000 |
|
12.708.000 |
|
Extraordinary
result after taxation |
-57.000.000 |
-23.300.000 |
-4.260.000 |
|
-12.708.000 |
|
Net result |
-696.600.000 |
-226.300.000 |
154.101.000 |
140.400.000 |
127.055.000 |
|
|
|||||
|
Attributable
to third parties |
4.600.000 |
|
|
-1.300.000 |
|
|
Attributable
to shareholders |
-701.200.000 |
|
|
|
|
Summary
The operating result of the company declined with -306.29 % between 2012
and 2013. This
evolution implies an decrease of the company's economic profitability.
The result of these changes is a reduction of the company's Economic
Profitability of -299.8
% of the analysed period, being equal to 2012 % in the year 2013.
The Net Result of the company increased by -209.85 % between 2012 and
2013.
The company's Financial Profitability has been negatively affected by
the financial activities in
comparison to the EBITs behaviour. The result of these variations is a
profitability reduction
of -481.29 % of the analysed period, being -210.66 % in the year 2013.
The company's financial profitability has been positively affected by
its financial structure.
The operating result of the company declined with -151.28 % between 2011
and 2012. This
evolution implies an decrease of the company's economic profitability.
The result of these changes is a reduction of the company's Economic
Profitability of -188.4
% of the analysed period, being equal to 2011 % in the year 2012.
The Net Result of the company increased by -246.85 % between 2011 and
2012.
The company's Financial Profitability has been positively affected by
the financial activities in
comparison to the EBITs behaviour. The result of these variations is a
profitability increase of
-258.6 % of the analysed period, being -36.24 % in the year 2012.
The company's financial profitability has been positively affected by
its financial structure.


Analysis
Branch (SBI) Manufacture
of machinery and equipment n.e.c. (28)
Region Veluwe
In the Netherlands 4630 of the companies are
registered with the SBI code 28
In the region Veluwe 238 of the companies
are registered with the SBI code 28
In the Netherlands 136 of the bankrupcties
are published within this sector
In the region Veluwe 8 of the bankruptcies
are published within this sector
The risk of this specific sector in the
Netherlands is normal
The risk of this specific sector in the
region Veluwe is normal
Publications
Consent statements 24-04-2014:
Voor boekjaar 2013 is een instemmingsverklaring gedeponeerd.
27-06-2013: Voor
boekjaar 2012 is een instemmingsverklaring gedeponeerd.
27-04-2012: Voor boekjaar 2011 is een
instemmingsverklaring gedeponeerd.
26-04-2012: Voor boekjaar 2009 is een
instemmingsverklaring gedeponeerd.
26-04-2011: Voor boekjaar 2010 is een
instemmingsverklaring gedeponeerd.
Liability statements 01-02-2011:
Per 28-01-2011 is een aansprakelijkheidsverklaring door Imtech N.V.
gedeponeerd.
Filings 09-07-2009:
De jaarrekening over 2008 is gepubliceerd.
Functions 18-02-2014:
Per 17-01-2014 is gevolmachtigde Eric Schouten in functie getreden.
18-02-2014: Per 17-01-2014 is gevolmachtigde
Raymond Enkt in functie getreden.
18-02-2014: Per 17-01-2014 is gevolmachtigde
Richard Johannes Willems in functie
getreden.
18-02-2014: Per 17-01-2014 is gevolmachtigde
Rien Pepping uit functie getreden.
05-12-2013: Per 22-11-2013 is bestuurder
27155451 Imtech Nederland B.V. in functie
getreden.
05-12-2013: Per 22-11-2013 is bestuurder
29046001 Imtech B.V. uit functie getreden.
30-08-2013: Per 26-08-2013 is gevolmachtigde
Jannes Hendrikus Slettenhaar uit functie
getreden.
30-10-2012: Per 01-10-2012 is gevolmachtigde
Jannes Hendrikus Slettenhaar in functie
getreden.
30-10-2012: Per 01-10-2012 is gevolmachtigde
George Richardus Maria Batenburg uit
functie getreden.
23-03-2012: Per 10-02-2012 is gevolmachtigde
Hendrik Jan Vels uit functie getreden.
23-03-2012: Per 01-03-2012 is gevolmachtigde
Steven Hendrik ter Burg in functie getreden.
24-02-2012: Per 01-02-2012 is gevolmachtigde
Rien Pepping in functie getreden.
24-02-2012: Per 15-01-2012 is gevolmachtigde
Anton Johannes Franciscus Jacobus Kersten
uit functie getreden.
29-04-2011: Per 01-04-2011 is gevolmachtigde
Anton Johannes Franciscus Jacobus Kersten
in functie getreden.
29-04-2011: Per 01-04-2011 is gevolmachtigde
Evert Boschman in functie getreden.
29-04-2011: Per 01-04-2011 is gevolmachtigde
George Richardus Maria Batenburg in functie
getreden.
29-03-2011: Per 18-03-2011 is gevolmachtigde
Gert Buist uit functie getreden.
Company structure
Relations 68
Royal Imtech N.V.
Kampenringweg 45a
2803PE Gouda
Netherlands
Registration number: 241148560000
• Imtech Group
B.V.
Kampenringweg 45a
2803PE GOUDA
Netherlands
Registration number: 596939160000
• Imtech Benelux
Group B.V.
Kampenringweg 45a
2803PE GOUDA
Netherlands
Registration number: 596991240000
• Ventilex B.V.
Europaweg 8
8181BH Heerde
Netherlands
Registration number: 080430030000
FOREIGN EXCHANGE RATES
|
Currency |
Unit
|
Indian Rupees |
|
US Dollar |
1 |
Rs.58.84 |
|
|
1 |
Rs.98.40 |
|
Euro |
1 |
Rs.80.03 |
INFORMATION DETAILS
|
Analysis Done by
: |
SUB |
|
|
|
|
Report Prepared
by : |
PDT |
RATING EXPLANATIONS
|
RATING |
STATUS |
PROPOSED CREDIT LINE |
|
|
|
>86 |
Aaa |
Possesses an extremely sound financial base with the strongest
capability for timely payment of interest and principal sums |
Unlimited |
|
|
71-85 |
Aa |
Possesses adequate working capital. No caution needed for credit
transaction. It has above average (strong) capability for payment of interest
and principal sums |
Large |
|
|
56-70 |
A |
Financial & operational base are regarded healthy. General
unfavourable factors will not cause fatal effect. Satisfactory capability for
payment of interest and principal sums |
Fairly Large |
|
|
41-55 |
Ba |
Overall operation is considered normal. Capable to meet normal
commitments. |
Satisfactory |
|
|
26-40 |
B |
Capability to overcome financial difficulties seems comparatively
below average. |
Small |
|
|
11-25 |
Ca |
Adverse factors are apparent. Repayment of interest and principal sums
in default or expected to be in default upon maturity |
Limited with
full security |
|
|
<10 |
C |
Absolute credit risk exists. Caution needed to be exercised |
Credit not
recommended |
|
|
-- |
NB |
New Business |
-- |
|
This score serves as a reference to assess
SC’s credit risk and to set the amount of credit to be extended. It is
calculated from a composite of weighted scores obtained from each of the major
sections of this report. The assessed factors and their relative weights (as
indicated through %) are as follows:
Financial
condition (40%) Ownership
background (20%) Payment
record (10%)
Credit history
(10%) Market trend (10%) Operational size
(10%)
This report is issued at your request without any
risk and responsibility on the part of MIRA INFORM PRIVATE LIMITED (MIPL)
or its officials.