MIRA INFORM REPORT
|
Report Date : |
31.05.2014 |
IDENTIFICATION DETAILS
|
Name : |
ADOLFO DOMINGUEZ SA. |
|
|
|
|
Registered Office : |
Calle 4, Parcela 8, Polig. Industrial San San Ciprian De Viñas - San Cibrao Das Viñas - 32901 - Orense |
|
|
|
|
Country : |
Spain |
|
|
|
|
Financials (as on) : |
2013 |
|
|
|
|
Date of Incorporation : |
09.03.1989 |
|
|
|
|
Legal Form : |
Public Company |
|
|
|
|
Line of Business : |
Retail sale of clothing in specialised stores |
|
|
|
|
No. of Employees : |
1500 |
RATING & COMMENTS
|
MIRA’s Rating : |
B |
|
RATING |
STATUS |
PROPOSED CREDIT LINE |
|
|
26-40 |
B |
Capability to overcome financial difficulties seems comparatively
below average. |
Small |
|
Status : |
Moderate |
|
Payment Behaviour : |
No complaints |
|
Litigation : |
Clear |
NOTES :
Any query related to this report can be made
on e-mail : infodept@mirainform.com
while quoting report number, name and date.
ECGC Country Risk Classification List – March 31, 2014
|
Country Name |
Previous Rating (31.12.2013) |
Current Rating (31.03.2014) |
|
Spain |
A2 |
A2 |
|
Risk Category |
ECGC
Classification |
|
Insignificant |
A1 |
|
Low Risk |
A2 |
|
Moderate Low Risk |
B1 |
|
Moderate Risk |
B2 |
|
Moderate High Risk |
C1 |
|
High Risk |
C2 |
|
Very High Risk |
D |
SPAIN - ECONOMIC OVERVIEW
Spain experienced a prolonged
recession in the wake of the global financial crisis. GDP contracted by 3.7% in
2009, ending a 16-year growth trend, and continued contracting through most of
2013. Economic growth resumed in late 2013, albeit only modestly, as credit
contraction in the private sector, fiscal austerity, and high unemployment
continued to weigh on domestic consumption and investment. Exports, however,
have been resilient throughout the economic downturn, partially offsetting
declines in domestic consumption and helped to bring Spain's current account
into surplus in 2013 for the first time since 1986. The unemployment rate rose
from a low of about 8% in 2007 to more than 26% in 2013, straining Spain's
public finances as spending on social benefits increased while tax revenues
fell. Spain’s budget deficit peaked at 11.4% of GDP in 2009. Spain gradually reduced
the deficit to just under 7% of GDP in 2013, slightly above the 6.5% target
negotiated between Spain and the EU. Public debt has increased substantially –
from 60.1% of GDP in 2010 to 93.4% in 2013. Rising labor productivity,
moderating labor costs, and lower inflation have helped to improve foreign
investor interest in the economy and to reduce government borrowing costs. The
government's ongoing efforts to implement reforms - labor, pension, health,
tax, and education - are aimed at supporting investor sentiment. The government
also has shored up struggling banks exposed to Spain's depressed domestic
construction and real estate sectors by successfully completing an EU-funded
restructuring and recapitalization program in December 2013
|
Source
: CIA |
EXECUTIVE
SUMMARY
|
Name: |
ADOLFO DOMINGUEZ SA. |
|
NIF / Fiscal code: |
A32104226 |
|
Status: |
ACTIVE |
|
Incorporation Date: |
09/03/1989 |
|
Register Data |
Register Section 8 Sheet 1938 |
|
Last Publication in
BORME: |
07/03/2014 [Revocations] |
|
Last Published Account Deposit: |
2012 |
|
Share Capital: |
5.565.664,80 |
|
|
|
|
Localization: |
CALLE 4, PARCELA 8, POLIG. INDUSTRIAL SAN SAN CIPRIAN DE VIÑAS -
SAN CIBRAO DAS VIÑAS - 32901 - ORENSE |
|
Telephone - Fax - Email - Website: |
Ph.:. 988383796 Email.
contacto@adolfodominguez.com Website. www.adolfodominguez.com |
|
Number of Branches |
2 |
|
|
|
|
Activity: |
|
|
NACE: |
4771 - Retail sale of clothing in specialised stores |
|
Registered Trademarks: |
|
|
Audited / Opinion: |
Si / |
|
Tenders and Awards: |
0 for a total cost of 0 |
|
Subsidies: |
43 for a total cost of 5244797 |
|
Quality Certificate: |
No |
Partners
|
ADOLFO DOMINGUEZ FERNANDEZ |
31.51 % |
|
|
ANTONIO PUIG SA |
14.8 % |
|
|
LIBERTAS 7 SOCIEDAD ANONIMA |
0.07 % |
|
|
LA PREVISION MALLORQUINA DE SEGUROS SA |
7.56 % |
|
|
LUXURY LIBERTY SA |
10.22 % |
|
|
NCG BANCO SA |
4.98 % |
|
|
Shares: |
24 |
|
|
Other Links: |
8 |
|
|
No. of Active Corporate Bodies: |
CHIEF EXECUTIVE OFFICER 1 |
|
|
Ratios |
2013 |
2012 |
Change |
|
|
|
|
|
Guarantees: |
|
|
Properties Registered: |
Company NO, Administrator NO |
|
Financing / Guarantee Sources : |
Sources YES, Guarantees YES |
|
INVESTIGATION SUMMARY |
|
Company established in the year 1989, belonging to a group of
great popularity in the sector, in line with the progress that already showed
the results of the first half, the EBITDA of the Group shows an improvement of
10.3% with respect to the previous year. The net financial position also
improved 4.6 MEuros compared to the same period in the previous year,
standing at - 16.5 MEuros. Adolfo Dominguez has contributed and contributes
to the fashion world a timeless beauty of refined cuts: innovation without
renouncing the traditional invoice. It meets normal payment commitments. |
Identification
|
Social Denomination: |
ADOLFO
DOMINGUEZ SA. |
|
NIF / Fiscal code: |
A32104226 |
|
Corporate Status: |
ACTIVE |
|
Start of activity: |
1989 |
|
Registered Office: |
CALLE 4,
PARCELA 8, POLIG. INDUSTRIAL SAN SAN CIPRIAN DE VIÑAS |
|
Locality: |
SAN CIBRAO DAS
VIÑAS |
|
Province: |
ORENSE |
|
Postal Code: |
32901 |
|
Telephone: |
988383796 |
|
Website: |
www.adolfodominguez.com |
|
Email: |
contacto@adolfodominguez.com |
|
Branch Offices |
|
|
|
|
|
Address |
Postal Code |
City |
Province |
|
PASEO GRACIA 32 |
08007 |
BARCELONA |
BARCELONA |
|
CALLE SERRANO 5 |
28001 |
MADRID |
MADRID |
Activity
|
NACE: |
4771 |
|
Additional Information: |
It is
dedicated to the design, manufacture, marketing of clothing items, footwear
and accessories, perfumes, for gentleman, ladies and children. Belonging to the
Adolfo Domínguez group, its beginnings date back to the year 1973. It has own
shops and franchises. |
|
Additional Address: |
CALLE 4,
PARCELA 8, POLIG. INDUSTRIAL SAN SAN CIPRIAN DE VIÑAS 32901 SAN CIBRAO DAS VIÑAS
( ORENSE ) , head office, factory, workshop, warehouse, offices, facilities,
attributed property. |
|
Import / export: |
IMPORTS /
EXPORTS |
|
Future Perspective: |
Consolidation |
|
Industry situation: |
Maturity |
Number
of Employees
|
|
Year |
No. of employees |
Established |
Incidentals |
|
|
|
2014 |
1500 |
|
|
|
|
|
|||
|
|
|
|
|
|
|
Year |
Act |
|
|
|
1990 |
Accounts deposit (ejer. 1989) |
|
|
|
1992 |
Accounts deposit (ejer. 1990, 1991) Adaptation to Law (1)
Appointments/ Re-elections (2) Cessations/ Resignations/ Reversals (1) Change
of Social address (1) Company Transformation (1) Increase of Capital (1)
Other Concepts/ Events (1) |
|
|
|
1994 |
Accounts deposit (ejer. 1992, 1993) |
|
|
|
1996 |
Accounts deposit (ejer. 1994, 1995) Change of Social Denomination
(2) Company Transformation (1) Increase of Capital (1) Other Concepts/ Events
(1) Take-over Merger (5) |
|
|
|
1997 |
Accounts deposit (ejer. 1996) Appointments/ Re-elections (2)
Cessations/ Resignations/ Reversals (1) Change of Social Purpose (1) Increase
of Capital (1) Other Concepts/ Events (1) Statutory Modifications (1) |
|
|
|
1998 |
Accounts deposit (ejer. 1997) Appointments/ Re-elections
(1) Board Meeting (1) Cessations/ Resignations/ Reversals (1) |
|
|
|
1999 |
Appointments/ Re-elections (3) Board Meeting (1) Increase
of Capital (1) Other Concepts/ Events (1) |
|
|
|
2000 |
Accounts deposit (ejer. 1999 consolidated, 1999) Board Meeting
(1) Increase of Capital (1) |
|
|
|
2001 |
Accounts deposit (ejer. 1998 consolidated, 1998)
Appointments/ Re-elections (3) Cessations/ Resignations/ Reversals (1) Other
Concepts/ Events (1) |
|
|
|
2002 |
Accounts deposit (ejer. 2000 consolidated, 2001
consolidated, 2000, 2001) Appointments/ Re-elections (2) Board Meeting (1)
Cessations/ Resignations/ Reversals (1) |
|
|
|
2003 |
Appointments/ Re-elections (1) Board Meeting (1) Other Concepts/
Events (1) |
|
|
|
2004 |
Accounts deposit (ejer. 2002) Board Meeting (1) Other
Concepts/ Events (2) |
|
|
|
2005 |
Accounts deposit (ejer. 2003 consolidated, 2004 consolidated,
2003, 2004) Appointments/ Re-elections (5) Other Concepts/ Events (1)
Statutory Modifications (1) |
|
|
|
2006 |
Accounts deposit (ejer. 2005 consolidated, 2005)
Appointments/ Re-elections (5) Cessations/ Resignations/ Reversals (3) Increase
of Capital (1) Other Concepts/ Events (1) Statutory Modifications (1) |
|
|
|
2007 |
Accounts deposit (ejer. 2006) Appointments/ Re-elections
(3) Cessations/ Resignations/ Reversals (1) Change of Social address (1) Other
Concepts/ Events (3) Statutory Modifications (1) |
|
|
|
2008 |
Accounts deposit (ejer. 2006 consolidated, 2007
consolidated, 2007) Appointments/ Re-elections (4) Other Concepts/ Events (1) |
|
|
|
2009 |
Accounts deposit (ejer. 2008 consolidated, 2008)
Appointments/ Re-elections (3) Cessations/ Resignations/ Reversals (2) |
|
|
|
2010 |
Accounts deposit (ejer. 2009 consolidated, 2009)
Appointments/ Re-elections (3) Take-over Merger (3) |
|
|
|
2011 |
Accounts deposit (ejer. 2010 consolidated, 2010)
Appointments/ Re-elections (3) Cessations/ Resignations/ Reversals (2) Other
Concepts/ Events (3) |
|
|
|
2012 |
Accounts deposit (ejer. 2011 consolidated, 2011) Appointments/
Re-elections (7) Cessations/ Resignations/ Reversals (3) Other Concepts/
Events (5) |
|
|
|
2013 |
Accounts deposit (ejer. 2012) Appointments/ Re-elections
(3) Cessations/ Resignations/ Reversals (1) Increase of Capital (1) |
|
|
|
2014 |
Cessations/ Resignations/ Reversals (1) |
|
|
|
|
|
Registered Capital: |
5.565.664,80 |
|
Paid up capital: |
5.565.664,80 |
|
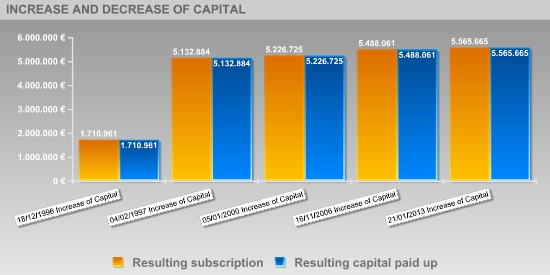
Publishing Date |
Registration Type |
Capital Subscribed |
Paid up capital |
Underwritten result |
Disbursed Result |
|
19/10/1992 |
Increase of Capital |
1.622.733 |
1.622.733 |
1.694.854 |
1.694.854 |
|
18/12/1996 |
Increase of Capital |
16.107 |
16.107 |
1.710.961 |
1.710.961 |
|
04/02/1997 |
Increase of Capital |
3.421.923 |
3.421.923 |
5.132.884 |
5.132.884 |
|
05/01/2000 |
Increase of Capital |
102.485 |
102.485 |
5.226.725 |
5.226.725 |
|
16/11/2006 |
Increase of Capital |
261.336 |
261.336 |
5.488.061 |
5.488.061 |
|
21/01/2013 |
Increase of Capital |
77.604 |
77.604 |
5.565.665 |
5.565.665 |
|
|
|
|
|
|
|
Post published |
Social Body's Name |
Appointment Date |
Other Positions in this Company |
|
PRESIDENT |
DOMINGUEZ FERNANDEZ ADOLFO |
23/08/2006 |
13 |
|
PRESIDENT OF THE EXECUTIVE COMM. |
GARCIA PLANAS MARCET JOSE MARIA |
13/07/2012 |
9 |
|
VICE CHAIRMAN |
CROISSIER BATISTA LUIS CARLOS |
23/08/2006 |
11 |
|
MEMBER OF THE BOARD |
DOMINGUEZ FERNANDEZ ADOLFO |
02/09/2011 |
13 |
|
|
FERNANDEZ NOVO JUAN MANUEL |
02/09/2011 |
8 |
|
|
GONZALEZ ALVAREZ ELENA |
30/08/2010 |
2 |
|
|
FERNANDEZ NOVO JUAN |
11/03/1997 |
4 |
|
JOINT ATTORNEY |
FERNANDEZ NOVO JUAN |
18/03/1999 |
4 |
|
|
RODRIGUEZ TREBOLLE FERNANDO |
18/03/1999 |
4 |
|
JOINT ATTORNEY/COMBINED PROXY |
CARPIO MARTINEZ ESTANISLAO |
22/11/2013 |
1 |
|
PROXY |
NEGRO LOPEZ JULIO |
18/07/2013 |
1 |
|
|
PAULA PRIETO MARIA DOLORES |
04/03/2010 |
1 |
|
CHIEF EXECUTIVE OFFICER |
DOMINGUEZ FERNANDEZ ADOLFO |
26/10/2011 |
13 |
|
SECRETARY |
RIOS ESTRELLA MARTA |
20/11/2012 |
5 |
|
EXECUTIVE COMMISSION SECRETARY |
RIOS ESTRELLA MARTA |
20/11/2012 |
5 |
|
NON CONSELLOR SECRETARY |
RIOS ESTRELLA MARTA |
20/11/2012 |
5 |
|
VICE SECRETARY |
ZARZALEJOS TOLEDANO IGNACIO |
20/11/2012 |
2 |
|
|
RODRIGUEZ TREBOLLE FERNANDO |
09/05/2008 |
4 |
|
NON CONSELLOR ASSISTANT SECRETARY |
ZARZALEJOS TOLEDANO IGNACIO |
20/11/2012 |
2 |
|
MEMBER |
BERGES LOBERA ANGEL |
13/07/2012 |
7 |
|
|
LUXURY LIBERTY SA |
13/07/2012 |
5 |
|
MEMBER OF THE EXECUTIVE COMM. |
NUENO INIESTA JOSE LUIS |
13/07/2012 |
5 |
|
|
CROISSIER BATISTA LUIS CARLOS |
13/07/2012 |
11 |
|
|
GARCIA PLANAS MARCET JOSE MARIA |
13/07/2012 |
9 |
|
ACCOUNTS' AUDITOR / HOLDER |
DELOITTE SL |
02/10/2013 |
17 |
|
CONSOLIDATED ACCOUNTS' AUDITOR |
DELOITTE SL |
02/10/2013 |
17 |
|
LAWYER (ADVISER) |
CARLOS BERTRAN LUIS |
19/02/1998 |
2 |
|
MISCELLANEOUS POSTS |
LUXURY LIBERTY SA |
13/07/2012 |
5 |
|
|
|
|
|
|
|
Social Body's Name |
Post published |
End Date |
Other Positions in this Company |
|
ARTHUR ANDERSEN Y CIA S COM |
ACCOUNTS' AUDITOR / HOLDER |
02/07/1999 |
4 |
|
|
ACCOUNTS' AUDITOR / HOLDER |
08/08/2001 |
|
|
|
ACCOUNTS' AUDITOR / HOLDER |
26/10/2001 |
|
|
|
ACCOUNTS' AUDITOR / HOLDER |
31/12/2002 |
|
|
BERGES LOBERA ANGEL |
MEMBER OF THE BOARD |
08/08/2001 |
7 |
|
|
MEMBER OF THE BOARD |
23/08/2006 |
|
|
|
MEMBER OF THE BOARD |
10/12/2007 |
|
|
|
MISCELLANEOUS POSTS |
10/12/2007 |
|
|
|
MEMBER OF THE BOARD |
02/09/2011 |
|
|
|
MEMBER |
13/07/2012 |
|
|
CARLOS BERTRAN LUIS |
SECRETARY |
20/11/2012 |
2 |
|
CASAL DOMINGUEZ DORINDA |
PROXY |
25/02/2014 |
1 |
|
CASTELLANO RIOS JOSE MARIA |
MEMBER |
17/02/2009 |
2 |
|
|
MISCELLANEOUS POSTS |
17/02/2009 |
|
|
CROISSIER BATISTA LUIS CARLOS |
MEMBER OF THE BOARD |
08/08/2001 |
11 |
|
|
MEMBER OF THE EXECUTIVE COMM. |
13/07/2012 |
|
|
|
MISCELLANEOUS POSTS |
13/07/2012 |
|
|
|
MEMBER OF THE BOARD |
13/07/2012 |
|
|
|
VICE CHAIRMAN |
23/08/2006 |
|
|
|
MEMBER OF THE BOARD |
23/08/2006 |
|
|
|
MEMBER OF THE BOARD |
18/12/2006 |
|
|
|
MEMBER |
10/12/2007 |
|
|
|
MEMBER OF THE BOARD |
02/09/2011 |
|
|
DE CARLOS BERTRAN LUIS |
EXECUTIVE COMMISSION SECRETARY |
13/07/2012 |
3 |
|
|
EXECUTIVE COMMISSION SECRETARY |
20/11/2012 |
|
|
|
SECRETARY |
20/11/2012 |
|
|
DELOITTE & TOUCHE ESPAÑA SL |
ACCOUNTS' AUDITOR / HOLDER |
26/09/2006 |
5 |
|
|
CONSOLIDATED ACCOUNTS' AUDITOR |
26/09/2006 |
|
|
|
ACCOUNTS' AUDITOR / HOLDER |
18/02/2005 |
|
|
|
ACCOUNTS' AUDITOR / HOLDER |
18/02/2005 |
|
|
|
ACCOUNTS' AUDITOR / HOLDER |
28/10/2005 |
|
|
DELOITTE S L |
CONSOLIDATED ACCOUNTS' AUDITOR |
04/01/2008 |
5 |
|
|
ACCOUNTS' AUDITOR / HOLDER |
04/01/2008 |
|
|
|
ACCOUNTS' AUDITOR / HOLDER |
13/03/2008 |
|
|
|
CONSOLIDATED ACCOUNTS' AUDITOR |
13/03/2008 |
|
|
|
CONSOLIDATED ACCOUNTS' AUDITOR |
06/09/2008 |
|
|
DELOITTE SL |
ACCOUNTS' AUDITOR / HOLDER |
25/09/2009 |
17 |
|
|
CONSOLIDATED ACCOUNTS' AUDITOR |
25/09/2009 |
|
|
|
CONSOLIDATED ACCOUNTS' AUDITOR |
30/08/2010 |
|
|
|
ACCOUNTS' AUDITOR / HOLDER |
30/08/2010 |
|
|
|
CONSOLIDATED ACCOUNTS' AUDITOR |
04/01/2008 |
|
|
|
ACCOUNTS' AUDITOR / HOLDER |
04/01/2008 |
|
|
|
CONSOLIDATED ACCOUNTS' AUDITOR |
06/09/2008 |
|
|
|
ACCOUNTS' AUDITOR / HOLDER |
06/09/2008 |
|
|
|
CONSOLIDATED ACCOUNTS' AUDITOR |
02/09/2011 |
|
|
|
ACCOUNTS' AUDITOR / HOLDER |
02/09/2011 |
|
|
|
ACCOUNTS' AUDITOR / HOLDER |
13/03/2008 |
|
|
|
CONSOLIDATED ACCOUNTS' AUDITOR |
01/10/2012 |
|
|
|
ACCOUNTS' AUDITOR / HOLDER |
01/10/2012 |
|
|
|
ACCOUNTS' AUDITOR / HOLDER |
02/10/2013 |
|
|
|
CONSOLIDATED ACCOUNTS' AUDITOR |
02/10/2013 |
|
|
DOMINGUEZ FERNANDEZ ADOLFO |
CHIEF EXECUTIVE OFFICER |
08/08/2001 |
13 |
|
|
PRESIDENT |
08/08/2001 |
|
|
|
PRESIDENT |
23/08/2006 |
|
|
|
MEMBER OF THE BOARD |
23/08/2006 |
|
|
|
MEMBER OF THE BOARD |
11/03/1997 |
|
|
|
MEMBER OF THE BOARD |
08/08/2001 |
|
|
|
CHIEF EXECUTIVE OFFICER |
11/03/1997 |
|
|
|
CHIEF EXECUTIVE OFFICER |
10/11/2006 |
|
|
|
MEMBER OF THE BOARD |
02/09/2011 |
|
|
|
CHIEF EXECUTIVE OFFICER |
26/10/2011 |
|
|
DOMINGUEZ FERNANDEZ FRANCISCO JAVIER |
MEMBER OF THE BOARD |
11/03/1997 |
2 |
|
|
CHIEF EXECUTIVE OFFICER |
11/03/1997 |
|
|
DOMINGUEZ FERNANDEZ INMACULADA |
MEMBER OF THE BOARD |
19/05/1992 |
2 |
|
|
PRESIDENT |
19/05/1992 |
|
|
DOMINGUEZ FERNANDEZ JESUS |
PRESIDENT |
19/10/1992 |
4 |
|
|
PRESIDENT |
11/03/1997 |
|
|
|
MEMBER OF THE BOARD |
11/03/1997 |
|
|
|
CHIEF EXECUTIVE OFFICER |
11/03/1997 |
|
|
DOMINGUEZ FERNANDEZ JOSEFINA |
MEMBER OF THE BOARD |
11/03/1997 |
3 |
|
|
CHIEF EXECUTIVE OFFICER |
11/03/1997 |
|
|
|
SECRETARY |
11/03/1997 |
|
|
FERNANDEZ NOVO JUAN |
PROXY |
19/02/1998 |
4 |
|
|
PROXY |
18/03/1999 |
|
|
FERNANDEZ NOVO JUAN MANUEL |
PROXY |
22/11/2013 |
8 |
|
|
PROXY |
22/11/2013 |
|
|
|
JOINT ATTORNEY |
22/11/2013 |
|
|
|
MEMBER OF THE BOARD |
23/08/2006 |
|
|
|
MEMBER OF THE BOARD |
08/08/2001 |
|
|
|
MEMBER OF THE BOARD |
02/09/2011 |
|
|
|
PROXY |
12/03/2012 |
|
|
GARCIA PLANAS MARCET JOSE MARIA |
MEMBER OF THE BOARD |
08/08/2001 |
9 |
|
|
MEMBER OF THE BOARD |
02/09/2011 |
|
|
|
PRESIDENT OF THE EXECUTIVE COMM. |
02/09/2011 |
|
|
|
MEMBER OF THE BOARD |
23/08/2006 |
|
|
|
MEMBER OF THE BOARD |
09/05/2008 |
|
|
|
PRESIDENT OF THE EXECUTIVE COMM. |
13/07/2012 |
|
|
|
MEMBER OF THE EXECUTIVE COMM. |
13/07/2012 |
|
|
GONZALEZ ALVAREZ ELENA |
MEMBER OF THE BOARD |
30/08/2010 |
2 |
|
LUXURY LIBERTY SA |
MEMBER OF THE BOARD |
18/12/2006 |
5 |
|
|
MEMBER OF THE BOARD |
30/08/2010 |
|
|
|
MEMBER |
13/07/2012 |
|
|
NUENO INIESTA JOSE LUIS |
MEMBER OF THE EXECUTIVE COMM. |
13/07/2012 |
5 |
|
|
MEMBER OF THE BOARD |
09/05/2008 |
|
|
|
MEMBER OF THE BOARD |
02/09/2011 |
|
|
|
MEMBER OF THE BOARD |
23/08/2006 |
|
|
RAMOS MENDEZ FRANCISCO |
SECRETARY |
19/02/1998 |
1 |
|
RIOS ESTRELLA MARTA |
VICE SECRETARY |
20/11/2012 |
5 |
|
|
VICE SECRETARY |
13/07/2012 |
|
|
RODRIGUEZ TREBOLLE FERNANDO |
PROXY |
18/03/1999 |
4 |
|
|
VICE SECRETARY |
09/05/2008 |
|
|
TAUNTON GAITAN SANTIAGO |
PROXY |
15/07/2011 |
1 |
|
TREBOLLE RODRIGUEZ FERNANDO |
VICE SECRETARY |
03/07/2009 |
2 |
|
|
PROXY |
20/06/2011 |
|
|
VELAZQUEZ GAZTELU RUIZ CANDIDO |
MEMBER OF THE BOARD |
13/01/1999 |
5 |
|
|
MEMBER OF THE BOARD |
08/08/2001 |
|
|
|
VICE CHAIRMAN |
08/08/2001 |
|
|
|
MEMBER OF THE BOARD |
23/08/2006 |
|
|
|
MEMBER |
18/12/2006 |
|
|
|
||
|
|
|
|
|
Post |
NIF |
Name |
|
FINANCIAL DIRECTOR |
|
JUAN FERNANDEZ NOVO |
|
MANAGING DIRECTOR |
|
ADOLFO DOMINGUEZ FERNANDEZ |
|
|
|
|
|
|
Section enabling assessment of the degree of compliance of
the company queried with its payment obligations. It provides information on the
existence and nature of all stages of Insolvency and Legal Proceedings
published with reference to the Company in the country's various Official
Bulletins and national newspapers, as well Defaults Registered in the main
national credit bureaus (ASNEF Industrial and RAI ).
> Summary
Chronological summary
|
|
|
Number of Publications |
Amount (_) |
Start date |
End date |
|
Insolvency Proceedings, Bankruptcy and Suspension of Payments |
|
Unpublished |
--- |
--- |
--- |
|
Request/Declaration |
|
0 |
--- |
date |
|
|
Proceedings |
|
--- |
--- |
|
--- |
|
Resolution |
|
--- |
--- |
|
--- |
|
Defaults on debt with Financial Institutions and Large Companies |
Bank and Commercial Delinquency |
None |
0 |
|
|
|
Status: Friendly |
|
--- |
|
|
|
|
Status: Pre-Litigation |
|
--- |
|
|
|
|
Status: Litigation |
|
--- |
|
|
|
|
Status: Non-performing |
|
--- |
|
|
|
|
Status: insolvency proceedings, bankruptcy and suspension of
payments |
|
--- |
|
|
|
|
Other status |
|
--- |
|
|
|
|
Legal and Administrative Proceedings |
|
2 |
--- |
09/02/2009 |
12/03/2014 |
|
Notices of defaults and enforcement |
|
2 |
--- |
|
--- |
|
Seizures |
|
--- |
--- |
|
--- |
|
Auctions |
|
--- |
--- |
|
--- |
|
Declarations of insolvency and bad debt |
|
--- |
--- |
|
--- |
|
Proceedings heard by the Civil Court |
|
Unpublished |
--- |
|
|
|
Proceedings heard by the Labour Court |
|
Unpublished |
--- |
|
|
|
Positive Factors |
Adverse Factors |
|
It has been found to have regular payment performance and
has paid all of its debts in a timely manner. It is one of the major domestic companies in terms of
sales volume. Significant level of financial autonomy. The asset is
financed mostly with equity and financing with maturity exceeding one year,
providing a solid financial structure. The cost of debt of [@ BDR_DENOMINACION], depending on the
volume of external financing sources posing, is considered medium level in
relation to the reference companies. La evolución de la estructura de endeudamiento durante los
dos últimos ejercicios señala una disminución de la deuda con entidades de
crédito y acreedores comerciales respecto a la totalidad del pasivo . Cuanto
menor sea el nivel de endeudamiento, menor será su dependencia con respecto a
los suministradores de capital y más garantía presentará su situación financiera. |
Presents legal proceedings. Debts resulting from
non-payment to Public Administrations or from lawsuits filed by individuals
before the Courts of the different jurisdictions have been published in the
Official Gazettes. It has no return from its main operating activity.This
might deteriorate its financial situation. Moreover, this productivity has
decreased in comparison with the previous financial year. It presents an inefficient resources management. Resources
and variable costs management associated with the activity itself are not
productive, since operating expenses exceed income. Stock turnover decreaseThe stock turnover rate with
respect to debtors has decreased as compared with that of the previous fiscal
year, a fact that indicates, in principle, a deteriorated financial
situation. Private consumption continues to have, in spite of some
signs of improvement, very low rates , thus showing great weakness. |
|
|
|
|
|
|
>
Probabilidad Estimada de Impago para los próximos 12 meses: 1.551 %
|
Sector in which comparison is carried out : 477 Retail sale of other goods in specialised stores |
|
|
Relative Position:
|
The company's comparative analysis with the rest of the companies
that comprise the sector, shows the company holds a better position with regard
to the probability of non-compliance.
The 83.00% of the companies of the sector ADOLFO DOMINGUEZ SA.
belongs to show a higher probability of non-compliance.
The probability of the company's non-compliance with its
payment obligations within deadlines estimated by our qualifications models is
1.551%.
In the event they fail to comply with the payment, the
seriousness of the loss will depend on factors such as the promptness of the
commencement of the charging management, the existence of executive documents
which match the credit or the existence of guarantees and free debt assets
under the name of the debtor. Therefore, the probability of non-compliance
should not be solely interpreted as the total loss of the owed amount.
|
|
|
|
|
|
|
Summary of Judicial Claims |
|
|
|
|
|
|
|
|
||
|
|
|
No se han publicado |
|
|
|
|
No se han publicado |
|
|
|
|
||
|
|
|
No se han publicado |
|
|
|
|
|
|
|
|
|
No se han publicado |
|
|
|
|
|
|
|
|
|
||
|
|
|
No se han publicado |
|
|
|
|
No se han publicado |
|
|
|
|
||
|
|
|
No se han publicado |
|
|
Incidences Detailed |
|
Incidences with the Social Security |
|
|
|
Last Published Stage: |
ACTA DE INFRACCION |
|
Amount of the incidence: |
626,00 E |
|
Requested by: |
SEGURIDAD SOCIAL |
|
Published domicile: |
SOL. 8; TALAVERA DE LA REINA C.P.:45600 (TOLEDO) |
|
Source: |
B.O.P. SALAMANCA Nº26, 2009 PAGINA 11 |
|
Incidences with the Local Administration |
|
|
|
Last Published Stage: |
EXECUTION NOTIFICATION |
|
Record Number: |
806087 |
|
Amount of the incidence: |
0,00 E |
|
Requested by: |
ADMINISTRACION LOCAL |
|
Published domicile: |
(DESCONOCIDA) |
|
Source: |
B.O.P. CADIZ Nº53, 2014 PAGINA 7 |
|
|
|
|
|
|
|
PARTICIPATES
IN: |
24 Entities |
|
SHAREHOLDERS: |
6 Entities |
|
ABSORBS
TO: |
6 Entities |
|
HAS IN ITS
ADMINISTRATION BOARD TO: |
1 Entities |
|
IS RELATED
WITH: |
1 Entities |
>
Shareholders
|
Relationship |
Entity |
Province |
Shareholding
stake |
|
SHAREHOLDERS |
ADOLFO
DOMINGUEZ FERNANDEZ |
|
31.51 |
|
|
ANTONIO PUIG
SA |
BARCELONA |
14.8 |
|
|
LIBERTAS 7
SOCIEDAD ANONIMA |
VALENCIA |
0.07 |
|
|
LA PREVISION
MALLORQUINA DE SEGUROS SA |
BARCELONA |
7.56 |
|
|
LUXURY LIBERTY
SA |
VALENCIA |
10.22 |
|
|
NCG BANCO SA |
LA CORUÑA |
4.98 |
|
PARTICIPATES
IN |
ADOLFO
DOMINGUEZ LUXEMBOURG, S.A. |
|
98.2 |
|
|
ADOLFO
DOMINGUEZ (PORTUGAL) MODA LDA |
|
55 |
|
|
ADOLFO
DOMINGUEZ JAPAN COMPANY, S.A. |
|
100 |
|
|
ADOLFO
DOMINGUEZ BELGIQUE, S.A. |
|
94 |
|
|
ADOLFO
DOMINGUEZ USA INC |
|
100 |
|
|
ADOLFO
DOMINGUEZ SARL (FRANCIA) |
|
100 |
|
|
TRESPASS,
SOCIEDAD ANONIMA, DE CV (MEXICO) |
|
|
|
|
POLA BEIRA SL |
ORENSE |
24 |
|
|
ADOLFO
DOMINGUEZ ISRAEL, S.A. |
|
100 |
|
|
ADOLFO DOMINGUEZ
PANAMA, S.A. |
|
51 |
|
|
ADOLFO
DOMINGUEZ, SOCIEDAD ANONIMA, (REINO UNIDO) |
|
99.99 |
|
|
ADOLFO
DOMINGUEZ EL SALVADOR, SOCIEDAD ANONIMA, DE CV (EL SALVADOR) |
|
51 |
|
|
ADOLFO
DOMINGUEZ ISRAEL, SOCIEDAD ANONIMA, (ISRAEL) |
|
100 |
|
|
ADOLFO
DOMINGUEZ ITALIA, SOCIEDAD LIMITADA, (ITALIA) |
|
100 |
|
|
ADOLFO
DOMINGUEZ PANAMA, SOCIEDAD ANONIMA, (PANAMA) |
|
51 |
|
|
ADOLFO
DOMINGUEZ PERU SAC (PERU) |
|
51 |
|
|
ADOLFO
DOMINGUEZ SHANGHAI CO, SOCIEDAD ANONIMA, (CHINA) |
|
100 |
|
|
GIG IN THE SKY
(COSTA RICA), S.A. |
|
51 |
|
|
TORMATO,
SOCIEDAD ANONIMA, DE CV (MEXICO) |
|
100 |
|
|
ADOLFO
DOMINGUEZ ITALIA, S.L. |
|
100 |
|
|
ADOLFO
DOMINGUEZ USA INC (EEUU) |
|
99.99 |
|
|
ADOLFO DOMINGUEZ
EL SALVADOR, SOCIEDAD ANONIMA, DE CV |
|
51 |
|
|
ADOLFO
DOMINGUEZ PERU SAC |
|
51 |
|
|
ADOLFO
DOMINGUEZ LUXEMBOURG, SOCIEDAD ANONIMA, (LUXEMBURGO) |
|
98.2 |
> Other
relationships
|
Relationship |
Entity |
Province |
Shareholding stake |
|
IS RELATED
WITH |
| | |
|
|
|
|
NCG BANCO SA |
LA CORUÑA |
|
|
ABSORBS TO |
ADOLFO
DOMINGUEZ E HIJOS SOCIEDAD LIMITADA |
ORENSE |
|
|
|
ADOLFO
DOMINGUEZ SA. |
ORENSE |
|
|
|
MOLIBA
SOCIEDAD LIMITADA |
ORENSE |
|
|
|
CEDIAD SL. |
ORENSE |
|
|
|
POLA SOMBRA SL |
ORENSE |
|
|
|
CRAZY DIAMOND
SL |
ORENSE |
|
|
HAS IN ITS
ADMINISTRATION BOARD TO |
LUXURY LIBERTY
SA |
VALENCIA |
|
|
|
|
|
Total Sales 2013 |
127.617.480 |
|
|
|
|
|
|
Financial Years Presented
|
Ejercicio |
Tipo de Cuentas Anuales |
Fecha Presentacion |
|
2013 |
Consolidadas |
No publicado en BORME |
|
2013 |
Normales |
No publicado en BORME |
|
2012 |
Consolidadas |
No publicado en BORME |
|
2012 |
Normales |
January 2013 |
|
2011 |
Consolidadas |
July 2012 |
|
2011 |
Normales |
April 2012 |
|
2010 |
Consolidadas |
August 2011 |
|
2010 |
Normales |
August 2011 |
|
2009 |
Consolidadas |
August 2010 |
|
2009 |
Normales |
August 2010 |
|
2008 |
Consolidadas |
December 2008 |
|
2008 |
Consolidadas |
December 2009 |
|
2008 |
Normales |
December 2008 |
|
2008 |
Normales |
December 2009 |
|
2007 |
Consolidadas |
October 2008 |
|
2007 |
Normales |
October 2008 |
|
2006 |
Consolidadas |
December 2007 |
|
2006 |
Normales |
November 2007 |
|
2005 |
Consolidadas |
July 2006 |
|
2005 |
Normales |
July 2006 |
|
2004 |
Consolidadas |
October 2005 |
|
2004 |
Normales |
October 2005 |
|
2003 |
Consolidadas |
January 2005 |
|
2003 |
Normales |
January 2005 |
|
2002 |
Normales |
September 2003 |
|
2002 |
Normales |
September 2004 |
|
2001 |
Consolidadas |
August 2002 |
|
2001 |
Normales |
August 2002 |
|
2000 |
Consolidadas |
October 2001 |
|
2000 |
Normales |
October 2001 |
|
1999 |
Consolidadas |
June 2000 |
|
1999 |
Normales |
June 2000 |
|
1998 |
Consolidadas |
June 1999 |
|
1998 |
Normales |
June 2001 |
|
1997 |
Normales |
July 1998 |
|
1996 |
Normales |
July 1997 |
|
1995 |
Normales |
September 1996 |
|
1994 |
Normales |
December 1995 |
|
1993 |
Normales |
October 1994 |
|
1992 |
Normales |
January 1994 |
|
1991 |
Normales |
August 1992 |
|
1990 |
Normales |
October 1992 |
|
1989 |
Normales |
August 1990 |
The data in the report regarding the last Company
Accounts submitted by the company is taken from the TRADE REGISTER serving the
region in which the company's address is located 28/02/2013
> Balance en formato Normal de acuerdo al
Nuevo Plan General Contable 2007
Information
corresponding to the fiscal year
2013 2012 2011 2010 2009 is taken from information
submitted to the TRADE REGISTER. Data corresponding to fiscal years before
2013 2012 2011 2010 2009 has been compiled based on
the equivalence criteria stipulated in Act JUS/206/2009. Where the provisions
of the Act did not establish relevant equivalence criteria, axesor created such
criteria using its own methodology. To view details on the methodology.
|
|
ORIGINAL |
ORIGINAL |
ORIGINAL |
ORIGINAL |
ORIGINAL |
|
|
Assets |
2013 |
2012 |
2011 |
2010 |
2009 |
|
|
A) NON-CURRENT ASSETS: 11000 |
82.616.891,00 |
93.618.689,00 |
106.699.163,00 |
109.700.475,00 |
117.777.457,00 |
|
|
I. Intangible fixed assets : 11100 |
759.120,00 |
1.999.750,00 |
2.302.142,00 |
1.686.020,00 |
1.284.165,00 |
|
|
1. Development:
11110 |
0,00 |
0,00 |
0,00 |
0,00 |
0,00 |
|
|
2. Concessions:
11120 |
24.615,00 |
25.302,00 |
25.988,00 |
26.675,00 |
27.361,00 |
|
|
3. Patents, licencing,
trade marks and similar: 11130 |
435.301,00 |
0,00 |
480.923,00 |
343.055,00 |
287.623,00 |
|
|
4. Goodwill:
11140 |
0,00 |
0,00 |
0,00 |
0,00 |
0,00 |
|
|
5. IT applications:
11150 |
299.204,00 |
1.429.432,00 |
1.775.232,00 |
749.047,00 |
384.774,00 |
|
|
6. Investigation:
11160 |
0,00 |
0,00 |
0,00 |
0,00 |
0,00 |
|
|
7. Other intangible
fixed assets: 11170 |
0,00 |
545.016,00 |
19.999,00 |
567.243,00 |
584.407,00 |
|
|
II. Tangible fixed assets : 11200 |
33.789.257,00 |
54.728.822,00 |
72.893.545,00 |
77.614.904,00 |
83.833.469,00 |
|
|
1. Land and buildings:
11210 |
11.051.865,00 |
11.454.574,00 |
18.506.303,00 |
18.738.006,00 |
18.969.709,00 |
|
|
2. Technical
installations and other tangible fixed assets: 11220 |
22.737.392,00 |
43.274.248,00 |
54.283.076,00 |
57.052.302,00 |
63.518.931,00 |
|
|
3. Tangible asset in progress
and advances: 11230 |
0,00 |
0,00 |
104.166,00 |
1.824.596,00 |
1.344.829,00 |
|
|
III. Real estate investment: 11300 |
2.432.156,00 |
2.584.141,00 |
2.622.770,00 |
2.661.400,00 |
3.117.503,00 |
|
|
1. Land: 11310 |
1.397.241,00 |
0,00 |
0,00 |
0,00 |
0,00 |
|
|
2. Buildings:
11320 |
1.034.915,00 |
2.584.141,00 |
2.622.770,00 |
2.661.400,00 |
3.117.503,00 |
|
|
IV. Long-term investments in Group
companies and associates : 11400 |
22.321.731,00 |
23.768.027,00 |
21.522.606,00 |
22.813.785,00 |
25.162.798,00 |
|
|
1. Equity instruments:
11410 |
12.747.611,00 |
0,00 |
17.108.104,00 |
19.788.557,00 |
18.210.538,00 |
|
|
2. Credits to businesses:
11420 |
9.574.120,00 |
0,00 |
4.414.502,00 |
3.025.228,00 |
6.952.260,00 |
|
|
3. Debt securities:
11430 |
0,00 |
0,00 |
0,00 |
0,00 |
0,00 |
|
|
4. Derivatives :
11440 |
0,00 |
0,00 |
0,00 |
0,00 |
0,00 |
|
|
5. Other financial
assets : 11450 |
0,00 |
15.479.098,00 |
0,00 |
0,00 |
0,00 |
|
|
6. Other investments:
11460 |
0,00 |
8.288.929,00 |
0,00 |
0,00 |
0,00 |
|
|
V. Long-term financial investments: 11500 |
4.958.606,00 |
2.780.695,00 |
2.615.373,00 |
2.747.963,00 |
3.154.267,00 |
|
|
1. Equity instruments:
11510 |
0,00 |
2.396.639,00 |
0,00 |
0,00 |
0,00 |
|
|
2. Credits to third
parties : 11520 |
502.633,00 |
0,00 |
2.615.373,00 |
2.747.963,00 |
0,00 |
|
|
3. Debt securities:
11530 |
0,00 |
0,00 |
0,00 |
0,00 |
0,00 |
|
|
4. Derivatives :
11540 |
0,00 |
0,00 |
0,00 |
0,00 |
0,00 |
|
|
5. Other financial assets
: 11550 |
4.455.973,00 |
384.056,00 |
0,00 |
0,00 |
0,00 |
|
|
6. Other investments:
11560 |
0,00 |
0,00 |
0,00 |
0,00 |
3.154.267,00 |
|
|
VI. Assets for deferred tax : 11600 |
18.027.641,00 |
7.757.254,00 |
4.302.995,00 |
1.680.995,00 |
779.821,00 |
|
|
VII. Non-current trade debts : 11700 |
328.380,00 |
0,00 |
439.732,00 |
495.408,00 |
445.434,00 |
|
|
B) CURRENT ASSETS: 12000 |
64.236.114,00 |
83.628.069,00 |
65.499.985,00 |
68.517.302,00 |
63.656.221,00 |
|
|
I. Non-current assets held for sale :
12100 |
0,00 |
0,00 |
0,00 |
0,00 |
0,00 |
|
|
II. Stocks: 12200 |
34.654.809,00 |
45.776.085,00 |
35.385.971,00 |
37.748.324,00 |
35.204.334,00 |
|
|
1. Commercial:
12210 |
34.251.010,00 |
44.881.477,00 |
0,00 |
0,00 |
31.918.957,00 |
|
|
2. Primary material
and other supplies: 12220 |
403.799,00 |
894.608,00 |
1.173.790,00 |
912.282,00 |
614.241,00 |
|
|
3. Work in progress:
12230 |
0,00 |
0,00 |
0,00 |
3.006.408,00 |
2.671.136,00 |
|
|
a) Of long-term production cycle : 12231 |
0,00 |
0,00 |
0,00 |
0,00 |
0,00 |
|
|
b)
Of short-term production cycle : 12232 |
0,00 |
0,00 |
0,00 |
3.006.408,00 |
2.671.136,00 |
|
|
4. Finished goods:
12240 |
0,00 |
0,00 |
34.212.181,00 |
33.625.573,00 |
0,00 |
|
|
a)
Of long-term production cycle : 12241 |
0,00 |
0,00 |
0,00 |
0,00 |
0,00 |
|
|
b) Of short-term production cycle : 12242 |
0,00 |
0,00 |
0,00 |
33.625.573,00 |
0,00 |
|
|
5. By-products, residues
and recycled materials: 12250 |
0,00 |
0,00 |
0,00 |
0,00 |
0,00 |
|
|
6. Advances to
suppliers: 12260 |
0,00 |
0,00 |
0,00 |
204.061,00 |
0,00 |
|
|
III. Trade debtors and others receivable
accounts: 12300 |
13.223.957,00 |
29.736.510,00 |
14.782.933,00 |
18.446.025,00 |
18.908.620,00 |
|
|
1. Trade debtors /
accounts receivable: 12310 |
12.827.721,00 |
14.553.673,00 |
14.357.788,00 |
18.020.519,00 |
18.488.846,00 |
|
|
a) Long-term receivables from sales and services supplied : 12311 |
0,00 |
0,00 |
0,00 |
0,00 |
0,00 |
|
|
b) Customers for sales and provisions of services : 12312 |
0,00 |
14.553.673,00 |
0,00 |
18.020.519,00 |
18.488.846,00 |
|
|
2. Customers, Group
companies and associates : 12320 |
0,00 |
0,00 |
0,00 |
0,00 |
0,00 |
|
|
3. Other accounts
receivable: 12330 |
229.267,00 |
15.034.752,00 |
265.715,00 |
350.784,00 |
377.699,00 |
|
|
4. Personnel:
12340 |
0,00 |
0,00 |
0,00 |
0,00 |
0,00 |
|
|
5. Assets for deferred
tax: 12350 |
149.204,00 |
148.085,00 |
56.230,00 |
0,00 |
0,00 |
|
|
6. Other debtors, including
tax and social security: 12360 |
17.765,00 |
0,00 |
103.200,00 |
74.722,00 |
42.075,00 |
|
|
7. Called up share
capital: 12370 |
0,00 |
0,00 |
0,00 |
0,00 |
0,00 |
|
|
IV. Short-term investments in Group companies
and associates: 12400 |
0,00 |
0,00 |
0,00 |
0,00 |
0,00 |
|
|
1. Equity instruments:
12410 |
0,00 |
0,00 |
0,00 |
0,00 |
0,00 |
|
|
2. Credits to
businesses: 12420 |
0,00 |
0,00 |
0,00 |
0,00 |
0,00 |
|
|
3. Debt securities:
12430 |
0,00 |
0,00 |
0,00 |
0,00 |
0,00 |
|
|
4. Derivatives :
12440 |
0,00 |
0,00 |
0,00 |
0,00 |
0,00 |
|
|
5. Other financial
assets : 12450 |
0,00 |
0,00 |
0,00 |
0,00 |
0,00 |
|
|
6. Other investments:
12460 |
0,00 |
0,00 |
0,00 |
0,00 |
0,00 |
|
|
V. Short-term financial investments :
12500 |
9.752.892,00 |
2.731.905,00 |
5.321.256,00 |
88.087,00 |
4.955.691,00 |
|
|
1. Equity instruments:
12510 |
0,00 |
0,00 |
0,00 |
88.087,00 |
0,00 |
|
|
2. Credits to
businesses: 12520 |
142.823,00 |
0,00 |
0,00 |
0,00 |
0,00 |
|
|
3. Debt securities:
12530 |
9.578.712,00 |
0,00 |
0,00 |
0,00 |
0,00 |
|
|
4. Derivatives :
12540 |
0,00 |
0,00 |
0,00 |
0,00 |
0,00 |
|
|
5. Other financial
assets : 12550 |
31.357,00 |
2.731.905,00 |
0,00 |
0,00 |
0,00 |
|
|
6. Other investments:
12560 |
0,00 |
0,00 |
5.321.256,00 |
0,00 |
4.955.691,00 |
|
|
VI. Short-term accruals: 12600 |
457.871,00 |
282.425,00 |
351.279,00 |
0,00 |
359.332,00 |
|
|
VII. Cash and other equivalent liquid
assets : 12700 |
6.146.585,00 |
5.101.144,00 |
9.658.546,00 |
11.877.929,00 |
4.228.244,00 |
|
|
1. Treasury:
12710 |
3.646.585,00 |
5.101.144,00 |
1.358.546,00 |
3.477.929,00 |
2.699.512,00 |
|
|
2. Other equivalent
liquid assets: 12720 |
2.500.000,00 |
0,00 |
8.300.000,00 |
8.400.000,00 |
1.528.732,00 |
|
|
TOTAL ASSETS (A + B) : 10000 |
146.853.005,00 |
177.246.758,00 |
172.199.148,00 |
178.217.777,00 |
181.433.678,00 |
|
|
|
ORIGINAL |
ORIGINAL |
ORIGINAL |
ORIGINAL |
ORIGINAL |
|
|
Liabilities and Net Worth |
2013 |
2012 |
2011 |
2010 |
2009 |
|
|
A) NET WORTH: 20000 |
96.409.629,00 |
119.546.266,00 |
128.112.533,00 |
133.399.869,00 |
134.808.159,00 |
|
|
A-1) Shareholders' equity:
21000 |
96.092.728,00 |
119.185.453,00 |
127.596.300,00 |
132.690.954,00 |
134.082.162,00 |
|
|
I. Capital: 21100 |
5.565.665,00 |
5.488.061,00 |
5.488.061,00 |
5.488.061,00 |
5.488.061,00 |
|
|
1. Registered capital
: 21110 |
5.565.665,00 |
5.488.061,00 |
5.488.061,00 |
5.488.061,00 |
5.488.061,00 |
|
|
2. (Uncalled capital):
21120 |
0,00 |
0,00 |
0,00 |
0,00 |
0,00 |
|
|
II. Share premium: 21200 |
422.399,00 |
0,00 |
0,00 |
0,00 |
0,00 |
|
|
III. Reserves: 21300 |
126.547.346,00 |
126.581.811,00 |
126.581.811,00 |
127.222.086,00 |
123.636.063,00 |
|
|
1. Legal y
estatutarias: 21310 |
1.097.612,00 |
1.097.612,00 |
1.097.612,00 |
1.097.612,00 |
1.097.612,00 |
|
|
2. Other reserves:
21320 |
125.449.734,00 |
125.484.199,00 |
125.484.199,00 |
126.124.474,00 |
122.538.451,00 |
|
|
IV. (Common stock equity): 21400 |
-500.003,00 |
0,00 |
0,00 |
0,00 |
0,00 |
|
|
V. Results from previous periods:
21500 |
-12.884.419,00 |
-4.473.572,00 |
-19.193,00 |
0,00 |
0,00 |
|
|
1. Brought forward:
21510 |
0,00 |
0,00 |
0,00 |
0,00 |
0,00 |
|
|
2. (Negative results from
previous periods): 21520 |
-12.884.419,00 |
-4.473.572,00 |
-19.193,00 |
0,00 |
0,00 |
|
|
VI. Other shareholders'
contributions: 21600 |
0,00 |
0,00 |
0,00 |
0,00 |
0,00 |
|
|
VII. Result of the period: 21700 |
-23.058.260,00 |
-8.410.847,00 |
-4.454.379,00 |
-19.193,00 |
4.958.038,00 |
|
|
VIII. (Interim dividend): 21800 |
0,00 |
0,00 |
0,00 |
0,00 |
0,00 |
|
|
IX. Other net worth instruments:
21900 |
0,00 |
0,00 |
0,00 |
0,00 |
0,00 |
|
|
A-2) Adjustments due to changes in value:
22000 |
0,00 |
0,00 |
0,00 |
0,00 |
0,00 |
|
|
I. Financial assets held for sale:
22100 |
0,00 |
0,00 |
0,00 |
0,00 |
0,00 |
|
|
II. Hedge operations: 22200 |
0,00 |
0,00 |
0,00 |
0,00 |
0,00 |
|
|
III. Linked non-current assets and
liabilities held for sale : 22300 |
0,00 |
0,00 |
0,00 |
0,00 |
0,00 |
|
|
IV. Exchange rate difference: 22400 |
0,00 |
0,00 |
0,00 |
0,00 |
0,00 |
|
|
V. Other: 22500 |
0,00 |
0,00 |
0,00 |
0,00 |
0,00 |
|
|
A-3) Received subsidies, donations and
legacies: 23000 |
316.901,00 |
360.813,00 |
516.233,00 |
708.915,00 |
725.997,00 |
|
|
B) NON-CURRENT LIABILITIES: 31000 |
30.524.867,00 |
18.560.115,00 |
19.786.412,00 |
22.188.717,00 |
23.848.539,00 |
|
|
I. Long-term provisions: 31100 |
0,00 |
0,00 |
0,00 |
0,00 |
0,00 |
|
|
1. Long-term employee
benefits liability: 31110 |
0,00 |
0,00 |
0,00 |
0,00 |
0,00 |
|
|
2. Environmental
actions: 31120 |
0,00 |
0,00 |
0,00 |
0,00 |
0,00 |
|
|
3. Restructuring
provisions: 31130 |
0,00 |
0,00 |
0,00 |
0,00 |
0,00 |
|
|
4. Other provisions:
31140 |
0,00 |
0,00 |
0,00 |
0,00 |
0,00 |
|
|
II Long-term creditors: 31200 |
29.629.185,00 |
18.252.591,00 |
19.447.088,00 |
21.764.875,00 |
23.415.437,00 |
|
|
1. Liabilities and
other securities: 31210 |
0,00 |
0,00 |
0,00 |
0,00 |
0,00 |
|
|
2. Amounts owed to
credit institutions: 31220 |
24.905.119,00 |
15.573.313,00 |
18.057.654,00 |
20.502.049,00 |
22.017.645,00 |
|
|
3. Creditors from
financial leasing: 31230 |
0,00 |
0,00 |
0,00 |
0,00 |
0,00 |
|
|
4. Derivatives :
31240 |
0,00 |
0,00 |
0,00 |
0,00 |
0,00 |
|
|
5. Other financial
liabilities : 31250 |
4.724.066,00 |
2.679.278,00 |
1.389.434,00 |
1.262.826,00 |
1.397.792,00 |
|
|
III. Long-term debts with Group companies
and associates: 31300 |
662.984,00 |
0,00 |
0,00 |
0,00 |
0,00 |
|
|
IV. Liabilities for deferred tax:
31400 |
232.698,00 |
307.524,00 |
339.324,00 |
423.842,00 |
433.102,00 |
|
|
V. Long-term accruals: 31500 |
0,00 |
0,00 |
0,00 |
0,00 |
0,00 |
|
|
VI. Non-current trade creditors :
31600 |
0,00 |
0,00 |
0,00 |
0,00 |
0,00 |
|
|
VII. Special long-term debts : 31700 |
0,00 |
0,00 |
0,00 |
0,00 |
0,00 |
|
|
C) CURRENT LIABILITIES : 32000 |
19.918.509,00 |
39.140.377,00 |
24.300.203,00 |
22.629.191,00 |
22.776.980,00 |
|
|
I. Liabilities linked to non-current assets
held for sale: 32100 |
0,00 |
0,00 |
0,00 |
0,00 |
0,00 |
|
|
II. Short-term provisions: 32200 |
150.000,00 |
0,00 |
0,00 |
0,00 |
0,00 |
|
|
III. Short-term creditors : 32300 |
4.181.436,00 |
16.186.353,00 |
7.709.220,00 |
2.698.218,00 |
1.780.787,00 |
|
|
1. Liabilities and other
securities: 32310 |
0,00 |
0,00 |
0,00 |
0,00 |
0,00 |
|
|
2. Amounts owed to
credit institutions: 32320 |
2.576.579,00 |
15.703.018,00 |
7.386.895,00 |
2.563.252,00 |
1.693.102,00 |
|
|
3. Creditors from financial
leasing: 32330 |
0,00 |
0,00 |
0,00 |
0,00 |
0,00 |
|
|
4. Derivatives :
32340 |
0,00 |
0,00 |
0,00 |
0,00 |
0,00 |
|
|
5. Other financial
liabilities : 32350 |
1.604.857,00 |
483.335,00 |
322.325,00 |
134.966,00 |
87.685,00 |
|
|
IV. Short-term debts with Group companies
and associates: 32400 |
2.034,00 |
0,00 |
0,00 |
0,00 |
0,00 |
|
|
V. Trade creditors and other accounts
payable: 32500 |
15.585.039,00 |
22.316.351,00 |
16.590.983,00 |
19.930.973,00 |
20.293.658,00 |
|
|
1. Suppliers:
32510 |
4.857.889,00 |
6.569.089,00 |
5.207.002,00 |
5.971.639,00 |
5.744.889,00 |
|
|
a) Long-term debts : 32511 |
0,00 |
0,00 |
0,00 |
0,00 |
0,00 |
|
|
b) Short-term debts : 32512 |
0,00 |
6.569.089,00 |
5.207.002,00 |
5.971.639,00 |
5.744.889,00 |
|
|
2. Suppliers, Group
companies and associates: 32520 |
350.583,00 |
590.401,00 |
432.873,00 |
595.889,00 |
85.126,00 |
|
|
3. Other creditors:
32530 |
5.286.534,00 |
6.210.730,00 |
4.834.455,00 |
5.391.061,00 |
6.130.863,00 |
|
|
4. Personnel
(remuneration due): 32540 |
3.672.634,00 |
3.398.130,00 |
3.728.082,00 |
3.807.856,00 |
3.862.472,00 |
|
|
5. Liabilities for
current tax: 32550 |
0,00 |
0,00 |
0,00 |
621.125,00 |
891.684,00 |
|
|
6. Otras deudas con
las Administraciones Públicas. : 32560 |
1.417.399,00 |
5.548.001,00 |
2.388.571,00 |
3.543.403,00 |
3.578.624,00 |
|
|
7. Advances from
clients: 32570 |
0,00 |
0,00 |
0,00 |
0,00 |
0,00 |
|
|
VI. Short-term accruals: 32600 |
0,00 |
0,00 |
0,00 |
0,00 |
0,00 |
|
|
VII. Special short-term debts : 32700 |
0,00 |
637.673,00 |
0,00 |
0,00 |
702.535,00 |
|
|
TOTAL NET WORTH AND LIABILITIES (A + B + C) : 30000 |
146.853.005,00 |
177.246.758,00 |
172.199.148,00 |
178.217.777,00 |
181.433.678,00 |
|
|
|
ORIGINAL |
ORIGINAL |
ORIGINAL |
ORIGINAL |
ORIGINAL |
|
|
Profit and Loss |
2013 |
2012 |
2011 |
2010 |
2009 |
|
|
1. Net turnover: 40100 |
127.617.480,00 |
134.376.173,00 |
143.217.036,00 |
151.625.308,00 |
166.092.275,00 |
|
|
a) Sales: 40110 |
127.599.818,00 |
134.367.947,00 |
143.216.200,00 |
151.623.475,00 |
166.085.864,00 |
|
|
b) Rendering of services: 40120 |
17.662,00 |
8.226,00 |
836,00 |
1.833,00 |
6.411,00 |
|
|
2. Changes in stocks of finished goods and work in progress:
40200 |
0,00 |
0,00 |
0,00 |
0,00 |
0,00 |
|
|
3. Works carried out by the company for its assets: 40300 |
0,00 |
0,00 |
0,00 |
0,00 |
0,00 |
|
|
4. Supplies : 40400 |
-64.286.215,00 |
-55.209.219,00 |
-54.071.588,00 |
-52.423.727,00 |
-56.665.044,00 |
|
|
a) Stock consumption: 40410 |
-59.431.441,00 |
-56.849.261,00 |
-45.228.156,00 |
-48.688.980,00 |
0,00 |
|
|
b) Consumption of raw materials and
miscellaneous consumable ones: 40420 |
-3.546.150,00 |
-6.181.082,00 |
-8.674.534,00 |
-3.734.747,00 |
0,00 |
|
|
c) Works carried out by other companies:
40430 |
-1.308.624,00 |
-2.568.990,00 |
-168.898,00 |
0,00 |
0,00 |
|
|
d) Impairment of stock, primary material
and other supplies: 40440 |
0,00 |
10.390.114,00 |
0,00 |
0,00 |
-56.665.044,00 |
|
|
5. Other operating income: 40500 |
3.366.521,00 |
2.962.812,00 |
3.228.665,00 |
4.173.997,00 |
3.278.742,00 |
|
|
a) Auxiliary income and other from current
management: 40510 |
3.189.986,00 |
2.804.522,00 |
3.132.235,00 |
4.038.631,00 |
2.888.259,00 |
|
|
b) Operation subsidies included in the
Period's result: 40520 |
176.535,00 |
158.290,00 |
96.430,00 |
135.366,00 |
390.483,00 |
|
|
6. Personnel costs: 40600 |
-42.259.194,00 |
-46.405.619,00 |
-47.317.676,00 |
-46.213.836,00 |
-44.760.047,00 |
|
|
a) Wages, salaries et al.: 40610 |
-33.155.659,00 |
-36.155.176,00 |
-36.722.588,00 |
-36.017.728,00 |
-34.770.148,00 |
|
|
b) Social security costs: 40620 |
-9.103.535,00 |
-10.250.443,00 |
-10.595.088,00 |
-10.196.108,00 |
-9.989.899,00 |
|
|
c) Provisions : 40630 |
0,00 |
0,00 |
0,00 |
0,00 |
0,00 |
|
|
7. Other operating costs: 40700 |
-32.249.431,00 |
-35.328.602,00 |
-36.510.830,00 |
-39.972.759,00 |
-45.655.063,00 |
|
|
a) External services: 40710 |
-28.979.419,00 |
-33.580.124,00 |
-35.437.032,00 |
-38.193.883,00 |
-43.576.855,00 |
|
|
b) Taxes: 40720 |
-694.100,00 |
-625.438,00 |
-685.220,00 |
-529.164,00 |
-488.004,00 |
|
|
c) Losses, impairments and variation in provisions
from trade operations : 40730 |
-2.390.367,00 |
-1.104.991,00 |
-388.578,00 |
-1.237.606,00 |
-1.462.368,00 |
|
|
d) Other current management expenditure :
40740 |
-185.545,00 |
-18.049,00 |
0,00 |
-12.106,00 |
-127.836,00 |
|
|
8. Amortisation of fixed assets: 40800 |
-11.720.752,00 |
-13.234.087,00 |
-13.098.779,00 |
-12.777.747,00 |
-11.534.664,00 |
|
|
9. Allocation of subsidies of non-financial fixed assets and
other: 40900 |
189.319,00 |
222.029,00 |
275.260,00 |
279.403,00 |
245.802,00 |
|
|
10. Excess provisions : 41000 |
0,00 |
0,00 |
0,00 |
0,00 |
0,00 |
|
|
11. Impairment and result of transfers of fixed assets:
41100 |
-10.576.733,00 |
2.796.335,00 |
-607.382,00 |
-2.276.656,00 |
-536.498,00 |
|
|
a) Impairment and losses : 41110 |
-9.655.977,00 |
-1.925.506,00 |
-6.356,00 |
-459.983,00 |
-271.553,00 |
|
|
b) Results for transfers and other :
41120 |
-920.756,00 |
4.721.841,00 |
-601.026,00 |
-1.816.673,00 |
-264.945,00 |
|
|
12. Negative difference in combined businesses: 41200 |
0,00 |
0,00 |
0,00 |
0,00 |
0,00 |
|
|
13. Other results : 41300 |
0,00 |
0,00 |
0,00 |
0,00 |
0,00 |
|
|
A.1) OPERATING INCOME (1 + 2 + 3 + 4 + 5 + 6 + 7 + 8 + 9 + 10 +
11 + 12 + 13) : 49100 |
-29.919.005,00 |
-9.820.178,00 |
-4.885.294,00 |
2.413.983,00 |
10.465.503,00 |
|
|
14. Financial income : 41400 |
541.249,00 |
306.975,00 |
420.662,00 |
300.932,00 |
286.888,00 |
|
|
a) Of shares in equity instruments :
41410 |
0,00 |
0,00 |
0,00 |
0,00 |
286.888,00 |
|
|
a 1) In Group
companies and associates: 41411 |
0,00 |
0,00 |
0,00 |
0,00 |
183.469,00 |
|
|
a 2) In third parties:
41412 |
0,00 |
0,00 |
0,00 |
0,00 |
103.419,00 |
|
|
b) From negotiable securities and other
financial instruments : 41420 |
541.249,00 |
306.975,00 |
420.662,00 |
300.932,00 |
0,00 |
|
|
b 1) From Group
companies and associates : 41421 |
285.597,00 |
33.600,00 |
9.859,00 |
123.552,00 |
0,00 |
|
|
b 2) From third
parties : 41422 |
255.652,00 |
273.375,00 |
410.803,00 |
177.380,00 |
0,00 |
|
|
c) Allocation of financial subsidies,
donations and legacies : 41430 |
0,00 |
0,00 |
0,00 |
0,00 |
0,00 |
|
|
15. Financial expenditure: 41500 |
-1.996.663,00 |
-1.022.928,00 |
-855.837,00 |
-1.102.231,00 |
-1.255.198,00 |
|
|
a) Amounts owed to Group companies and
associates : 41510 |
-2.034,00 |
0,00 |
0,00 |
0,00 |
0,00 |
|
|
b) For debts with third parties :
41520 |
-1.994.629,00 |
-1.022.928,00 |
-855.837,00 |
-1.102.231,00 |
-1.255.198,00 |
|
|
c) Stock renewal : 41530 |
0,00 |
0,00 |
0,00 |
0,00 |
0,00 |
|
|
16. Changes in fair value of financial instruments : 41600 |
0,00 |
0,00 |
0,00 |
0,00 |
0,00 |
|
|
a) Trading book and other : 41610 |
0,00 |
0,00 |
0,00 |
0,00 |
0,00 |
|
|
b) Allocation of financial assets held for
sale to the result for the period: 41620 |
0,00 |
0,00 |
0,00 |
0,00 |
0,00 |
|
|
17. Exchange rate differences : 41700 |
-23.896,00 |
-769.446,00 |
-897.137,00 |
-224.999,00 |
-311.639,00 |
|
|
18. Impairment and result for transfers of financial
instruments: 41800 |
-1.927.073,00 |
-524.298,00 |
-765.137,00 |
-1.379.937,00 |
-3.015.051,00 |
|
|
a) Impairment and losses : 41810 |
-1.927.073,00 |
-524.298,00 |
-765.137,00 |
-1.379.937,00 |
-3.015.051,00 |
|
|
b) Results for transfers and other :
41820 |
0,00 |
0,00 |
0,00 |
0,00 |
0,00 |
|
|
19. Other financial income and expenditure: 42100 |
0,00 |
0,00 |
0,00 |
0,00 |
0,00 |
|
|
a) Incorporation of financial expenditure
to assets: 42110 |
0,00 |
0,00 |
0,00 |
0,00 |
0,00 |
|
|
b) Financial income from arrangement with
creditors: 42120 |
0,00 |
0,00 |
0,00 |
0,00 |
0,00 |
|
|
c) Other income and expenditure:
42130 |
0,00 |
0,00 |
0,00 |
0,00 |
0,00 |
|
|
A.2) FINANCIAL REVENUE (14+15+16+17+18+19) : 49200 |
-3.406.383,00 |
-2.009.697,00 |
-2.097.449,00 |
-2.406.235,00 |
-4.295.000,00 |
|
|
A.3) NET RESULT BEFORE TAXES (A.1+A.2) : 49300 |
-33.325.388,00 |
-11.829.875,00 |
-6.982.743,00 |
7.748,00 |
6.170.503,00 |
|
|
20. Income taxes: 41900 |
10.267.128,00 |
3.419.028,00 |
2.528.364,00 |
-26.941,00 |
-1.212.465,00 |
|
|
A.4) PROFIT AFTER TAXES (A.3+20) : 49400 |
-23.058.260,00 |
-8.410.847,00 |
-4.454.379,00 |
-19.193,00 |
4.958.038,00 |
|
|
21. Result of the year coming from interrupted operations :
42000 |
0,00 |
0,00 |
0,00 |
0,00 |
0,00 |
|
|
A.5) RESULT OF THE PERIOD (A.4+21) : 49500 |
-23.058.260,00 |
-8.410.847,00 |
-4.454.379,00 |
-19.193,00 |
4.958.038,00 |
|
> Normal Balance Sheet under the rules of the 1990 General
Accounting Plan (repealed since 1st January of 2008)
Information corresponding
to the fiscal year 2013 2012 2011 2010 2009 has been
compiled based on the equivalence criteria stipulated in Act JUS/206/2009.
Where the provisions of the Act did not establish relevant equivalence
criteria, Axesor created such criteria using its own methodology. To view
details on the methodology 2013 2012 2011 2010 2009
is taken from information submitted to the TRADE REGISTER.
|
|
EQUIVALENCIA |
EQUIVALENCIA |
EQUIVALENCIA |
EQUIVALENCIA |
EQUIVALENCIA |
|
|
ASSETS |
2013 |
2012 |
2011 |
2010 |
2009 |
|
|
A) SHAREHOLDERS (PARTNERS) BY UNCALLED SUSCRIBED CAPITAL: |
0,00 |
0,00 |
0,00 |
0,00 |
0,00 |
|
|
B) FIXED ASSETS: |
65.089.253,00 |
85.861.435,00 |
102.396.168,00 |
108.019.480,00 |
116.997.636,00 |
|
|
I. Formation expenses: |
0,00 |
0,00 |
0,00 |
0,00 |
0,00 |
|
|
II. Intangible fixed assets: |
759.120,00 |
1.999.750,00 |
2.302.142,00 |
1.686.020,00 |
1.284.165,00 |
|
|
1. Research and
development costs: |
0,00 |
0,00 |
0,00 |
0,00 |
0,00 |
|
|
2. Concessions,
patents, licences, trademarks et al.: |
459.916,00 |
25.302,00 |
506.911,00 |
369.730,00 |
314.984,00 |
|
|
3. Goodwill: |
0,00 |
0,00 |
0,00 |
0,00 |
0,00 |
|
|
4. Key money paid for
premises: |
0,00 |
545.016,00 |
19.999,00 |
567.243,00 |
584.407,00 |
|
|
5. Software: |
299.204,00 |
1.429.432,00 |
1.775.232,00 |
749.047,00 |
384.774,00 |
|
|
6. Assets under
capital leases: |
0,00 |
0,00 |
0,00 |
0,00 |
0,00 |
|
|
7. Payments on
account: |
0,00 |
0,00 |
0,00 |
0,00 |
0,00 |
|
|
8. Provisions: |
0,00 |
0,00 |
0,00 |
0,00 |
0,00 |
|
|
9. Accumulated
depreciation: |
0,00 |
0,00 |
0,00 |
0,00 |
0,00 |
|
|
III. Tangible fixed assets: |
36.221.413,00 |
57.312.963,00 |
75.516.315,00 |
80.276.304,00 |
86.950.972,00 |
|
|
1. Land and
construction: |
13.484.021,00 |
14.038.715,00 |
21.129.073,00 |
21.399.406,00 |
22.087.212,00 |
|
|
2. Technical
installations and machinery: |
19.195.011,00 |
36.532.320,00 |
45.826.024,00 |
48.163.817,00 |
53.622.975,00 |
|
|
3. Other
installations, tools and furniture: |
2.838.122,00 |
5.401.569,00 |
6.775.710,00 |
7.121.370,00 |
7.928.546,00 |
|
|
4. Payments on account
and tangible fixed assets under construction: |
0,00 |
0,00 |
104.166,00 |
1.824.596,00 |
1.344.829,00 |
|
|
5. Other tangible
assets: |
704.259,00 |
1.340.359,00 |
1.681.342,00 |
1.767.115,00 |
1.967.410,00 |
|
|
6. Provisions: |
0,00 |
0,00 |
0,00 |
0,00 |
0,00 |
|
|
7. Accumulated
depreciation: |
0,00 |
0,00 |
0,00 |
0,00 |
0,00 |
|
|
IV. Financial investments: |
27.280.337,00 |
26.548.722,00 |
24.137.979,00 |
25.561.748,00 |
28.317.065,00 |
|
|
1. Equity investments in
group companies: |
12.747.611,00 |
0,00 |
17.108.104,00 |
19.788.557,00 |
18.210.538,00 |
|
|
2. Receivables from
group companies: |
9.574.120,00 |
0,00 |
4.414.502,00 |
3.025.228,00 |
6.952.260,00 |
|
|
3. Equity investment
in associated companies: |
0,00 |
0,00 |
0,00 |
0,00 |
0,00 |
|
|
4. Credits to
associated companies: |
0,00 |
0,00 |
0,00 |
0,00 |
0,00 |
|
|
5. Long-term
securities portfolio: |
0,00 |
2.396.639,00 |
0,00 |
0,00 |
0,00 |
|
|
6. Other receivables:
|
502.633,00 |
8.288.929,00 |
2.615.373,00 |
2.747.963,00 |
3.154.267,00 |
|
|
7. Long term
guarantees and deposits: |
4.455.973,00 |
15.863.154,00 |
0,00 |
0,00 |
0,00 |
|
|
8. Provisions: |
0,00 |
0,00 |
0,00 |
0,00 |
0,00 |
|
|
9. Long-term
receivables from public bodies: |
0,00 |
0,00 |
0,00 |
0,00 |
0,00 |
|
|
V. Own shares: |
500.003,00 |
0,00 |
0,00 |
0,00 |
0,00 |
|
|
VI. Long-term trade receivables: |
328.380,00 |
0,00 |
439.732,00 |
495.408,00 |
445.434,00 |
|
|
C) Deferred expenses: |
0,00 |
0,00 |
0,00 |
0,00 |
0,00 |
|
|
D) CURRENT ASSETS: |
82.263.755,00 |
91.385.323,00 |
69.802.980,00 |
69.841.360,00 |
64.436.042,00 |
|
|
I. Called-up share capital (not paid):
|
0,00 |
0,00 |
0,00 |
0,00 |
0,00 |
|
|
II. Stocks: |
34.654.809,00 |
45.776.085,00 |
35.385.971,00 |
37.748.324,00 |
35.204.334,00 |
|
|
1. Goods for resale:
|
34.251.010,00 |
44.881.477,00 |
0,00 |
0,00 |
31.918.957,00 |
|
|
2. Raw materials and
other consumables: |
403.799,00 |
894.608,00 |
1.173.790,00 |
912.282,00 |
614.241,00 |
|
|
3. Goods in process
and semifinished ones: |
0,00 |
0,00 |
0,00 |
3.006.408,00 |
2.671.136,00 |
|
|
4. Finished products:
|
0,00 |
0,00 |
34.212.181,00 |
33.625.573,00 |
0,00 |
|
|
5. Byproducts, scrap
and recovered materials: |
0,00 |
0,00 |
0,00 |
0,00 |
0,00 |
|
|
6. Payments on
account: |
0,00 |
0,00 |
0,00 |
204.061,00 |
0,00 |
|
|
7. Provisions: |
0,00 |
0,00 |
0,00 |
0,00 |
0,00 |
|
|
III. Debtors: |
31.251.598,00 |
37.493.764,00 |
19.085.928,00 |
20.127.020,00 |
19.688.441,00 |
|
|
1. Trade debtors /
accounts receivable: |
12.827.721,00 |
14.553.673,00 |
14.357.788,00 |
18.020.519,00 |
18.488.846,00 |
|
|
2. Accounts
receivable, Group companies: |
0,00 |
0,00 |
0,00 |
0,00 |
0,00 |
|
|
3. Accounts
receivable, associated companies: |
0,00 |
0,00 |
0,00 |
0,00 |
0,00 |
|
|
4. Other debtors:
|
229.267,00 |
15.034.752,00 |
265.715,00 |
350.784,00 |
377.699,00 |
|
|
5. Staff: |
0,00 |
0,00 |
0,00 |
0,00 |
0,00 |
|
|
6. Public bodies:
|
18.194.610,00 |
7.905.339,00 |
4.462.425,00 |
1.755.717,00 |
821.896,00 |
|
|
7. Provisions: |
0,00 |
0,00 |
0,00 |
0,00 |
0,00 |
|
|
IV. Short-term investments: |
12.252.892,00 |
2.731.905,00 |
13.621.256,00 |
8.488.087,00 |
6.484.423,00 |
|
|
1. Equity investments in
group companies: |
0,00 |
0,00 |
0,00 |
0,00 |
0,00 |
|
|
2. Receivables from
group companies: |
0,00 |
0,00 |
0,00 |
0,00 |
0,00 |
|
|
3. Equity investment
in associated companies: |
0,00 |
0,00 |
0,00 |
0,00 |
0,00 |
|
|
4. Credits to
associated companies: |
0,00 |
0,00 |
0,00 |
0,00 |
0,00 |
|
|
5. Short term
securities portfolio: |
12.078.712,00 |
0,00 |
8.300.000,00 |
8.488.087,00 |
1.528.732,00 |
|
|
6. Other receivables:
|
142.823,00 |
0,00 |
5.321.256,00 |
0,00 |
4.955.691,00 |
|
|
7. Shor term
guarantees and deposits: |
31.357,00 |
2.731.905,00 |
0,00 |
0,00 |
0,00 |
|
|
8. Provisions: |
0,00 |
0,00 |
0,00 |
0,00 |
0,00 |
|
|
V. Short-term treasury shares: |
0,00 |
0,00 |
0,00 |
0,00 |
0,00 |
|
|
VI. Cash at bank and in hand: |
3.646.585,00 |
5.101.144,00 |
1.358.546,00 |
3.477.929,00 |
2.699.512,00 |
|
|
VII. Prepayments and accrued income: |
457.871,00 |
282.425,00 |
351.279,00 |
0,00 |
359.332,00 |
|
|
GENERAL TOTAL (A + B + C + D): |
147.353.008,00 |
177.246.758,00 |
172.199.148,00 |
177.860.840,00 |
181.433.678,00 |
|
MERCANTILE REGISTRY.
|
|
EQUIVALENCIA |
EQUIVALENCIA |
EQUIVALENCIA |
EQUIVALENCIA |
EQUIVALENCIA |
|
|
LIABILITIES |
2013 |
2012 |
2011 |
2010 |
2009 |
|
|
A) EQUITY: |
96.687.801,00 |
119.293.697,00 |
127.751.170,00 |
132.903.629,00 |
134.299.961,00 |
|
|
I. Subscribed capital: |
5.565.665,00 |
5.488.061,00 |
5.488.061,00 |
5.488.061,00 |
5.488.061,00 |
|
|
II. Share premium: |
422.399,00 |
0,00 |
0,00 |
0,00 |
0,00 |
|
|
III. Revaluation reserves: |
0,00 |
0,00 |
0,00 |
0,00 |
0,00 |
|
|
IV. Reserves: |
126.642.416,00 |
126.690.055,00 |
126.736.681,00 |
127.434.761,00 |
123.853.862,00 |
|
|
1. Legal reserve:
|
1.097.612,00 |
1.097.612,00 |
1.097.612,00 |
1.097.612,00 |
1.097.612,00 |
|
|
2. Reserves for own
shares: |
0,00 |
0,00 |
0,00 |
0,00 |
0,00 |
|
|
3. Reserves for shares
of the controlling company: |
0,00 |
0,00 |
0,00 |
0,00 |
0,00 |
|
|
4. Statutory reserves:
|
0,00 |
0,00 |
0,00 |
0,00 |
0,00 |
|
|
5. Miscellaneous
reserves: |
125.544.804,00 |
125.592.443,00 |
125.639.069,00 |
126.337.149,00 |
122.756.250,00 |
|
|
Differences due to capital
adjustement to euros: |
0,00 |
0,00 |
0,00 |
0,00 |
0,00 |
|
|
V. Profit or loss brought forward: |
-12.884.419,00 |
-4.473.572,00 |
-19.193,00 |
0,00 |
0,00 |
|
|
1. Retained earnings:
|
0,00 |
0,00 |
0,00 |
0,00 |
0,00 |
|
|
2. Prior year losses:
|
-12.884.419,00 |
-4.473.572,00 |
-19.193,00 |
0,00 |
0,00 |
|
|
3. Partners'
contributions so as to compensate losses: |
0,00 |
0,00 |
0,00 |
0,00 |
0,00 |
|
|
VI. Profit or loss for the financial year:
|
-23.058.260,00 |
-8.410.847,00 |
-4.454.379,00 |
-19.193,00 |
4.958.038,00 |
|
|
VII. Interim dividend paid: |
0,00 |
0,00 |
0,00 |
0,00 |
0,00 |
|
|
VIII. Own shares for capital reduction:
|
0,00 |
0,00 |
0,00 |
0,00 |
0,00 |
|
|
B) Deferred income: |
221.831,00 |
252.569,00 |
361.363,00 |
496.241,00 |
508.198,00 |
|
|
1. Capital grants:
|
221.831,00 |
252.569,00 |
361.363,00 |
496.241,00 |
508.198,00 |
|
|
2. Unrealised exchange
gains: |
0,00 |
0,00 |
0,00 |
0,00 |
0,00 |
|
|
3. Other deferred
income: |
0,00 |
0,00 |
0,00 |
0,00 |
0,00 |
|
|
4. Public revenues to
distribute in several financial years: |
0,00 |
0,00 |
0,00 |
0,00 |
0,00 |
|
|
C) PROVISIONS FOR LIABILITIES AND CHARGES: |
0,00 |
0,00 |
0,00 |
0,00 |
0,00 |
|
|
1. Provisions for pension
fund and other similar obligations: |
0,00 |
0,00 |
0,00 |
0,00 |
0,00 |
|
|
2. Provisions for
taxes: |
0,00 |
0,00 |
0,00 |
0,00 |
0,00 |
|
|
3. Other provisions:
|
0,00 |
0,00 |
0,00 |
0,00 |
0,00 |
|
|
4. Reversion fund:
|
0,00 |
0,00 |
0,00 |
0,00 |
0,00 |
|
|
D) LONG TERM LIABILITIES: |
30.524.867,00 |
18.560.115,00 |
19.786.412,00 |
22.188.717,00 |
23.848.539,00 |
|
|
I. Issued debentures and other marketable securities:
|
0,00 |
0,00 |
0,00 |
0,00 |
0,00 |
|
|
1. Non-convertible
debentures: |
0,00 |
0,00 |
0,00 |
0,00 |
0,00 |
|
|
2. Convertible
debentures: |
0,00 |
0,00 |
0,00 |
0,00 |
0,00 |
|
|
3. Other debt
securities: |
0,00 |
0,00 |
0,00 |
0,00 |
0,00 |
|
|
II. Amounts owed to credit institutions:
|
24.905.119,00 |
15.573.313,00 |
18.057.654,00 |
20.502.049,00 |
22.017.645,00 |
|
|
1. Loans and other liabilities:
|
24.905.119,00 |
15.573.313,00 |
18.057.654,00 |
20.502.049,00 |
22.017.645,00 |
|
|
2. Long-term
liabilities from capital leases: |
0,00 |
0,00 |
0,00 |
0,00 |
0,00 |
|
|
III. Debts with companies of the group and
affiliated ones: |
662.984,00 |
0,00 |
0,00 |
0,00 |
0,00 |
|
|
1. Amounts owed to
group companies: |
662.984,00 |
0,00 |
0,00 |
0,00 |
0,00 |
|
|
2. Amounts owed to associated
companies: |
0,00 |
0,00 |
0,00 |
0,00 |
0,00 |
|
|
IV. Other creditors: |
4.956.764,00 |
2.986.802,00 |
1.728.758,00 |
1.686.668,00 |
1.830.894,00 |
|
|
1. Long-term bills of
exchange payable: |
0,00 |
0,00 |
0,00 |
0,00 |
0,00 |
|
|
2. Other creditors:
|
4.724.066,00 |
2.679.278,00 |
1.389.434,00 |
1.262.826,00 |
1.397.792,00 |
|
|
3. Long term
guarantees and deposits received: |
0,00 |
0,00 |
0,00 |
0,00 |
0,00 |
|
|
4. Long term payables
to public bodies: |
232.698,00 |
307.524,00 |
339.324,00 |
423.842,00 |
433.102,00 |
|
|
V. Unpaid portion of equity investment:
|
0,00 |
0,00 |
0,00 |
0,00 |
0,00 |
|
|
1. Group companies:
|
0,00 |
0,00 |
0,00 |
0,00 |
0,00 |
|
|
2. Associated
companies: |
0,00 |
0,00 |
0,00 |
0,00 |
0,00 |
|
|
3. Third parties:
|
0,00 |
0,00 |
0,00 |
0,00 |
0,00 |
|
|
VI. Long term trade creditors: |
0,00 |
0,00 |
0,00 |
0,00 |
0,00 |
|
|
E) SHORT TERM CREDITORS: |
19.768.509,00 |
39.140.377,00 |
24.300.203,00 |
22.629.191,00 |
22.776.980,00 |
|
|
I. Issued debentures and other marketable securities:
|
0,00 |
0,00 |
0,00 |
0,00 |
0,00 |
|
|
1. Non-convertible
debentures: |
0,00 |
0,00 |
0,00 |
0,00 |
0,00 |
|
|
2. Convertible
debentures: |
0,00 |
0,00 |
0,00 |
0,00 |
0,00 |
|
|
3. Other debt
securities: |
0,00 |
0,00 |
0,00 |
0,00 |
0,00 |
|
|
4. Accrued interest on
debentures and other debt securities: |
0,00 |
0,00 |
0,00 |
0,00 |
0,00 |
|
|
II. Amounts owed to credit institutions:
|
2.576.579,00 |
15.703.018,00 |
7.386.895,00 |
2.563.252,00 |
1.693.102,00 |
|
|
1. Loans and other
liabilities: |
2.576.579,00 |
15.703.018,00 |
7.386.895,00 |
2.563.252,00 |
1.693.102,00 |
|
|
2. Accrued interest on
liabilities with credit institutions: |
0,00 |
0,00 |
0,00 |
0,00 |
0,00 |
|
|
3. Short-term
liabilities from capital leases: |
0,00 |
0,00 |
0,00 |
0,00 |
0,00 |
|
|
III. Short-term amounts owed to group and associated
companies: |
352.617,00 |
590.401,00 |
432.873,00 |
595.889,00 |
85.126,00 |
|
|
1. Amounts owed to
group companies: |
352.617,00 |
590.401,00 |
432.873,00 |
595.889,00 |
85.126,00 |
|
|
2. Amounts owed to
associated companies: |
0,00 |
0,00 |
0,00 |
0,00 |
0,00 |
|
|
IV. Trade creditors: |
10.144.423,00 |
12.779.819,00 |
10.041.457,00 |
11.362.700,00 |
11.875.752,00 |
|
|
1. Advanced payments
from customers: |
0,00 |
0,00 |
0,00 |
0,00 |
0,00 |
|
|
2. Amounts owed for
purchases of goods or services: |
10.144.423,00 |
12.779.819,00 |
10.041.457,00 |
11.362.700,00 |
11.875.752,00 |
|
|
3. Debts represented
by notes payable: |
0,00 |
0,00 |
0,00 |
0,00 |
0,00 |
|
|
V. Other creditors: |
6.694.890,00 |
10.067.139,00 |
6.438.978,00 |
8.107.350,00 |
9.123.000,00 |
|
|
1. Public bodies:
|
1.417.399,00 |
5.548.001,00 |
2.388.571,00 |
4.164.528,00 |
4.470.308,00 |
|
|
2. Bills of exchange
payable: |
0,00 |
0,00 |
0,00 |
0,00 |
0,00 |
|
|
3. Miscellaneous
debts: |
1.604.857,00 |
1.121.008,00 |
322.325,00 |
134.966,00 |
790.220,00 |
|
|
4. Wages and salaries
payable: |
3.672.634,00 |
3.398.130,00 |
3.728.082,00 |
3.807.856,00 |
3.862.472,00 |
|
|
5. Guarantees and
deposits received at short term: |
0,00 |
0,00 |
0,00 |
0,00 |
0,00 |
|
|
VI. Provisions: |
0,00 |
0,00 |
0,00 |
0,00 |
0,00 |
|
|
VII. Prepayments and accrued income: |
0,00 |
0,00 |
0,00 |
0,00 |
0,00 |
|
|
F) SHORT-TERM PROVISIONS FOR LIABILITIES AND CHARGES: |
150.000,00 |
0,00 |
0,00 |
0,00 |
0,00 |
|
|
GENERAL TOTAL (A + B + C + D + E + F): |
147.353.008,00 |
177.246.758,00 |
172.199.148,00 |
178.217.777,00 |
181.433.678,00 |
|
MERCANTILE REGISTRY.
|
|
EQUIVALENCIA |
EQUIVALENCIA |
EQUIVALENCIA |
EQUIVALENCIA |
EQUIVALENCIA |
|
|
DEBIT |
2013 |
2012 |
2011 |
2010 |
2009 |
|
|
A) CHARGES (A.1 to A.15): |
154.772.829,00 |
151.000.677,00 |
151.596.002,00 |
156.398.833,00 |
164.945.669,00 |
|
|
A.1. Stock reduction
of both manufactured goods and the ones in process: |
0,00 |
0,00 |
0,00 |
0,00 |
0,00 |
|
|
A.2. Supplies: |
64.286.215,00 |
65.599.333,00 |
54.071.588,00 |
52.423.727,00 |
0,00 |
|
|
a) Stock consumption: |
59.431.441,00 |
56.849.261,00 |
45.228.156,00 |
48.688.980,00 |
0,00 |
|
|
b) Consumption of raw materials and miscellaneous consumable ones: |
3.546.150,00 |
6.181.082,00 |
8.674.534,00 |
3.734.747,00 |
0,00 |
|
|
c) Miscellaneous external expenditure: |
1.308.624,00 |
2.568.990,00 |
168.898,00 |
0,00 |
0,00 |
|
|
A.3. Staff costs:
|
42.259.194,00 |
46.405.619,00 |
47.317.676,00 |
46.213.836,00 |
44.760.047,00 |
|
|
a) Wages, salaries et al.: |
33.155.659,00 |
36.155.176,00 |
36.722.588,00 |
36.017.728,00 |
34.770.148,00 |
|
|
b) Social security costs: |
9.103.535,00 |
10.250.443,00 |
10.595.088,00 |
10.196.108,00 |
9.989.899,00 |
|
|
A.4. Depreciation expense:
|
11.720.752,00 |
13.234.087,00 |
13.098.779,00 |
12.777.747,00 |
11.534.664,00 |
|
|
A.5. Variation of
trade provisions and losses of unrecovered receivables: |
2.390.367,00 |
-9.285.123,00 |
388.578,00 |
1.237.606,00 |
58.127.412,00 |
|
|
a) Stock provision variation: |
0,00 |
-10.390.114,00 |
0,00 |
0,00 |
56.665.044,00 |
|
|
b) Variation in provision and bad debt losses: |
2.390.367,00 |
1.104.991,00 |
388.578,00 |
1.237.606,00 |
1.462.368,00 |
|
|
c) Variation of other trade provisions: |
0,00 |
0,00 |
0,00 |
0,00 |
0,00 |
|
|
A.6. Other operating
charges: |
29.859.064,00 |
34.223.611,00 |
36.122.252,00 |
38.735.153,00 |
44.192.695,00 |
|
|
a) External services: |
28.979.419,00 |
33.580.124,00 |
35.437.032,00 |
38.193.883,00 |
43.576.855,00 |
|
|
b) Taxes: |
694.100,00 |
625.438,00 |
685.220,00 |
529.164,00 |
488.004,00 |
|
|
c) Other operating expenses: |
185.545,00 |
18.049,00 |
0,00 |
12.106,00 |
127.836,00 |
|
|
d) Allocation to revision fund: |
0,00 |
0,00 |
0,00 |
0,00 |
0,00 |
|
|
A.I. OPERATING BENEFITS
(B.1+B.2+B.3+B.4-A.1-A.2-A.3-A.4-A.5-A.6): |
0,00 |
0,00 |
0,00 |
4.411.236,00 |
10.756.199,00 |
|
|
A.7. Financial and
similar charges: |
1.996.663,00 |
1.022.928,00 |
855.837,00 |
1.102.231,00 |
1.255.198,00 |
|
|
a) Due to liabilities with companies of the group: |
2.034,00 |
0,00 |
0,00 |
0,00 |
0,00 |
|
|
b) Due to liabilities with associated companies: |
0,00 |
0,00 |
0,00 |
0,00 |
0,00 |
|
|
c) Due to other debts.: |
1.994.629,00 |
1.022.928,00 |
855.837,00 |
1.102.231,00 |
1.255.198,00 |
|
|
d) Losses from financial investments: |
0,00 |
0,00 |
0,00 |
0,00 |
0,00 |
|
|
A.8. Changes in financial
investment provisions: |
281.423,00 |
357.761,00 |
526.437,00 |
1.265.921,00 |
3.015.051,00 |
|
|
A.9. Exchange losses:
|
23.896,00 |
769.446,00 |
897.137,00 |
224.999,00 |
311.639,00 |
|
|
A.II. NET FINANCIAL INCOME
(B.5+B.6+B.7+B.8-A.7-A.8-A.9): |
0,00 |
0,00 |
0,00 |
0,00 |
0,00 |
|
|
A.III. PROFIT FROM ORDINARY ACTIVITIES
(A.I+A.II-B.I-B.II): |
0,00 |
0,00 |
0,00 |
2.119.017,00 |
6.461.199,00 |
|
|
A.10. Changes in
provisions for intangible, tangible and securities portfolio: |
11.301.627,00 |
2.092.043,00 |
245.056,00 |
573.999,00 |
271.553,00 |
|
|
A.11. Losses from
tangible and intangible fixed assets and securities portfolio: |
920.756,00 |
0,00 |
601.026,00 |
1.816.673,00 |
264.945,00 |
|
|
A.12. Losses from
transactions with own shares and debentures: |
0,00 |
0,00 |
0,00 |
0,00 |
0,00 |
|
|
A.13. Extraordinary
expenses: |
0,00 |
0,00 |
0,00 |
0,00 |
0,00 |
|
|
A.14. Expenses and
losses of former financial years: |
0,00 |
0,00 |
0,00 |
0,00 |
0,00 |
|
|
A.IV. EXTRAORDINARY PROFIT
(B.9+B.10+B.11+B.12+B.13-A.10-A.11-A.12-A.13-A.14): |
0,00 |
2.851.827,00 |
0,00 |
0,00 |
0,00 |
|
|
A.V. PROFIT BEFORE TAXES
(A.III+A.IV-B.III-B.IV): |
0,00 |
0,00 |
0,00 |
7.748,00 |
6.170.503,00 |
|
|
A.15. Corporation tax:
|
-10.267.128,00 |
-3.419.028,00 |
-2.528.364,00 |
26.941,00 |
1.212.465,00 |
|
|
A.16. Miscellaneous
taxes: |
0,00 |
0,00 |
0,00 |
0,00 |
0,00 |
|
|
A.VI. FINANCIAL YEAR RESULTS (PROFIT)
(A.V-A.15-A.16): |
0,00 |
0,00 |
0,00 |
0,00 |
4.958.038,00 |
|
MERCANTILE REGISTRY.
|
|
EQUIVALENCIA |
EQUIVALENCIA |
EQUIVALENCIA |
EQUIVALENCIA |
EQUIVALENCIA |
|
|
CREDIT |
2013 |
2012 |
2011 |
2010 |
2009 |
|
|
B) INCOME ( B.1 to B.13): |
131.714.569,00 |
142.589.830,00 |
147.141.623,00 |
156.379.640,00 |
169.903.707,00 |
|
|
B.1. Net total sales:
|
127.617.480,00 |
134.376.173,00 |
143.217.036,00 |
151.625.308,00 |
166.092.275,00 |
|
|
a) Sales: |
127.599.818,00 |
134.367.947,00 |
143.216.200,00 |
151.623.475,00 |
166.085.864,00 |
|
|
b) Rendering of services: |
17.662,00 |
8.226,00 |
836,00 |
1.833,00 |
6.411,00 |
|
|
Returns and Rappel on sales: |
0,00 |
0,00 |
0,00 |
0,00 |
0,00 |
|
|
B.2. Stock increase of
manufactured goods and products in process: |
0,00 |
0,00 |
0,00 |
0,00 |
0,00 |
|
|
B.3. Works performed
by the company for fixed assets: |
0,00 |
0,00 |
0,00 |
0,00 |
0,00 |
|
|
B.4. Miscellaneous
operating income: |
3.366.521,00 |
2.962.812,00 |
3.228.665,00 |
4.173.997,00 |
3.278.742,00 |
|
|
a) Auxiliary income and other from current management: |
3.189.986,00 |
2.804.522,00 |
3.132.235,00 |
4.038.631,00 |
2.888.259,00 |
|
|
b) Grants: |
176.535,00 |
158.290,00 |
96.430,00 |
135.366,00 |
390.483,00 |
|
|
c) Liabilities and charges provisions surplus: |
0,00 |
0,00 |
0,00 |
0,00 |
0,00 |
|
|
B.I. PÉRDIDAS DE EXPLOTACIÓN
(A.1+A.2+A.3+A.4+A.5-A.6-B.1-B.2-B.3-B.4): |
19.531.591,00 |
12.838.542,00 |
4.553.172,00 |
0,00 |
0,00 |
|
|
B.5. Income from
equity investment: |
0,00 |
0,00 |
0,00 |
0,00 |
286.888,00 |
|
|
a) In companies of the group: |
0,00 |
0,00 |
0,00 |
0,00 |
183.469,00 |
|
|
b) In associated companies: |
0,00 |
0,00 |
0,00 |
0,00 |
0,00 |
|
|
c) Third parties: |
0,00 |
0,00 |
0,00 |
0,00 |
103.419,00 |
|
|
B.6. Income from other
marketable securities and long-term receivables: |
0,00 |
0,00 |
0,00 |
0,00 |
0,00 |
|
|
a) From companies of the group: |
0,00 |
0,00 |
0,00 |
0,00 |
0,00 |
|
|
b) From associated companies: |
0,00 |
0,00 |
0,00 |
0,00 |
0,00 |
|
|
c) From companies out of the group: |
0,00 |
0,00 |
0,00 |
0,00 |
0,00 |
|
|
B.7. Miscellaneous interests
or similar income: |
541.249,00 |
306.975,00 |
420.662,00 |
300.932,00 |
0,00 |
|
|
a) From companies of the group: |
285.597,00 |
33.600,00 |
9.859,00 |
123.552,00 |
0,00 |
|
|
b)
From associated companies: |
0,00 |
0,00 |
0,00 |
0,00 |
0,00 |
|
|
c) Miscellaneous interests: |
255.652,00 |
273.375,00 |
410.803,00 |
177.380,00 |
0,00 |
|
|
d) Profit on financial investment: |
0,00 |
0,00 |
0,00 |
0,00 |
0,00 |
|
|
B.8. Exchange positive
differences: |
0,00 |
0,00 |
0,00 |
0,00 |
0,00 |
|
|
B.II. NEGATIVE FINANCIAL RESULTS
(A.7+A.8+A.9-B.5-B.6-B.7-B.8): |
1.760.733,00 |
1.843.160,00 |
1.858.749,00 |
2.292.219,00 |
4.295.000,00 |
|
|
B.III. LOSSES ON ORDINARY ACTIVITIES ( B.I
+ B.II - A.I - A.II ): |
21.292.324,00 |
14.681.702,00 |
6.411.921,00 |
0,00 |
0,00 |
|
|
B.9.Profit on disposal
of both tangible and intangible fixed assets and securities portfolio: |
0,00 |
4.721.841,00 |
0,00 |
0,00 |
0,00 |
|
|
B.10. Profit on
transactions with own shares and debentures: |
0,00 |
0,00 |
0,00 |
0,00 |
0,00 |
|
|
B.11. Capital grants
transferred to profit and loss: |
189.319,00 |
222.029,00 |
275.260,00 |
279.403,00 |
245.802,00 |
|
|
B.12. Extraordinary
income: |
0,00 |
0,00 |
0,00 |
0,00 |
0,00 |
|
|
B.13. Income and profit
of former financial years: |
0,00 |
0,00 |
0,00 |
0,00 |
0,00 |
|
|
B.IV. NEGATIVE EXTRAORDINARY RESULTS
(A.10+A.11+A.12+A.13+A.14-B.9-B.10-B.11-B.12-B.13): |
12.033.064,00 |
0,00 |
570.822,00 |
2.111.269,00 |
290.696,00 |
|
|
B.V. LOSSES BEFORE TAXES
(B.III+B.IV-A.III-A.IV): |
33.325.388,00 |
11.829.875,00 |
6.982.743,00 |
0,00 |
0,00 |
|
|
B.VI. RESULT OF THE PERIOD (LOSSES)
(B.V+A.15+A.16): |
23.058.260,00 |
8.410.847,00 |
4.454.379,00 |
19.193,00 |
0,00 |
|
MERCANTILE REGISTRY.
|
|
|
|
|
|
Model: Normal
> Source of information: Data contained in this section is taken
from the information declared in the Annual Accounts submitted to the Trade
Register.
|
|
2013 |
2012 |
2011 |
2010 |
2009 |
|
|
1. Fiscal year result before taxes.: 61100 |
-33.325.388,00 |
-11.829.875,00 |
-6.982.743,00 |
7.748,00 |
6.170.503,00 |
|
|
2. Results adjustments.: 61200 |
28.083.190,00 |
13.386.087,00 |
15.972.604,00 |
18.373.872,00 |
15.796.100,00 |
|
|
a) Fixed Assets Amortization (+).:
61201 |
11.720.752,00 |
13.234.087,00 |
13.098.779,00 |
12.777.747,00 |
11.534.664,00 |
|
|
b) Obsolescence Allowances (+/-). :
61202 |
9.655.977,00 |
1.925.506,00 |
6.356,00 |
459.983,00 |
271.553,00 |
|
|
c) Variation in Provision (+/-). :
61203 |
2.390.367,00 |
1.104.991,00 |
388.578,00 |
1.237.646,00 |
0,00 |
|
|
d) Allocation of grants (-).: 61204 |
-189.319,00 |
-222.029,00 |
-275.260,00 |
-279.403,00 |
-245.802,00 |
|
|
e) Results on disposal of fixed assets
(+/-). : 61205 |
920.756,00 |
-4.721.841,00 |
601.026,00 |
1.816.673,00 |
264.945,00 |
|
|
f) Results on disposal of financial
instruments (+/-).: 61206 |
1.927.073,00 |
524.298,00 |
765.137,00 |
1.379.937,00 |
3.015.051,00 |
|
|
g) Financial income (-).: 61207 |
-541.249,00 |
-306.975,00 |
-420.662,00 |
-300.932,00 |
-286.888,00 |
|
|
h) Financial Expenses (+). : 61208 |
1.996.663,00 |
1.022.928,00 |
855.837,00 |
1.102.231,00 |
1.255.198,00 |
|
|
i) Exchange differences (+/-). :
61209 |
23.896,00 |
769.446,00 |
897.137,00 |
224.999,00 |
-52.648,00 |
|
|
k) Other income and expense (-/+). :
61211 |
178.274,00 |
55.676,00 |
55.676,00 |
-45.009,00 |
40.027,00 |
|
|
3. Changes in current capital equity.: 61300 |
-1.774.435,00 |
-5.635.373,00 |
-2.492.746,00 |
363.310,00 |
2.811.969,00 |
|
|
a) Stock (+/-).: 61301 |
11.121.276,00 |
-10.390.114,00 |
2.506.577,00 |
-2.543.990,00 |
8.276.875,00 |
|
|
d) Debtors and other accounts receivable (+/-).
: 61302 |
1.150.427,00 |
-3.004.434,00 |
3.315.397,00 |
-775.049,00 |
4.042.049,00 |
|
|
c) Other current assets (+/-). :
61303 |
-7.196.433,00 |
2.658.204,00 |
-5.227.510,00 |
4.869.999,00 |
-4.915.565,00 |
|
|
d) Creditors and other accounts payable
(+/-). : 61304 |
-3.537.814,00 |
750.169,00 |
-1.310.372,00 |
512.514,00 |
-4.940.666,00 |
|
|
e) Other current liabilities (+/-).:
61305 |
-3.308.138,00 |
4.296.498,00 |
-1.791.187,00 |
-1.532.199,00 |
349.276,00 |
|
|
f) Other non-current assets and liabilities
(+/-).: 61306 |
-3.753,00 |
54.304,00 |
14.349,00 |
-167.965,00 |
0,00 |
|
|
4. Other cash flows for operating activities.: 61400 |
-1.403.745,00 |
-697.880,00 |
-1.050.729,00 |
-1.875.706,00 |
-4.506.259,00 |
|
|
a) Interest payments (-). : 61401 |
-1.944.994,00 |
-1.004.433,00 |
-847.339,00 |
-1.150.607,00 |
-1.241.051,00 |
|
|
c) Interest collection (+). : 61403 |
541.249,00 |
306.975,00 |
420.662,00 |
475.489,00 |
103.418,00 |
|
|
d) Income tax payment collection (payments)
(+/-).: 61404 |
0,00 |
-422,00 |
-624.052,00 |
-1.200.588,00 |
-3.368.626,00 |
|
|
5. Operating activity cash flows (1 + 2 + 3 + 4) : 61500 |
-8.420.378,00 |
-4.777.041,00 |
5.446.386,00 |
16.869.224,00 |
20.272.313,00 |
|
|
6. Payments for investment (-).: 62100 |
-16.709.096,00 |
-19.963.537,00 |
-18.812.443,00 |
-17.464.172,00 |
-34.125.741,00 |
|
|
a) Companies of the group and affiliates. :
62101 |
-13.465.848,00 |
-15.000.395,00 |
-10.349.854,00 |
-8.569.998,00 |
-11.512.425,00 |
|
|
c) Fixed assets. : 62103 |
-600.569,00 |
-4.933.108,00 |
-8.303.678,00 |
-8.790.789,00 |
-22.523.448,00 |
|
|
e) Other financial assets. : 62105 |
-2.642.679,00 |
-30.034,00 |
-158.911,00 |
-103.385,00 |
-89.868,00 |
|
|
7. Divestment payment collection (+). : 62200 |
26.644.697,00 |
12.372.107,00 |
9.115.047,00 |
10.046.423,00 |
9.856.165,00 |
|
|
a) Companies of the group and affiliates. :
62201 |
13.043.923,00 |
12.199.512,00 |
8.344.851,00 |
9.449.569,00 |
8.995.449,00 |
|
|
c) Fixed assets. : 62203 |
13.600.774,00 |
1.100,00 |
0,00 |
9.199,00 |
493.044,00 |
|
|
e) Other financial assets. : 62205 |
0,00 |
0,00 |
0,00 |
587.655,00 |
367.672,00 |
|
|
g) Business Unit : 62207 |
0,00 |
0,00 |
444.112,00 |
0,00 |
0,00 |
|
|
h) Other assets. : 62208 |
0,00 |
171.495,00 |
326.084,00 |
0,00 |
0,00 |
|
|
8. Investment activity cash flows (6 + 7) minus Amortization:
62300 |
9.935.601,00 |
-7.591.430,00 |
-9.697.396,00 |
-7.417.749,00 |
-24.269.576,00 |
|
|
9. Payment collection and payments for equity instruments. :
63100 |
592.126,00 |
0,00 |
0,00 |
255.000,00 |
836.240,00 |
|
|
a) Issuance of equity instruments (+). :
63101 |
465.538,00 |
0,00 |
0,00 |
0,00 |
0,00 |
|
|
e) Grants, donations and bequests received
(+). : 63105 |
126.588,00 |
0,00 |
0,00 |
255.000,00 |
836.240,00 |
|
|
10. Payment collection and payments for financial liabilities
instruments.: 63200 |
-1.061.908,00 |
7.811.069,00 |
2.671.902,00 |
-684.755,00 |
10.711.262,00 |
|
|
a) Issuance : 63201 |
2.911.408,00 |
10.413.427,00 |
5.172.305,00 |
0,00 |
21.000.000,00 |
|
|
2. Debts incurred with credit institutions
(+). : 63203 |
0,00 |
8.247.801,00 |
4.770.653,00 |
0,00 |
21.000.000,00 |
|
|
3. Debts incurred with companies of the
group and affiliates (+).: 63204 |
662.984,00 |
0,00 |
0,00 |
0,00 |
0,00 |
|
|
5. Other debts (+). : 63206 |
2.248.424,00 |
2.165.626,00 |
401.652,00 |
0,00 |
0,00 |
|
|
b) Repayment and amortization of :
63207 |
-3.973.316,00 |
-2.602.358,00 |
-2.500.403,00 |
-684.755,00 |
-10.288.738,00 |
|
|
2. Debts incurred with credit institutions
(-).: 63209 |
-3.773.884,00 |
-2.434.514,00 |
-2.412.718,00 |
-597.070,00 |
-10.288.738,00 |
|
|
5. Other debts (-). : 63212 |
-199.432,00 |
-167.844,00 |
-87.685,00 |
-87.685,00 |
0,00 |
|
|
11. Payments from dividends and remunerations from other assets
instruments. : 63300 |
0,00 |
0,00 |
-640.275,00 |
-1.372.015,00 |
-5.488.057,00 |
|
|
b) Remuneration from other assets
instruments (-).: 63302 |
0,00 |
0,00 |
0,00 |
0,00 |
-5.488.057,00 |
|
|
12. Cash flows for financing activities (9+10+11).: 63400 |
-469.782,00 |
7.811.069,00 |
2.031.627,00 |
-1.801.770,00 |
6.059.445,00 |
|
|
D) EFECTO DE LAS VARIACIONES DE LOS TIPOS DE CAMBIO: 64000 |
0,00 |
0,00 |
0,00 |
0,00 |
0,00 |
|
|
E) NET INCREASE/DECREASE OF CASH OR EQUIVALENT ASSETS (+/-5+/-8+/12+/-D)
: 65000 |
1.045.441,00 |
-4.557.402,00 |
-2.219.383,00 |
7.649.705,00 |
2.062.182,00 |
|
|
Cash or equivalent assets as of beginning
of the fiscal year.: 65100 |
5.101.144,00 |
9.658.546,00 |
11.877.929,00 |
4.228.224,00 |
2.166.042,00 |
|
|
Cash or equivalent assets as of end of the
fiscal year.: 65200 |
6.146.585,00 |
5.101.144,00 |
9.658.546,00 |
11.877.929,00 |
4.228.224,00 |
|
|
|
|
|
|
|
> Economic-Financial Comparative Analysis
Data used in the following ratios and indicators is
taken from the Annual Accounts submitted by the company to the TRADE REGISTER.
Comparison within the Sector
|
Cash Flow |
2013 |
2012 |
Variación 2013 - 2012 |
|
|||
|
|
Empresa |
Sector |
Empresa |
Sector |
Empresa |
Sector |
|
|
Cash Flow over Sales: |
0,01 % |
-0,04 % |
-0,03 % |
0,01 % |
124,15 % |
-592,78 % |
|
|
EBITDA over Sales: |
-6,12 % |
11,47 % |
0,29 % |
9,21 % |
-2.179,28 % |
24,58 % |
|
|
Cash Flow Yield: |
0,01 % |
-0,03 % |
-0,03 % |
0,00 % |
127,69 % |
|
|
|
Profitability |
2013 |
2012 |
Variación 2013 - 2012 |
|
|||
|
|
Empresa |
Sector |
Empresa |
Sector |
Empresa |
Sector |
|
|
Operating economic profitability: |
-27,33 % |
7,37 % |
-6,64 % |
5,22 % |
-311,73 % |
41,17 % |
|
|
Total economic profitability: |
-21,33 % |
3,44 % |
-6,10 % |
2,53 % |
-249,89 % |
36,08 % |
|
|
Financial profitability: |
-24,00 % |
3,43 % |
-7,06 % |
1,44 % |
-240,03 % |
138,07 % |
|
|
Margin: |
-22,84 % |
5,58 % |
-7,15 % |
4,82 % |
-219,45 % |
15,68 % |
|
|
Mark-up: |
-25,44 % |
3,22 % |
-8,61 % |
1,68 % |
-195,37 % |
91,47 % |
|
|
Solvency |
2013 |
2012 |
Variación 2013 - 2012 |
|
|||
|
|
Empresa |
Sector |
Empresa |
Sector |
Empresa |
Sector |
|
|
Liquidity: |
0,31 |
0,15 |
0,13 |
0,12 |
138,57 |
27,82 |
|
|
Acid Test: |
1,47 |
0,73 |
0,96 |
0,87 |
53,48 |
-15,75 |
|
|
Working Capital / Investment: |
0,30 |
-0,03 |
0,25 |
0,03 |
20,24 |
-188,01 |
|
|
Solvency: |
4,16 |
1,05 |
2,33 |
1,19 |
78,23 |
-11,52 |
|
|
Indebtedness |
2013 |
2012 |
Variación 2013 - 2012 |
|
|||
|
|
Empresa |
Sector |
Empresa |
Sector |
Empresa |
Sector |
|
|
Indebtedness level: |
0,52 |
1,38 |
0,48 |
1,64 |
8,08 |
-15,95 |
|
|
Borrowing Composition: |
1,54 |
1,07 |
0,47 |
1,02 |
225,63 |
4,76 |
|
|
Repayment Ability: |
48,11 |
-22,84 |
-12,66 |
144,21 |
479,97 |
-115,84 |
|
|
Warranty: |
2,92 |
1,74 |
3,07 |
1,62 |
-4,95 |
7,25 |
|
|
Generated resources / Total creditors: |
-0,19 |
0,11 |
-0,09 |
0,07 |
-114,11 |
61,41 |
|
|
Efficiency |
2013 |
2012 |
Variación 2013 - 2012 |
|
|||
|
|
Empresa |
Sector |
Empresa |
Sector |
Empresa |
Sector |
|
|
Productivity: |
0,82 |
2,01 |
1,01 |
1,72 |
-19,17 |
16,88 |
|
|
Turnover of Collection Rights : |
9,91 |
6,74 |
4,62 |
4,79 |
114,46 |
40,54 |
|
|
Turnover of Payment Entitlements: |
6,19 |
3,95 |
4,06 |
3,53 |
52,68 |
11,86 |
|
|
Stock rotation: |
4,34 |
11,92 |
3,28 |
6,64 |
32,39 |
79,46 |
|
|
Assets turnover: |
1,20 |
1,32 |
0,93 |
1,08 |
28,89 |
22,04 |
|
|
Borrowing Cost: |
3,97 |
3,12 |
1,77 |
2,94 |
123,94 |
6,04 |
|
> Trend of indicators under the General Accounting Plan of 2007
(2013, 2012, 2011, 2010, 2009)
|
Cash Flow |
2013 |
2012 |
2011 |
2010 |
2009 |
|
|
Cash Flow over Sales: |
0,01 % |
-0,03 % |
-0,02 % |
0,05 % |
1,24 % |
|
|
EBITDA over Sales: |
-6,12 % |
0,29 % |
5,97 % |
11,34 % |
13,42 % |
|
|
Cash Flow Yield: |
0,01 % |
-0,03 % |
-0,01 % |
0,04 % |
1,14 % |
|
|
Profitability |
2013 |
2012 |
2011 |
2010 |
2009 |
|
|
Operating economic profitability: |
-27,33 % |
-6,64 % |
-3,43 % |
1,59 % |
7,08 % |
|
|
Total economic profitability: |
-21,33 % |
-6,10 % |
-3,56 % |
0,62 % |
4,09 % |
|
|
Financial profitability: |
-24,00 % |
-7,06 % |
-3,49 % |
-0,01 % |
3,70 % |
|
|
Margin: |
-22,84 % |
-7,15 % |
-3,34 % |
1,55 % |
6,18 % |
|
|
Mark-up: |
-25,44 % |
-8,61 % |
-4,77 % |
0,00 % |
-2,54 % |
|
|
Solvency |
2013 |
2012 |
2011 |
2010 |
2009 |
|
|
Liquidity: |
0,31 |
0,13 |
0,40 |
0,52 |
0,19 |
|
|
Acid Test: |
1,47 |
0,96 |
1,22 |
1,34 |
1,23 |
|
|
Working Capital / Investment: |
0,30 |
0,25 |
0,24 |
0,26 |
0,23 |
|
|
Solvency: |
4,16 |
2,33 |
2,87 |
3,10 |
2,83 |
|
|
Indebtedness |
2013 |
2012 |
2011 |
2010 |
2009 |
|
|
Indebtedness level: |
0,52 |
0,48 |
0,34 |
0,34 |
0,35 |
|
|
Borrowing Composition: |
1,54 |
0,47 |
0,81 |
0,98 |
1,05 |
|
|
Repayment Ability: |
48,11 |
-12,66 |
-19,86 |
5,86 |
-6,37 |
|
|
Warranty: |
2,92 |
3,07 |
3,91 |
3,98 |
3,89 |
|
|
Generated resources / Total creditors: |
-0,19 |
-0,09 |
0,21 |
0,32 |
1,63 |
|
|
Efficiency |
2013 |
2012 |
2011 |
2010 |
2009 |
|
|
Productivity: |
0,82 |
1,01 |
1,18 |
1,37 |
1,50 |
|
|
Turnover of Collection Rights : |
9,91 |
4,62 |
9,91 |
8,45 |
8,96 |
|
|
Turnover of Payment Entitlements: |
6,19 |
4,06 |
5,46 |
4,64 |
5,04 |
|
|
Stock rotation: |
4,34 |
3,28 |
4,27 |
4,01 |
4,51 |
|
|
Assets turnover: |
1,20 |
0,93 |
1,03 |
1,02 |
1,15 |
|
|
Borrowing Cost: |
3,97 |
1,77 |
1,94 |
2,46 |
2,69 |
|
|
|
|
|
|
|
Sector-based Comparison
under the rules of the New General Accounting Plan.
|
|
Variación - |
|
|
|
Empresa |
Sector |
|
|
Variación - |
|
|
|
Empresa |
Sector |
|
|
Variación - |
|
|
|
Empresa |
Sector |
|
|
|
Expansión.com |
12/05/2014 |
|
Adolfo Domínguez gestionará sus tiendas con tecnología en la nube
de IBM |
|
|
Companies related |
|
|
INTERNATIONAL BUSINESS MACHINES SA |
|
|
|
|
|
20minutos.es |
14/01/2014 |
|
Adolfo Domínguez reduce un 8,6% sus pérdidas en los nueve
primeros de su año fiscal y cierra 21 tiendas |
|
|
Companies related |
|
|
|
|
|
|
|
|
|
|
No Public Tenders
assigned to the name of the company.
|
|
|
|
|
|
|
Entity |
INSTITUTO GALEGO DE PROMOCIÓN
ECONÓMICA (IGAPE, XUNTA DE GALICIA) |
|
Status |
CONCEDIDA |
|
Amount Granted |
599.793,00 |
|
Notes |
El importe reflejado corresponde al importe
concedido |
|
Entity |
CONSELLERIA DE INNOVACION, INDUSTRIA
E COMERCIO, XUNTA DE GALICIA |
|
Status |
CONCEDIDA |
|
Amount Granted |
285.577,00 |
|
Notes |
El importe reflejado corresponde al
importe concedido. |
|
Entity |
CONSELLERIA DE INNOVACIÓN E
INDUSTRIA, XUNTA DE GALICIA |
|
Status |
CONCEDIDA |
|
Amount Granted |
255.000,00 |
|
Notes |
El importe reflejado corresponde al
importe concedido |
|
Entity |
CONSELLERIA DE INNOVACION, INDUSTRIA E
COMERCIO, XUNTA DE GALICIA |
|
Status |
CONCEDIDA |
|
Amount Granted |
166.831,00 |
|
Notes |
El importe reflejado corresponde al
importe concedido. |
|
Entity |
INSTITUTO GALEGO DE PROMOCIÓN
ECONÓMICA (IGAPE, XUNTA DE GALICIA) |
|
Status |
CONCEDIDA |
|
Amount Granted |
147.436,00 |
|
Notes |
El importe reflejado corresponde al
importe concedido |
|
Entity |
INSTITUTO GALEGO DE PROMOCIÓN
ECONÓMICA (IGAPE, XUNTA DE GALICIA) |
|
Status |
CONCEDIDA |
|
Amount Granted |
106.305,00 |
|
Notes |
El importe reflejado corresponde al
importe concedido |
|
Entity |
CONSELLERIA DE INNOVACIÓN E
INDUSTRIA, XUNTA DE GALICIA |
|
Status |
CONCEDIDA |
|
Amount Granted |
89.011,00 |
|
Notes |
El importe reflejado corresponde al importe
concedido |
|
Entity |
INSTITUTO GALEGO DE PROMOCIÓN
ECONÓMICA (IGAPE, XUNTA DE GALICIA) |
|
Status |
CONCEDIDA |
|
Amount Granted |
84.944,00 |
|
Notes |
El importe reflejado corresponde al
importe concedido |
|
Entity |
CONSELLERIA DE INNOVACION, INDUSTRIA
E COMERCIO, XUNTA DE GALICIA |
|
Status |
CONCEDIDA |
|
Amount Granted |
83.754,00 |
|
Notes |
El importe reflejado corresponde al
importe concedido. |
|
Entity |
INSTITUTO GALEGO DE PROMOCION
ECONOMICA |
|
Subsidy Concept |
Subvención de capital. |
|
Status |
CONCEDIDA |
|
Amount Granted |
90.552,00 |
|
Notes |
Imputado a resultados. |
|
Entity |
CONSELLERIA DE INNOVACION, INDUSTRIA
E COMERCIO, XUNTA DE GALICIA |
|
Subsidy Concept |
subvención de capital |
|
Status |
CONCEDIDA |
|
Amount Granted |
42.945,00 |
|
Notes |
Imputado a resultados. |
|
Entity |
INSTITUTO GALEGO DE PROMOCION
ECONOMICA |
|
Subsidy Concept |
Subvención de capital. |
|
Status |
CONCEDIDA |
|
Amount Granted |
32.681,00 |
|
Notes |
Imputado a resultados. |
|
Entity |
CONSELLERIA DE INNOVACION, INDUSTRIA
E COMERCIO, XUNTA DE GALICIA |
|
Subsidy Concept |
Subvención de capital. |
|
Status |
CONCEDIDA |
|
Amount Granted |
32.378,00 |
|
Notes |
Imputado a resultados. |
|
Entity |
CONSELLERIA DE INNOVACION E
INDUSTRIA, XUNTA DE GALICIA |
|
Subsidy Concept |
Subvención de capital. |
|
Status |
CONCEDIDA |
|
Amount Granted |
28.449,00 |
|
Notes |
Imputado a resultados. |
|
Entity |
CONSELLERIA DE INNOVACION, INDUSTRIA
E COMERCIO, XUNTA DE GALICIA |
|
Subsidy Concept |
Subvención de capital. |
|
Status |
CONCEDIDA |
|
Amount Granted |
20.020,00 |
|
Notes |
Imputado a resultados. |
|
Entity |
INSTITUTO GALEGO DE PROMOCION ECONOMICA |
|
Subsidy Concept |
Subvención de capital. |
|
Status |
CONCEDIDA |
|
Amount Granted |
10.133,00 |
|
Notes |
Imputado a resultados. |
|
Entity |
CONSELLERIA DE INNOVACION, INDUSTRIA
E COMERCIO, XUNTA DE GALICIA |
|
Subsidy Concept |
Subvención de capital. |
|
Status |
CONCEDIDA |
|
Amount Granted |
9.749,00 |
|
Notes |
Imputado a resultados. |
|
Entity |
INSTITUTO GALEGO DE PROMOCION
ECONOMICA |
|
Subsidy Concept |
Subvención de capital. |
|
Status |
CONCEDIDA |
|
Amount Granted |
8.353,00 |
|
Notes |
Imputado a resultados. |
|
Entity |
INSTITUTO GALEGO DE PROMOCION
ECONOMICA |
|
Subsidy Concept |
Subvención de capital. |
|
Status |
CONCEDIDA |
|
Amount Granted |
599.793,00 |
|
Notes |
Se ha traspasado a resultados del
ejercicio 110551 euros, quedando a fecha de cierre pendiente de imputar
396412 euros. El importe reflejado es el importe concedido |
|
Entity |
CONSELLERIA DE INNOVACION, INDUSTRIA
E COMERCIO, XUNTA DE GALICIA |
|
Subsidy Concept |
Subvención de capital. |
|
Status |
CONCEDIDA |
|
Amount Granted |
285.577,00 |
|
Notes |
Se ha traspasado a resultados del
ejercicio 34816 euros, quedando a fecha de cierre pendiente de imputar 124624
euros. El importe reflejado es el importe concedido |
|
Entity |
CONSELLERIA DE INNOVACION, INDUSTRIA
E COMERCIO, XUNTA DE GALICIA |
|
Subsidy Concept |
Subvención de capital. |
|
Status |
CONCEDIDA |
|
Amount Granted |
166.831,00 |
|
Notes |
Se ha traspasado a resultados del
ejercicio 20.020 euros, quedando a fecha de cierre pendiente de imputar 72689
euros. El importe reflejado es el importe concedido |
|
Entity |
INSTITUTO GALEGO DE PROMOCION
ECONOMICA |
|
Subsidy Concept |
Subvención de capital. |
|
Status |
CONCEDIDA |
|
Amount Granted |
147.436,00 |
|
Notes |
Se ha traspasado a resultados del
ejercicio 48795 euros, quedando a fecha de cierre pendiente de imputar 55686
euros. El importe reflejado es el importe concedido |
|
Entity |
INSTITUTO GALEGO DE PROMOCION
ECONOMICA |
|
Subsidy Concept |
Subvención de capital. |
|
Status |
CONCEDIDA |
|
Amount Granted |
106.305,00 |
|
Notes |
Se ha traspasado a resultados del
ejercicio 9.734 euros, quedando a fecha de cierre pendiente de imputar 14192
euros. El importe reflejado es el importe concedido |
|
Entity |
CONSELLERIA DE INNOVACION E
INDUSTRIA, XUNTA DE GALICIA |
|
Subsidy Concept |
Subvención de capital. |
|
Status |
CONCEDIDA |
|
Amount Granted |
89.011,00 |
|
Notes |
Se ha traspasado a resultados del
ejercicio 7156 euros, quedando a fecha de cierre pendiente de imputar 247844
euros. El importe reflejado es el importe concedido |
|
Entity |
CONSELLERIA DE INNOVACION, INDUSTRIA
E COMERCIO, XUNTA DE GALICIA |
|
Subsidy Concept |
Subvención de capital. |
|
Status |
CONCEDIDA |
|
Amount Granted |
83.754,00 |
|
Notes |
Se ha traspasado a resultados del ejercicio
9749 euros, quedando a fecha de cierre pendiente de imputar 28701 euros. El
importe reflejado es el importe concedido |
|
Entity |
INSTITUTO GALEGO DE PROMOCION
ECONOMICA |
|
Status |
CONCEDIDA |
|
Amount Granted |
106.305,00 |
|
Entity |
INSTITUTO GALEGO DE PROMOCION
ECONOMICA |
|
Status |
CONCEDIDA |
|
Amount Granted |
84.944,00 |
|
Entity |
ORGANISMO NO ESPECIFICADO |
|
Subsidy Concept |
Subvención de explotación |
|
Status |
CONCEDIDA |
|
Amount Granted |
64.082,00 |
|
Entity |
CONSELLERIA DE INNOVACION, INDUSTRIA
Y COMERCIO DE LA XUNTA DE GALICIA |
|
Status |
CONCEDIDA |
|
Amount Granted |
36.318,00 |
|
Notes |
queda un saldo a fecha de cierre del
ejercicio de 237.959 euros. |
|
Entity |
CONSELLERIA DE INNOVACION, INDUSTRIA
Y COMERCIO DE LA XUNTA DE GALICIA |
|
Status |
CONCEDIDA |
|
Amount Granted |
20.020,00 |
|
Notes |
quedan un saldo a fecha de cierre del
ejercicio de 136.083 euros. |
|
Entity |
CONSELLERIA DE INNOVACION, INDUSTRIA
Y COMERCIO DE LA XUNTA DE GALICIA |
|
Status |
CONCEDIDA |
|
Amount Granted |
18.797,00 |
|
Notes |
queda un saldo a fecha de cierre del
ejercicio de 13.965 euros. |
|
Entity |
INSTITUTO GALEGO DE PROMOCION ECONOMICA |
|
Status |
CONCEDIDA |
|
Amount Granted |
13.340,00 |
|
Notes |
queda un saldo a fecha de cierre del
ejercicio de 46.793 euros. |
|
Entity |
INSTITUTO GALEGO DE PROMOCION
ECONOMICA |
|
Status |
CONCEDIDA |
|
Amount Granted |
12.807,00 |
|
Notes |
queda un saldo a fecha de cierre del
ejercicio de 732 euros. |
|
Entity |
CONSELLERIA DE INNOVACION, INDUSTRIA
Y COMERCIO DE LA XUNTA DE GALICIA |
|
Status |
CONCEDIDA |
|
Amount Granted |
10.377,00 |
|
Notes |
queda un saldo a fecha de cierre del
ejercicio de 60.567 euros. |
|
Entity |
INSTITUTO GALEGO DE PROMOCION
ECONOMICA |
|
Status |
CONCEDIDA |
|
Amount Granted |
8.259,00 |
|
Notes |
queda un saldo a fecha de cierre del
ejercicio de 3.022 euros. |
|
Entity |
INSTITUTO GALEGO DE PROMOCION
ECONOMICA |
|
Status |
CONCEDIDA |
|
Amount Granted |
331.967,00 |
|
Notes |
El saldo traspasado a resultados es
de 36.428 euros, quedando así un saldo a fecha de cierre del ejercicio de
13.539 euros. |
|
Entity |
CONSELLERIA DE INNOVACION, INDUSTRIA
Y COMERCIO DE LA XUNTA DE GALICIA |
|
Status |
CONCEDIDA |
|
Amount Granted |
285.577,00 |
|
Notes |
El saldo traspasado a resultados es de
11.300 euros, quedando así un saldo a fecha de cierre del ejercicio de
274.277 euros. |
|
Entity |
CONSELLERIA DE INNOVACION, INDUSTRIA
Y COMERCIO DE LA XUNTA DE GALICIA |
|
Status |
CONCEDIDA |
|
Amount Granted |
166.831,00 |
|
Notes |
El saldo traspasado a resultados es
de 10.726 euros, quedando así un saldo a fecha de cierre del ejercicio de
156.105 euros. |
|
Entity |
INSTITUTO GALEGO DE PROMOCION
ECONOMICA |
|
Status |
CONCEDIDA |
|
Amount Granted |
123.652,00 |
|
Notes |
El saldo traspasado a resultados es
de 11.929 euros, quedando así un saldo a fecha de cierre del ejercicio de
11.281 euros. |
|
Entity |
CONSELLERIA DE INNOVACION, INDUSTRIA
Y COMERCIO DE LA XUNTA DE GALICIA |
|
Status |
CONCEDIDA |
|
Amount Granted |
106.305,00 |
|
Notes |
El saldo traspasado a resultados es
de 46.172 euros, quedando así un saldo a fecha de cierre del ejercicio de
60.133 euros. |
|
Entity |
CONSELLERIA DE INNOVACION, INDUSTRIA
Y COMERCIO DE LA XUNTA DE GALICIA |
|
Status |
CONCEDIDA |
|
Amount Granted |
83.754,00 |
|
Notes |
El saldo traspasado a resultados es
de 10.375 euros, quedando así un saldo a fecha de cierre del ejercicio de
70.944 euros. |
|
Entity |
CONSELLERIA DE INNOVACION, INDUSTRIA Y
COMERCIO DE LA XUNTA DE GALICIA |
|
Status |
CONCEDIDA |
|
Amount Granted |
75.192,00 |
|
Notes |
El saldo traspasado a resultados es
de 18.801 euros, quedando así un saldo a fecha de cierre del ejercicio de
32.762 euros. |
|
Entity |
INSTITUTO DE PROMOCION ECONOMICA |
|
Status |
CONCEDIDA |
|
Amount Granted |
123.652,00 |
|
Notes |
SUBVENCION DE CAPITAL |
FOREIGN EXCHANGE RATES
|
Currency |
Unit
|
Indian Rupees |
|
US Dollar |
1 |
Rs.59.03 |
|
|
1 |
Rs.98.91 |
|
Euro |
1 |
Rs.80.33 |
INFORMATION DETAILS
|
Analysis Done by
: |
SUB |
|
|
|
|
Report Prepared
by : |
PDT |
RATING EXPLANATIONS
|
RATING |
STATUS |
PROPOSED CREDIT LINE |
|
|
|
>86 |
Aaa |
Possesses an extremely sound financial base with the strongest capability
for timely payment of interest and principal sums |
Unlimited |
|
|
71-85 |
Aa |
Possesses adequate working capital. No caution needed for credit
transaction. It has above average (strong) capability for payment of interest
and principal sums |
Large |
|
|
56-70 |
A |
Financial & operational base are regarded healthy. General
unfavourable factors will not cause fatal effect. Satisfactory capability for
payment of interest and principal sums |
Fairly Large |
|
|
41-55 |
Ba |
Overall operation is considered normal. Capable to meet normal
commitments. |
Satisfactory |
|
|
26-40 |
B |
Capability to overcome financial difficulties seems comparatively
below average. |
Small |
|
|
11-25 |
Ca |
Adverse factors are apparent. Repayment of interest and principal sums
in default or expected to be in default upon maturity |
Limited with
full security |
|
|
<10 |
C |
Absolute credit risk exists. Caution needed to be exercised |
Credit not
recommended |
|
|
-- |
NB |
New Business |
-- |
|
This score serves as a reference to assess
SC’s credit risk and to set the amount of credit to be extended. It is
calculated from a composite of weighted scores obtained from each of the major sections
of this report. The assessed factors and their relative weights (as indicated
through %) are as follows:
Financial
condition (40%) Ownership
background (20%) Payment
record (10%)
Credit history
(10%) Market trend (10%) Operational size
(10%)
This report is issued at your request without any
risk and responsibility on the part of MIRA INFORM PRIVATE LIMITED (MIPL)
or its officials.