MIRA
INFORM REPORT
|
Report Date : |
31.05.2014 |
IDENTIFICATION DETAILS
|
Name : |
JEWOMETAAL
STAINLESS PROCESSING B.V. |
|
|
|
|
Registered Office : |
Quebecstraat 7, 3197KL Botlek Rotterdam |
|
|
|
|
Country : |
Netherlands |
|
|
|
|
Financials (as on) : |
31.12.2012 |
|
|
|
|
Date of Incorporation : |
22.07.1976 |
|
|
|
|
Com. Reg. No.: |
24128177 |
|
|
|
|
Legal Form : |
Private Company |
|
|
|
|
Line of Business : |
· Wholesaler of ferrous metals and ferrous semi-finished products Wholesaler of iron and steel scrap and used nonferrous
metals |
|
|
|
|
No of Employees : |
71 (2014) |
RATING & COMMENTS
|
MIRA’s Rating : |
Ba |
|
RATING |
STATUS |
PROPOSED CREDIT LINE |
|
|
41-55 |
Ba |
Overall operation is considered normal. Capable to meet normal commitments. |
Satisfactory |
|
Status : |
Satisfactory |
|
|
|
|
Payment Behaviour : |
No Complaints |
|
|
|
|
Litigation : |
Clear |
NOTES :
Any query related to this report can be made
on e-mail : infodept@mirainform.com
while quoting report number, name and date.
ECGC Country Risk Classification List – March 31, 2014
|
Country Name |
Previous Rating (31.12.2013) |
Current Rating (31.03.2014) |
|
Netherlands |
A1 |
A1 |
|
Risk Category |
ECGC Classification |
|
Insignificant |
A1 |
|
Low Risk |
A2 |
|
Moderate Low Risk |
B1 |
|
Moderate Risk |
B2 |
|
Moderate High Risk |
C1 |
|
High Risk |
C2 |
|
Very High Risk |
D |
netherlands ECONOMIC OVERVIEW
The Dutch economy is the sixth-largest economy in the
euro-zone and is noted for its stable industrial relations, moderate
unemployment and inflation, a sizable trade surplus, and an important role as a
European transportation hub. Industrial activity is predominantly in food
processing, chemicals, petroleum refining, and electrical machinery. A highly
mechanized agricultural sector employs only 2% of the labor force but provides
large surpluses for the food-processing industry and for exports. The Netherlands,
along with 11 of its EU partners, began circulating the euro currency on 1
January 2002. After 26 years of uninterrupted economic growth, the Dutch
economy - highly dependent on an international financial sector and
international trade - contracted by 3.5% in 2009 as a result of the global
financial crisis. The Dutch financial sector suffered, due in part to the high
exposure of some Dutch banks to U.S. mortgage-backed securities. In 2008, the
government nationalized two banks and injected billions of dollars of capital
into other financial institutions, to prevent further deterioration of a
crucial sector. The government also sought to boost the domestic economy by
accelerating infrastructure programs, offering corporate tax breaks for
employers to retain workers, and expanding export credit facilities. The
stimulus programs and bank bailouts, however, resulted in a government budget
deficit of 5.3% of GDP in 2010 that contrasted sharply with a surplus of 0.7%
in 2008. The government of Prime Minister Mark RUTTE began implementing fiscal
consolidation measures in early 2011, mainly reductions in expenditures, which
resulted in an improved budget deficit in 2011. In 2012-13 tax revenues
dropped, GDP contracted, and the budget deficit deteriorated. Although jobless
claims continued to grow, the unemployment rate remained relatively low at 6.8
percent.
|
Source : CIA |
company summary
Company name Jewometaal Stainless Processing B.V.
Operative address Quebecstraat 7
3197KL Botlek Rotterdam
Netherlands
Status Active
Specification This company can
meet all its obligations.
Legal form Besloten
Vennootschap (Private Company)
Registration number KvK-nummer:
24128177
VAT-number 003788830
|
Year |
2012 |
Mutation |
2011 |
Mutation |
2010 |
|
Fixed
assets |
12.057.000 |
-0,89 |
12.165.000 |
24,39 |
9.780.000 |
|
Total
receivables |
5.164.000 |
-5,07 |
5.440.000 |
111,59 |
2.571.000 |
|
Total
equity |
14.240.000 |
1,52 |
14.027.000 |
-19,61 |
17.449.000 |
|
Short
term liabilities |
53.514.000 |
18,09 |
45.316.000 |
-58,08 |
108.101.000 |
|
Net
result |
3.714.000 |
-8,93 |
4.078.000 |
-41,05 |
6.918.000 |
|
Working
capital |
3.893.000 |
-69,38 |
12.713.000 |
45,29 |
8.750.000 |
|
Quick
ratio |
0,10 |
-16,67 |
0,12 |
500,00 |
0,02 |
Contact information
Company name Jewometaal
Stainless Processing B.V.
Trade names Jewometaal
Stainless Processing B.V.
Operative address Quebecstraat 7
3197KL Botlek Rotterdam
Netherlands
Correspondence address Postbus 1264
3180AG Rozenburg Zh
Netherlands
Telephone number 0181242424
Fax number 0181242425
Email address info@jewometaal.com
Website www.jewometaal.com
Registration
Registration number KvK-nummer:
24128177
Branch number 000017062438
VAT-number 003788830
Status Active
First registration
company register 1976-07-22
Memorandum 1976-06-30
Establishment date 1976-06-30
Legal form Besloten
Vennootschap (Private Company)
Last proposed
admendment 1997-09-15
Activities
SBI Wholesaler of
ferrous metals and ferrous semi-finished products (46722)
Wholesaler of iron and steel scrap and used
nonferrous metals (46772)
Exporter Yes
Importer Yes
Goal Groothandel,
daaronder begrepen im- en export in metalen, ertsen, legeringen en metaalafval
(Wholesale trade, including import and export of metals, ores, alloys and metal)
Relations
Shareholders Naam: ELG Haniel
GmbH
Bezoekadres: Kremerskamp 16, 47138 Duisburg,
Duitsland
Ingeschreven in:
Handelsregister Duisburg, Bondsrepubliek Duitsland onder nummer HRB5910
Enig aandeelhouder
sedert: 13-11-1996
Management
Active Management
D. Bijl (Dirk)
Netherlands
Competence: Jointly authorized
Function: Manager
Starting date: 1983-11-01
Date of birth: 1942-11-23, Rotterdam, NL
H. Aulich (Hendrikus)
Netherlands
Competence: Jointly authorized
Function: Manager
Starting date: 2007-08-01
Date of birth: 1966-05-20, Straatsburg, FR
A. Roedolf (Adriaan)
Netherlands
Competence: Jointly authorized
Function: Manager
Starting date: 2011-01-07
Date of birth: 1953-10-03, Rotterdam, NL
N.L.J. Späker (Norbert Ludger Johann)
Netherlands
Function: Commissaris
Starting date: 2007-08-01
Date of birth: 1957-02-24, Lembeck J Dorsten, DE
D. Drafz (Detlef)
Netherlands
Function: Commissaris
Starting date: 2013-01-01
Date of birth: 1962-06-27, Ebstdorf, DE
S. Landwehrmann (Silke)
Netherlands
Function: Commissaris
Starting date: 2013-01-01
Date of birth: 1971-06-17, Keulen, DE
E. Oosterom (Eric)
Netherlands
Competence: Limited authorization
Function: Proxy
Starting date: 2012-03-01
Date of birth: 1970-07-05, Rotterdam, NL
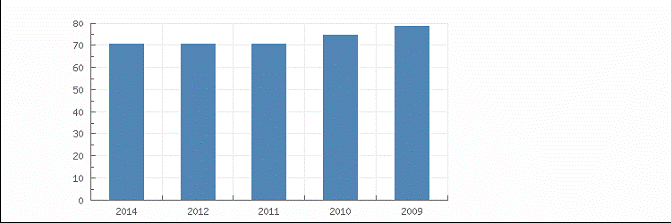
Employees
Total according to the Chamber of Commerce 71
Year 2014
2012 2011 2010 2009
Total 71
71 71 75 79
Payments
Description Payments made
under regular condition
|
Key figures |
|||||
|
Year |
2012 |
2011 |
2010 |
2009 |
2008 |
|
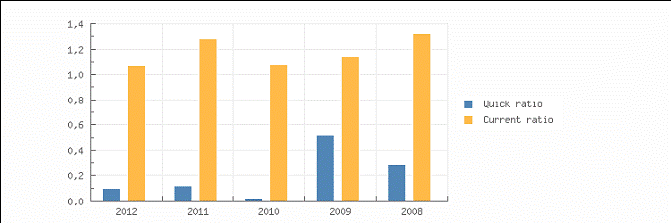
Quick ratio |
0,10 |
0,12 |
0,02 |
0,52 |
0,29 |
|
Current ratio |
1,07 |
1,28 |
1,08 |
1,14 |
1,32 |
|
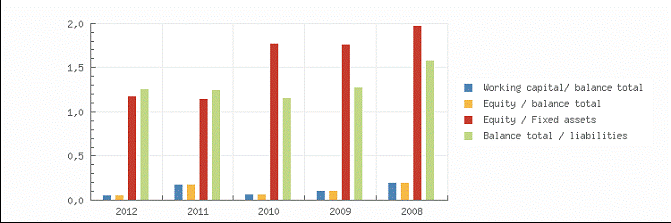
Working capital/ balance total |
0,06 |
0,18 |
0,07 |
0,11 |
0,20 |
|
Equity / balance total |
0,20 |
0,20 |
0,14 |
0,22 |
0,37 |
|
Equity / Fixed assets |
1,18 |
1,15 |
1,78 |
1,77 |
1,98 |
|
Equity / liabilities |
0,26 |
0,25 |
0,16 |
0,28 |
0,58 |
|
Balance total / liabilities |
1,26 |
1,25 |
1,16 |
1,28 |
1,58 |
|
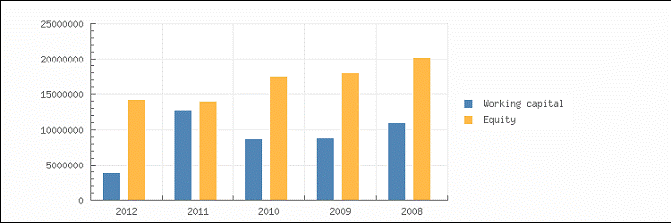
Working capital |
3.893.000 |
12.713.000 |
8.750.000 |
8.869.000 |
11.029.000 |
|
Equity |
14.240.000 |
14.027.000 |
17.449.000 |
18.031.000 |
20.211.000 |
|
Mutation equity |
1,52 |
-19,61 |
-3,23 |
-10,79 |
-15,90 |
|
Mutation short term liabilities |
18,09 |
-58,08 |
68,81 |
88,59 |
-28,36 |
|
Return on total assets (ROA) |
6,85 |
7,74 |
7,33 |
8,50 |
27,17 |
|
Return on equity (ROE) |
33,39 |
38,72 |
53,18 |
39,17 |
74,18 |
|
Gross profit margin |
1,19 |
1,17 |
1,76 |
2,13 |
2,87 |
|
Net profit margin |
0,61 |
0,56 |
1,04 |
1,41 |
1,89 |
|
Average collection ratio |
11,32 |
16,05 |
6,15 |
5,90 |
17,43 |
|
Average payment ratio |
117,35 |
133,72 |
258,53 |
11,41 |
60,15 |
|
Equity turnover ratio |
42,55 |
51,86 |
38,09 |
20,95 |
29,28 |
|
Total assets turnover ratio |
8,72 |
10,36 |
5,25 |
4,55 |
10,73 |
|
Fixed assets turnover ratio |
50,26 |
59,80 |
67,96 |
37,02 |
58,11 |
|
Inventory conversion ratio |
11,60 |
13,83 |
5,82 |
9,50 |
16,84 |
|
Turnover |
605.974.000 |
727.412.000 |
664.682.000 |
377.789.000 |
591.828.000 |
|
Operating result |
7.204.000 |
8.524.000 |
11.669.000 |
8.053.000 |
16.974.000 |
|
Net result after taxes |
3.714.000 |
4.078.000 |
6.918.000 |
5.320.000 |
11.178.000 |
|
Gross Profit |
605.974.000 |
727.412.000 |
--- |
--- |
---- |
|
EBIT |
7.204.000 |
8.524.000 |
11.669.000 |
8.053.000 |
16.974.000 |
Summary
The 2012 financial result structure is a positive working capital of 3.893.000
euro, which is in
agreement with 6 % of the total assets of the company.
The working capital has diminished with -69.38 % compared to previous
year. The ratio, with
respect to the total assets of the company has however, declined.
The deterioration between 2011 and 2012 has mainly been caused by an
increase of the
current liabilities.
The current ratio of the company in 2012 was 1.07. When the current
ratio is below 1.5, the
company may have problems meeting its short-term obligations.
The quick ratio in 2012 of the company was 0.1. A company with a Quick
Ratio of less than 1
cannot currently pay back its current liabilities.
The 2011 financial result structure is a positive working capital of
12.713.000 euro, which is in
agreement with 18 % of the total assets of the company.
The working capital has increased with 45.29 % compared to previous
year. The ratio, with
respect to the total assets of the company has however, increased.
The improvement between 2010 and 2011 has mainly been caused by an
increase of the
current assets.
The current ratio of the company in 2011 was 1.28. When the current
ratio is below 1.5, the
company may have problems meeting its short-term obligations.
The quick ratio in 2011 of the company was 0.12. A company with a Quick
Ratio of less than
1 cannot currently pay back its current liabilities.
Financial statement
Type of annual account Corporate
Annual account Jewometaal
Stainless Processing B.V.
Quebecstraat 7
3197KL Botlek Rotterdam
Netherlands
Registration number: 241281770000
Balance sheet
|
Year |
2012 |
2011 |
2010 |
2009 |
2008 |
|
End
date |
2012-12-31 |
2011-12-31 |
2010-12-31 |
2009-12-31 |
2008-12-31 |
|
Tangible fixed assets |
12.057.000 |
12.040.000 |
9.655.000 |
10.079.000 |
10.060.000 |
|
Financial fixed assets |
|
125.000 |
125.000 |
125.000 |
125.000 |
|
Fixed assets |
12.057.000 |
12.165.000 |
9.780.000 |
10.204.000 |
10.185.000 |
|
Total stock |
52.235.000 |
52.579.000 |
114.275.000 |
39.778.000 |
35.138.000 |
|
Accounts receivable |
1.799.000 |
1.017.000 |
|
28.928.000 |
2.306.000 |
|
Other receivables |
3.365.000 |
4.423.000 |
|
4.193.000 |
7.533.000 |
|
Total receivables |
5.164.000 |
5.440.000 |
2.571.000 |
33.121.000 |
9.839.000 |
|
Liquid funds |
8.000 |
10.000 |
5.000 |
7.000 |
8.000 |
|
Current assets |
57.407.000 |
58.029.000 |
116.851.000 |
72.906.000 |
44.985.000 |
|
Total assets |
69.464.000 |
70.194.000 |
126.631.000 |
83.110.000 |
55.170.000 |
|
|
|||||
|
Issued capital |
227.000 |
227.000 |
227.000 |
227.000 |
227.000 |
|
Other
reserves |
10.300.000 |
9.722.000 |
10.304.000 |
12.484.000 |
8.806.000 |
|
Non-distributable
profit |
3.713.000 |
4.078.000 |
6.918.000 |
5.320.000 |
11.178.000 |
|
Total reserves |
14.013.000 |
13.800.000 |
17.222.000 |
17.804.000 |
19.984.000 |
|
Total equity |
14.240.000 |
14.027.000 |
17.449.000 |
18.031.000 |
20.211.000 |
|
Provisions |
1.710.000 |
2.127.000 |
1.081.000 |
1.042.000 |
1.003.000 |
|
Long
term interest yielding debt |
|
8.724.000 |
|
|
|
|
Long term liabilities |
|
8.724.000 |
|
||
|
Accounts
payable |
5.109.000 |
9.302.000 |
|
3.391.000 |
2.540.000 |
|
Other
short term liabilities |
48.405.000 |
36.014.000 |
|
60.646.000 |
31.416.000 |
|
Short term liabilities |
53.514.000 |
45.316.000 |
108.101.000 |
64.037.000 |
33.956.000 |
|
Total short and long term
liabilities |
55.224.000 |
56.167.000 |
109.182.000 |
65.079.000 |
34.959.000 |
|
Total liabilities |
69.464.000 |
70.194.000 |
126.631.000 |
83.110.000 |
55.170.000 |
Summary
The total assets of the company decreased with -1.04 % between 2011 and
2012.
The total assets are entirely composed of current assets.
The asset reduction is in contrast with the equity growth of 1.52 %. Due
to this the total debt decreased with -1.68 %.
In 2012 the assets of the company were 17.36 % composed of fixed assets
and 82.64 % by
current assets. The assets are being financed by an equity of 20.5 %,
and total debt of 79.5
%.
The total assets of the company decreased with -44.57 % between 2010 and
2011.
Despite the total assets decrease, non current assets grew with 24.39 %.
Assets reduction is explained by a Net Worth decrease of -19.61 %, and
an indebtedness
reduction of -48.56 %.
In 2011 the assets of the company were 17.33 % composed of fixed assets
and 82.67 % by
current assets. The assets are being financed by an equity of 19.98 %,
and total debt of
Profit & loss
|
Year |
2012 |
2011 |
2010 |
2009 |
2008 |
|
Revenues |
606.292.000 |
729.255.000 |
664.682.000 |
377.789.000 |
591.828.000 |
|
Other
operating income |
318.000 |
1.843.000 |
|
|
|
|
Net turnover |
605.974.000 |
727.412.000 |
664.682.000 |
377.789.000 |
591.828.000 |
|
Operating
expenses |
599.088.000 |
720.731.000 |
653.013.000 |
369.736.000 |
574.854.000 |
|
Operating result |
7.204.000 |
8.524.000 |
11.669.000 |
8.053.000 |
16.974.000 |
|
|
|||||
|
Financial
income |
736.000 |
52.000 |
15.000 |
95.000 |
439.000 |
|
Financial
expenses |
3.185.000 |
3.145.000 |
2.405.000 |
1.085.000 |
2.421.000 |
|
Financial
result |
-2.449.000 |
-3.093.000 |
-2.390.000 |
-990.000 |
-1.982.000 |
|
Result on ordinary operations before
taxes |
4.755.000 |
5.431.000 |
9.279.000 |
7.063.000 |
14.992.000 |
|
Taxation
on the result of ordinary activities |
1.041.000 |
1.353.000 |
2.361.000 |
1.743.000 |
3.814.000 |
|
Result of ordinary activities after
taxes |
3.714.000 |
4.078.000 |
6.918.000 |
5.320.000 |
11.178.000 |
|
|
|||||
|
Net result |
3.714.000 |
4.078.000 |
6.918.000 |
5.320.000 |
11.178.000 |
Summary
The turnover of the company decreased by -16.69 % between 2011 and 2012.
The operating result of the company declined with -15.49 % between 2011
and 2012. This
evolution implies an decrease of the company's economic profitability.
The result of these changes is a reduction of the company's Economic
Profitability of -11.5 %
of the analysed period, being equal to 2011 % in the year 2012.
This fall has contributed to a asset turnover decrease, whose index
evolved from -15.83 to a
level of 8.72.
The Net Result of the company increased by -8.93 % between 2011 and
2012.
The company's Financial Profitability has been negatively affected by
the financial activities in
comparison to the EBITs behaviour. The result of these variations is a
profitability reduction
of -13.77 % of the analysed period, being 33.39 % in the year 2012.
The company's financial profitability has been positively affected by
its financial structure.
The turnover of the company grew with 9.44 % between 2010 and 2011.
The operating result of the company declined with -26.95 % between 2010
and 2011. This
evolution implies an decrease of the company's economic profitability.
The result of these changes is an increase of the company's Economic
Profitability of 5.59 %
of the analysed period, being equal to 2010 % in the year 2011.
This growth has contributed to the increase in assets turnover,
increasing by 97.33 %
reaching 10.36.
The Net Result of the company increased by -41.05 % between 2010 and
2011.
The company's Financial Profitability has been positively affected by
the financial activities in
comparison to the EBITs behaviour. The result of these variations is a
profitability increase of
-27.19 % of the analysed period, being 38.72 % in the year 2011.
The company's financial profitability has been positively affected by
its financial structure.
Analysis
Branch (SBI)
Wholesale trade (no motor vehicles and motorcycles) (46)
Region
Groot Rotterdam
In the Netherlands 109662 of the companies are registered with the SBI
code 46
In the region Groot Rotterdam 8969 of the companies are registered with
the SBI code 46
In the Netherlands 2387 of the bankrupcties are published within this
sector
In the region Groot Rotterdam 231 of the bankruptcies are published
within this sector
The risk of this specific sector in the Netherlands is normal
The risk of this specific sector in the region Groot Rotterdam is normal
Publications
Filings
21-02-2013: De jaarrekening over 2011 is gepubliceerd.
30-03-2012: De jaarrekening over 2010 is gepubliceerd.
15-04-2011: De jaarrekening over 2009 is gepubliceerd.
10-03-2010: De jaarrekening over 2008 is gepubliceerd.
Functions
02-07-2013: Per 01-05-2013 is bestuurder ELG Haniel GmbH Duitsland uit
functie getreden.
16-05-2013: Per 01-01-2013 is commissaris Silke Landwehrmann in functie
getreden.
16-05-2013: Per 01-01-2013 is commissaris Detlef Drafz in functie
getreden.
16-05-2013: Per 01-01-2013 is commissaris Martin von Gehren uit functie
getreden.
07-03-2012: Per 01-03-2012 is gevolmachtigde Eric Oosterom in functie
getreden.
23-02-2011: Per 07-01-2011 is gevolmachtigde Adriaan Roedolf uit functie
getreden.
23-02-2011: Per 07-01-2011 is bestuurder Adriaan Roedolf in functie
getreden.
FOREIGN EXCHANGE RATES
|
Currency |
Unit
|
Indian Rupees |
|
US Dollar |
1 |
Rs.59.03 |
|
UK Pound |
1 |
Rs.98.91 |
|
Euro |
1 |
Rs.80.33 |
INFORMATION DETAILS
|
Analysis Done by
: |
DIV |
|
|
|
|
Report Prepared
by : |
MNL |
RATING EXPLANATIONS
|
RATING |
STATUS |
PROPOSED CREDIT LINE |
|
|
>86 |
Aaa |
Possesses an extremely sound financial base with the strongest
capability for timely payment of interest and principal sums |
Unlimited |
|
71-85 |
Aa |
Possesses adequate working capital. No caution needed for credit
transaction. It has above average (strong) capability for payment of interest
and principal sums |
Large |
|
56-70 |
A |
Financial & operational base are regarded healthy. General
unfavourable factors will not cause fatal effect. Satisfactory capability for
payment of interest and principal sums |
Fairly Large |
|
41-55 |
Ba |
Overall operation is considered normal. Capable to meet normal
commitments. |
Satisfactory |
|
26-40 |
B |
Capability to overcome financial difficulties seems comparatively below
average. |
Small |
|
11-25 |
Ca |
Adverse factors are apparent. Repayment of interest and principal sums
in default or expected to be in default upon maturity |
Limited with
full security |
|
<10 |
C |
Absolute credit risk exists. Caution needed to be exercised |
Credit not
recommended |
|
-- |
NB |
New Business |
-- |
This score serves as a reference to assess SC’s credit risk
and to set the amount of credit to be extended. It is calculated from a
composite of weighted scores obtained from each of the major sections of this
report. The assessed factors and their relative weights (as indicated through
%) are as follows:
Financial
condition (40%) Ownership
background (20%) Payment
record (10%)
Credit history
(10%) Market trend
(10%) Operational
size (10%)
This report is issued at your request without any
risk and responsibility on the part of MIRA INFORM PRIVATE LIMITED (MIPL)
or its officials.