MIRA INFORM REPORT
|
Report Date : |
03.11.2014 |
IDENTIFICATION DETAILS
|
Name : |
SELL ALL CORPORATION LIMITED PARTNERSHIP |
|
|
|
|
Registered Office : |
131 Moo 12, Saraburi-Lomsak Road, T. Thapon, A. Muang, Phetchabun 67250, |
|
|
|
|
Country : |
Thailand |
|
|
|
|
Financials (as on) : |
31.12.2013 |
|
|
|
|
Date of Incorporation : |
23.09.2005 |
|
|
|
|
Com. Reg. No.: |
067354800084 |
|
|
|
|
Legal Form : |
Limited Partnership |
|
|
|
|
Line of Business : |
Subject is engaged in
wholesale distributing
fresh and dried
vegetables, shallot, ginger,
dried chili |
|
|
|
|
No. of Employees : |
04 |
RATING & COMMENTS
|
MIRA’s Rating : |
B |
|
RATING |
STATUS |
PROPOSED CREDIT LINE |
|
|
26-40 |
B |
Capability to overcome financial difficulties seems comparatively
below average. |
Small |
|
Status : |
Moderate |
|
Payment Behaviour : |
Slow but correct |
|
Litigation : |
Clear |
NOTES :
Any query related to this report can be made
on e-mail : infodept@mirainform.com
while quoting report number, name and date.
ECGC Country Risk Classification List – June 1, 2014
|
Country Name |
Previous Rating (31.03.2014) |
Current Rating (01.06.2014) |
|
Thailand |
B1 |
B1 |
|
Risk Category |
ECGC
Classification |
|
Insignificant |
A1 |
|
Low |
A2 |
|
Moderate |
B1 |
|
High |
B2 |
|
Very High |
C1 |
|
Restricted |
C2 |
|
Off-credit |
D |
THAILAND - ECONOMIC OVERVIEW
With a well-developed infrastructure,
a free-enterprise economy, generally pro-investment policies, and strong export
industries, Thailand achieved steady growth due largely to industrial and
agriculture exports - mostly electronics, agricultural commodities, automobiles
and parts, and processed foods. Unemployment, at less than 1% of the labor
force, stands as one of the lowest levels in the world, which puts upward
pressure on wages in some industries. Thailand also attracts nearly 2.5 million
migrant workers from neighboring countries. The Thai government in 2013
implemented a nation-wide 300 baht ($10) per day minimum wage policy and
deployed new tax reforms designed to lower rates on middle-income earners. The
Thai economy has weathered internal and external economic shocks in recent
years. The global economic recession severely cut Thailand's exports, with most
sectors experiencing double-digit drops. In late 2011 Thailand's recovery was
interrupted by historic flooding in the industrial areas in Bangkok and its
five surrounding provinces, crippling the manufacturing sector. The government
approved flood mitigation projects worth $11.7 billion, which were started in
2012, to prevent similar economic damage, and an additional $75 billion for
infrastructure over the following seven years. This was expected to lead to an
economic upsurge but growth has remained slow, in part due to ongoing political
unrest and resulting uncertainties. Spending on infrastructure will require
re-approval once a new government is seated
|
Source
: CIA |
Company
name
SELL ALL
CORPORATION LIMITED PARTNERSHIP
SUMMARY
BUSINESS
ADDRESS : 131
MOO 12, SARABURI-LOMSAK ROAD,
T.
THAPON, A. MUANG, PHETCHABUN
67250,
THAILAND
TELEPHONE : [66] 56
736-556
FAX :
[66] 56
736-556
E-MAIL
ADDRESS : -
REGISTRATION
ADDRESS : SAME
AS BUSINESS ADDRESS
ESTABLISHED
: 2005
REGISTRATION
NO. : 0673548000848
TAX
ID NO. : 3031958432
CAPITAL REGISTERED : BHT. 1,000,000
CAPITAL PAID-UP : BHT.
1,000,000
SHAREHOLDER’S PROPORTION : THAI : 100%
FISCAL YEAR CLOSING DATE : DECEMBER 31
LEGAL
STATUS : LIMITED
PARTNERSHIP
EXECUTIVE : MR.
PRAJERD NAKNOI, THAI
MANAGING PARTNER
NO.
OF STAFF : 4
LINES
OF BUSINESS : AGRICULTURE PRODUCTS
WHOLESALER
CORPORATE PROFILE
OPERATING
TREND : STABLE
PRESENT
SITUATION : OPERATING NORMALLY
REPUTATION : LOW
WITH NORMAL BUSINESS
ENGAGEMENT
MANAGEMENT
STANDARD : MANAGEMENT WITH
LOW PERFORMANCE
HISTORY
The
subject was established
on September 23,
2005 as a
limited partnership under the
originally registered name “Puttarn Trader
Limited Partnership”, by
Mr. Prajerd Naknoi
and Mr. Earb Naknoi,
who are the
Thai partners.
On
February 26, 2014,
its registered name
was changed to
SELL ALL CORPORATION
LIMITED PARTNERSHIP. Its
business objective is
a wholesale distributor
various kinds of agriculture products.
It currently employs
4 staff.
The
subject’s registered address
is 131 Moo
12, Saraburi-Lomsak Road,
T. Thapon,
A. Muang,
Phetchabun 67250, and
this is the
subject’s current operation
address.
AUTHORIZED PERSON
Mr. Prajerd Naknoi signs
on behalf of
the subject with
seal affixed.
MANAGEMENT
Mr. Prajerd Naknoi
is the Managing
Partner.
He is Thai
nationality with the
age of 44 years
old.
BUSINESS OPERATIONS
The subject is engaged
in wholesale distributing fresh
and dried vegetables,
shallot, ginger, dried
chili and etc.
PURCHASE
100%
of the products
is purchased from
local planters and
suppliers.
SALES
The
product are sold
locally by wholesale
to traders, processed
food manufacturers and
end-users.
LITIGATION
Bankruptcy and Receivership
There are no
litigation on bankruptcy
and receivership cases
filed against the subject found
at Legal Execution
Department for the
past five years.
Others
There are no
legal suits filed
against the subject
for the past
two years.
CREDIT
Sales are by
cash or on
the credit term
of 30-60 days.
Local bills are
paid by cash
or on the
credits term of
30-60 days.
BANKING
Bangkok
Bank Public Co.,
Ltd.
EMPLOYMENT
The
subject currently employs
4 staff.
LOCATION
DETAILS
The
premise is owned
for administrative office
at the heading
address. Premise is
located
in provincial.
COMMENT
The
subject was established
in 2005. Since
establishment the subject
has slowed business.
It reported low income
in the past
three years. It
is believed that
growth
and
expansion would be
contracted. Any business
engagement should be on secured
basis
only.
FINANCIAL
INFORMATION
The
capital was registered
at Bht. 1,000,000 which
was carried by 2
persons as followed:
Name Age Amount
Mr. Prajerd Naknoi 44 Bht. 800,000
[unlimited partner]
Address: 131 Moo 12,
Saraburi-Lomsak Road,
T. Thapon, A. Muang,
Phetchabun 67250
Mr. Earb Naknoi 72 Bht. 200,000
Address: 131 Moo 12,
Saraburi-Lomsak Road,
T. Thapon, A. Muang,
Phetchabun 67250
NAME OF AUDITOR
& CERTIFIED PUBLIC
ACCOUNTANT NO. :
N/A
BALANCE
SHEET [BAHT]
The latest financial figures published
as at December
31, 2013, 2012
& 2011 were:
ASSETS
|
Current Assets |
2013 |
2012 |
2011 |
|
|
|
|
|
|
Cash and Cash Equivalents |
310,302.40 |
1,748,342.22 |
1,799,897.22 |
|
Inventories |
- |
44,620.00 |
44,620.00 |
|
Other Current Assets
|
|
|
4,205.26 |
|
|
|
|
|
|
Total Current Assets
|
310,302.40 |
1,792,962.22 |
1,848,722.48 |
|
|
|
|
|
|
Fixed Assets |
10,966.66 |
16,367.30 |
23,696.34 |
|
Total Assets |
321,269.06 |
1,809,329.52 |
1,872,418.82 |
LIABILITIES &
SHAREHOLDERS’ EQUITY [BAHT]
|
Current
Liabilities |
2013 |
2012 |
2011 |
|
|
|
|
|
|
Other Current Liabilities |
9,698.96 |
8,000.00 |
55,760.49 |
|
|
|
|
|
|
Total Current Liabilities |
9,698.96 |
8,000.00 |
55,760.49 |
|
Bank Overdraft |
- |
833,558.90 |
833,558.90 |
|
Loans for Export |
- |
600,000.00 |
600,000.00 |
|
Cash at Bank
pledged as a
Collateral |
- |
160,000.00 |
160,000.00 |
|
Total Liabilities |
9,698.96 |
1,601,558.90 |
1,649,319.39 |
|
|
|
|
|
|
Shareholders' Equity |
|
|
|
|
|
|
|
|
|
Capital Paid |
1,000,000.00 |
1,000,000.00 |
1,000,000.00 |
|
Retained Earning Unappropriated |
[688,429.90] |
[792,229.38] |
[776,900.57] |
|
Total Shareholders' Equity |
311,570.10 |
207,770.62 |
223,099.43 |
|
Total Liabilities & Shareholders' Equity |
321,269.06 |
1,809,329.52 |
1,872,418.82 |
PROFIT &
LOSS ACCOUNT
|
Revenue |
2013 |
2012 |
2011 |
|
|
|
|
|
|
Sales & Services Income |
1,074,715.78 |
- |
1,729,016.53 |
|
Other Income |
- |
0.23 |
525.84 |
|
Total Revenues |
1,074,715.78 |
0.23 |
1,729,542.37 |
|
Expenses |
|
|
|
|
|
|
|
|
|
Cost of Exports |
952,209.40 |
- |
1,234,044.00 |
|
Administrative Expenses |
18,706.90 |
15,329.04 |
330,114.10 |
|
Total Expenses |
970,916.30 |
15,329.04 |
1,564,158.10 |
|
Profit / [Loss] before Income
Tax |
103,799.48 |
[15,328.81] |
165,384.27 |
|
Income Tax |
- |
- |
[5,760.49] |
|
|
|
|
|
|
Net Profit / [Loss] |
103,799.48 |
[15,328.81] |
159,623.78 |
FINANCIAL
ANALYSIS
|
ITEM |
UNIT |
2013 |
2012 |
2011 |
|
|
|
|
|
|
|
LIQUIDITY RATIO |
|
|
|
|
|
CURRENT RATIO |
TIMES |
31.99 |
224.12 |
33.15 |
|
QUICK RATIO |
TIMES |
31.99 |
218.54 |
32.28 |
|
|
|
|
|
|
|
ACTIVITY RATIO |
|
|
|
|
|
FIXED ASSETS TURNOVER |
TIMES |
98.00 |
- |
72.97 |
|
TOTAL ASSETS TURNOVER |
TIMES |
3.35 |
- |
0.92 |
|
INVENTORY CONVERSION PERIOD |
DAYS |
- |
- |
13.20 |
|
INVENTORY TURNOVER |
TIMES |
- |
- |
27.66 |
|
RECEIVABLES CONVERSION PERIOD |
DAYS |
- |
- |
- |
|
RECEIVABLES TURNOVER |
TIMES |
- |
- |
- |
|
PAYABLES CONVERSION PERIOD |
DAYS |
- |
- |
- |
|
CASH CONVERSION CYCLE |
DAYS |
- |
- |
13.20 |
|
|
|
|
|
|
|
PROFITABILITY
RATIO |
|
|
|
|
|
COST OF GOODS SOLD |
% |
88.60 |
- |
71.37 |
|
SELLING & ADMINISTRATION |
% |
1.74 |
- |
19.09 |
|
INTEREST |
% |
- |
- |
- |
|
GROSS PROFIT MARGIN |
% |
11.40 |
- |
28.66 |
|
NET PROFIT MARGIN BEFORE EX. ITEM |
% |
9.66 |
- |
9.57 |
|
NET PROFIT MARGIN |
% |
9.66 |
- |
9.23 |
|
RETURN ON EQUITY |
% |
33.31 |
(7.38) |
71.55 |
|
RETURN ON ASSET |
% |
32.31 |
(0.85) |
8.53 |
|
EARNING PER SHARE |
BAHT |
10.38 |
(1.53) |
15.96 |
|
|
|
|
|
|
|
LEVERAGE RATIO |
|
|
|
|
|
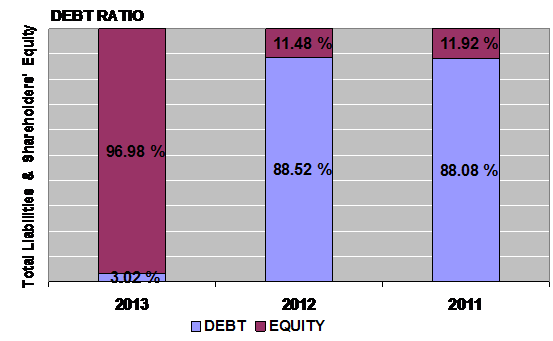
DEBT RATIO |
TIMES |
0.03 |
0.89 |
0.88 |
|
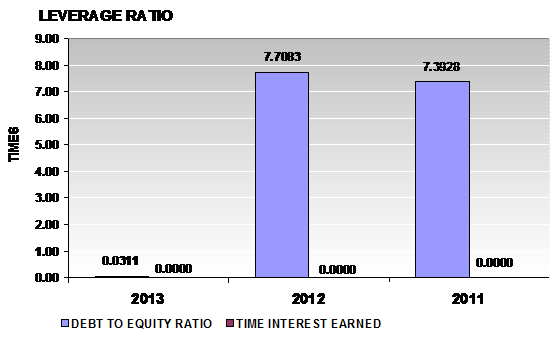
DEBT TO EQUITY RATIO |
TIMES |
0.03 |
7.71 |
7.39 |
|
TIME INTEREST EARNED |
TIMES |
- |
- |
- |
|
|
|
|
|
|
|
ANNUAL GROWTH |
|
|
|
|
|
SALES GROWTH |
% |
- |
(100.00) |
|
|
OPERATING PROFIT |
% |
(777.15) |
(109.27) |
|
|
NET PROFIT |
% |
777.15 |
(109.60) |
|
|
FIXED ASSETS |
% |
(33.00) |
(30.93) |
|
|
TOTAL ASSETS |
% |
(82.24) |
(3.37) |
|
ANNUAL GROWTH : RISKY
While net profit had increased from THB
PROFITABILITY :
IMPRESSIVE

PROFITABILITY
RATIO
|
Gross Profit Margin |
11.40 |
Acceptable |
Industrial
Average |
18.12 |
|
Net Profit Margin |
9.66 |
Impressive |
Industrial
Average |
0.77 |
|
Return on Assets |
32.31 |
Impressive |
Industrial
Average |
2.43 |
|
Return on Equity |
33.31 |
Impressive |
Industrial
Average |
5.90 |
Gross Profit Margin used to assess a firm's financial health by revealing
the proportion of money left over from revenues after accounting for the cost
of goods sold. Gross profit margin serves as the source for paying additional
expenses and future savings. The company's figure is 11.4%. When compared with
the industry average, the ratio of the company was lower. This indicated that
company may have problems with control over its costs.
Net Profit Margin is the indicator of the company's efficiency in that
net profit takes into consideration all expenses of the company. A low profit
margin indicates a low margin of safety, higher risk that a decline in sales
will erase profits and result in a net loss. The company's figure is 9.66% compared with those of its average
competitors in the same industry, indicated that business was an efficient
operator in a dominant position within
its industry.
Return on Assets measures how efficiently profits are being generated
from the assets employed in the business when compared with the ratios of firms
in a similar business. A low ratio in comparison with industry averages
indicates an inefficient use of business assets. Return on Assets ratio is
32.31%, higher figure when compared with those of its average competitors in
the same industry, indicated that business was an efficient profits in a
dominant position within its industry.
Return on Equity indicates how profitable a company is by comparing its
net income to its average shareholders' equity, ROE measures how much the
shareholders earned for their investment in the company. Return on Equity ratio
is 33.31%, higher figure when compared with those of its average competitors in
the same industry, indicated that business was an efficient profit in a dominant position within its industry.
Trend of the average
competitors in the same industry for last 5 years
Return on Assets Downtrend
Return on Equity Downtrend
LIQUIDITY :
SATISFACTORY

LIQUIDITY RATIO
|
Current Ratio |
31.99 |
Impressive |
Industrial
Average |
1.69 |
|
Quick Ratio |
31.99 |
|
|
|
|
Cash Conversion Cycle |
- |
|
|
|
The Current Ratio is to ascertain whether a company's short-term assets are
readily available to pay off its short-term liabilities. The company's figure
is 31.99 times in 2013, decreased from 224.12 times, then it is generally
considered to have good short-term financial strength. When compared with the
industry average, the ratio of the company was higher, indicated that company
was an efficient operator in a dominant position within its industry.
The Quick Ratio is a liquidity indicator that further refines the
current ratio by measuring the amount of the most liquid current assets there
are to cover current liabilities. The company's figure is 31.99 times in 2013,
decreased from 218.54 times, although
excluding inventory so the company still have good short-term financial
strength.
Trend of the
average competitors in the same industry for last 5 years
Current Ratio Uptrend
LEVERAGE :
EXCELLENT
LEVERAGE RATIO
|
Debt Ratio |
0.03 |
Impressive |
Industrial
Average |
0.52 |
|
Debt to Equity Ratio |
0.03 |
Impressive |
Industrial
Average |
1.09 |
|
Times Interest Earned |
- |
|
Industrial
Average |
- |
Debt to Equity Ratio a measurement of how much suppliers, lenders,
creditors and obligors have committed to the company versus what the shareholders
have committed. A lower the percentage means that the company is using less
leverage and has a stronger equity position.
Debt Ratio shows the proportion of a company's assets which are financed
through debt. The company's figure is 0.03 less than 0.5, most of the company's
assets are financed through equity.
Trend of the
average competitors in the same industry for last 5 years
Debt Ratio Downtrend
Times Interest Earned Stable
ACTIVITY :
EXCELLENT

ACTIVITY RATIO
|
Fixed Assets Turnover |
98.00 |
Impressive |
Industrial
Average |
- |
|
Total Assets Turnover |
3.35 |
Impressive |
Industrial
Average |
3.14 |
|
Inventory Conversion Period |
- |
|
|
|
|
Inventory Turnover |
- |
|
Industrial
Average |
9.46 |
|
Receivables Conversion Period |
- |
|
|
|
|
Receivables Turnover |
- |
|
Industrial
Average |
5.94 |
|
Payables Conversion Period |
- |
|
|
|
The company's Total Asset Turnover is calculated as 3.35 times and 0
times in 2013 and 2012 respectively. This ratio is determined by dividing total
assets into total sales turnover. The ratio measures the activity of the assets
and the ability of the firm to generate sales through the use of the assets.
Trend of the
average competitors in the same industry for last 5 years
Fixed Assets Turnover Stable
Total Assets Turnover Uptrend
Inventory Turnover Downtrend
Receivables Turnover Uptrend
FOREIGN EXCHANGE RATES
|
Currency |
Unit
|
Indian Rupees |
|
US Dollar |
1 |
Rs.61.41 |
|
|
1 |
Rs.98.06 |
|
Euro |
1 |
Rs.77.19 |
INFORMATION DETAILS
|
Analysis Done by
: |
KAR |
|
|
|
|
Report Prepared
by : |
NIS |
RATING EXPLANATIONS
|
RATING |
STATUS |
PROPOSED CREDIT LINE |
|
|
|
>86 |
Aaa |
Possesses an extremely sound financial base with the strongest
capability for timely payment of interest and principal sums |
Unlimited |
|
|
71-85 |
Aa |
Possesses adequate working capital. No caution needed for credit
transaction. It has above average (strong) capability for payment of interest
and principal sums |
Large |
|
|
56-70 |
A |
Financial & operational base are regarded healthy. General unfavourable
factors will not cause fatal effect. Satisfactory capability for payment of
interest and principal sums |
Fairly Large |
|
|
41-55 |
Ba |
Overall operation is considered normal. Capable to meet normal
commitments. |
Satisfactory |
|
|
26-40 |
B |
Capability to
overcome financial difficulties seems comparatively below average. |
Small |
|
|
11-25 |
Ca |
Adverse factors are apparent. Repayment of interest and principal sums
in default or expected to be in default upon maturity |
Limited with full
security |
|
|
<10 |
C |
Absolute credit risk exists. Caution needed to be exercised |
Credit not
recommended |
|
|
-- |
NB |
New Business |
-- |
|
This score serves as a reference to assess SC’s
credit risk and to set the amount of credit to be extended. It is calculated
from a composite of weighted scores obtained from each of the major sections of
this report. The assessed factors and their relative weights (as indicated
through %) are as follows:
Financial
condition (40%) Ownership
background (20%) Payment
record (10%)
Credit history
(10%) Market trend (10%) Operational size
(10%)
This report is issued at your request without any
risk and responsibility on the part of MIRA INFORM PRIVATE LIMITED (MIPL) or
its officials.