MIRA INFORM REPORT
|
Report Date : |
22.10.2014 |
IDENTIFICATION DETAILS
|
Name : |
ABB INDIA LIMITED (w.e.f. 14.06.2013) |
|
|
|
|
Formerly Known
As : |
ABB LIMITED |
|
|
|
|
Registered
Office : |
2nd Floor, East Wing Khanija Bhawan, 49, Race Course
Road, Bangalore – 560001, Karnataka |
|
|
|
|
Country : |
|
|
|
|
|
Financials (as
on) : |
31.12.2013 |
|
|
|
|
Date of
Incorporation : |
24.12.1949 |
|
|
|
|
Com. Reg. No.: |
08-032923 |
|
|
|
|
Capital
Investment / Paid-up Capital : |
Rs.423.800 Millions |
|
|
|
|
CIN No.: [Company Identification
No.] |
L32202KA1949PLC032923 |
|
|
|
|
TAN No.: [Tax Deduction &
Collection Account No.] |
MUMA19181B |
|
|
|
|
PAN No.: [Permanent Account No.] |
AAACA3834B |
|
|
|
|
Legal Form : |
A Public Limited Liability Company. The Company’s Shares are Listed on
the Stock Exchanges. |
|
|
|
|
Line of Business
: |
Manufacturing of Instrument and Electric Motor. |
|
|
|
|
No. of Employees
: |
6371 (Approximately) |
RATING & COMMENTS
|
MIRA’s Rating : |
Aa (75) |
|
RATING |
STATUS |
PROPOSED CREDIT LINE |
|
|
71-85 |
Aa |
Possesses adequate working capital. No caution needed for credit
transaction. It has above average (strong) capability for payment of interest
and principal sums |
Large |
|
Status : |
Good |
|
|
|
|
Payment Behaviour : |
Regular |
|
|
|
|
Litigation : |
Exist |
|
|
|
|
Comments : |
Subject is a well-established company having fine track record. The rating reflects company’s established market position in the power
and automation technology segment marked by healthy financial risk, adequate
liquidity position and decent capital structure of the company. Trade relations are reported as fair. Business is active. Payments are
reported to be regular and as per commitments. The company can be considered good for normal business dealings at
usual trade terms and conditions. |
NOTES :
Any query related to this report can be made
on e-mail : infodept@mirainform.com
while quoting report number, name and date.
ECGC Country Risk Classification List – June 1, 2014
|
Country Name |
Previous Rating (31.03.2014) |
Current Rating (01.06.2014) |
|
India |
A1 |
A1 |
|
Risk Category |
ECGC
Classification |
|
Insignificant |
A1 |
|
Low |
A2 |
|
Moderate |
B1 |
|
High |
B2 |
|
Very High |
C1 |
|
Restricted |
C2 |
|
Off-credit |
D |
INDIAN ECONOMIC OVERVIEW
N E W S
Verdict Implications
: Apex court order may alter coal import dynamics. Traders go slow on talks over
coal supply contracts, uncertainty over cancellation of blocks weigh on stocks.
Recent arrest of the
Chennai head of the Registrar of Companies, the ministry of corporate affairs
arm that ensures that companies file all the information required by the
Companies Act is the latest manifestation of a messy fight between a father and
his adopted son for the control of Rs 40000 mn business empire. The Central
Bureau of Investigation arrested Manumeethi Cholan after he accepted Rs 10
lakhs as bribe from M A M Ramaswamy, a CBI official said.
Central Bureau of
Investigation books Electrotherm for cheating Central Bank of Rs 4360 mn.
Infosys maintains
revenue guidance. COO Rao says attrition still an area of concern and it would
take a few more quarters to bring down levels to 13-15 %.
DHL to invest
Euro 100 mn in India over next 2 years. The firm has chosen India to pilot its
e-commerce business model for the Asia-Pacific region.
Blackstone may buy
stake in BlueRidge SEZ in line with the fund’s real estate strategy in India.
Kingfisher Airlines
Ltd grounded in October 2012 under the weight of heavy debt and accumulated
losses, recently approached the Delhi high court for relief in two separate
cases. The airline challenged a notice by Punjab & National Bank alleging
that It had wilfully defaulted on Rs 7700 mn of loans and sought more time to
comply with the requirements under the listing agreements with the Stock
Exchanges.
OnMobile likely to
sack another 300 employees. The lay-offs follow a spate of senior-level exits
over the past two years, starting with of its founder. The overall lay-offs
could number around 600 and are driven by the need to cut costs, says a former
employee.
EXTERNAL AGENCY RATING
|
Rating Agency Name |
CRISIL |
|
Rating |
Long-term rating AAA |
|
Rating Explanation |
Highest degree of safety. It carry lowest
credit risk. |
|
Date |
01.07.2014 |
|
Rating Agency Name |
CRISIL |
|
Rating |
Short-term rating A1+ |
|
Rating Explanation |
Very strong degree of safety. It carry
lowest credit risk. |
|
Date |
01.07.2014 |
RBI DEFAULTERS’ LIST STATUS
Subject’s name is not enlisted as a defaulter
in the publicly available RBI Defaulters’ list.
EPF (Employee Provident Fund) DEFAULTERS’ LIST STATUS
Subject’s name is not enlisted as a defaulter
in the publicly available EPF (Employee Provident Fund) Defaulters’ list as of
31-03-2014.
INFORMATION DECLINED BY
Management Non Cooperative (91-22-66159859)
LOCATIONS
|
Registered Office : |
2nd Floor, East Wing Khanija Bhawan, 49, Race Course Road, Bangalore – 560001, Karnataka, India |
|
Tel. No.: |
91-80-22949150/ 54 |
|
Fax No.: |
91-80-22949148 |
|
E-Mail : |
|
|
Website : |
|
|
Location: |
Owned |
|
|
|
|
Marketing Office: |
ABB House, Dr. S B Path, Old Goa Street, Ballard Estate, Mumbai – 400025, Maharashtra, India |
|
Tel No.: |
91-22-66159800 |
|
|
|
|
Factory 1 : |
32, Industrial Area, NIT, Faridabad-121001, Haryana, India |
|
Tel No.: |
91-129-2448100 |
|
|
|
|
Factory 2 : |
Menaja Village, Vadodara - 390013, Gujarat, India |
|
|
|
|
Factory 3 : |
485/6,14th Cross, 4th Phase, Peenya Industrial Area,
Bangalore – 560058, Karnataka, India |
|
Tel. No.: |
91-80 2294 9449 |
|
|
|
|
Factory 4 : |
Plot No.79, Street No.17, MIDC Satpur, Nashik – 422007, Maharashtra,
India |
|
|
|
|
Factory 5 : |
A1 and A2, III Stage, Peenya Industrial Area, Bangalore – 560058,
Karnataka, India |
|
|
|
|
Factory 6 : |
88/3 – 88/6, Basavanahalli Village, Kasaba, Bangalore North, Nelamangala – 562123, Karnataka, India |
|
|
|
|
Factory 7 : |
Also Located At:
|
DIRECTORS
As on 31.12.2013
|
Name : |
Mr. Gary Steel |
|
Designation : |
Chairman |
|
|
|
|
Name : |
Mr. Bazmi R. Husain |
|
Designation : |
Managing Director |
|
|
|
|
Name : |
Mr. N. S. Raghavan |
|
Designation : |
Director |
|
|
|
|
Name : |
Mr. Nasser Munjee |
|
Designation : |
Director |
|
|
|
|
Name : |
Mr. Darius E Udwadia |
|
Designation : |
Director |
|
|
|
|
Name : |
Mr. Arun Kanti Dasgupta |
|
Designation : |
Director |
|
|
|
|
Name : |
Mr. Peter Leupp |
|
Designation : |
Director |
|
|
|
|
Name : |
Mr. Francis
Duggan |
|
Designation : |
Director |
|
|
|
|
Name : |
Mr. Renu Sud Karnad |
|
Designation : |
Director |
KEY EXECUTIVES
|
Name : |
Mr. B. Gururaj |
|
Designation : |
Company Secretary
|
|
|
|
|
Audit Committee |
|
|
|
|
|
Shareholders’ /
Investors’ Grievance Committee |
|
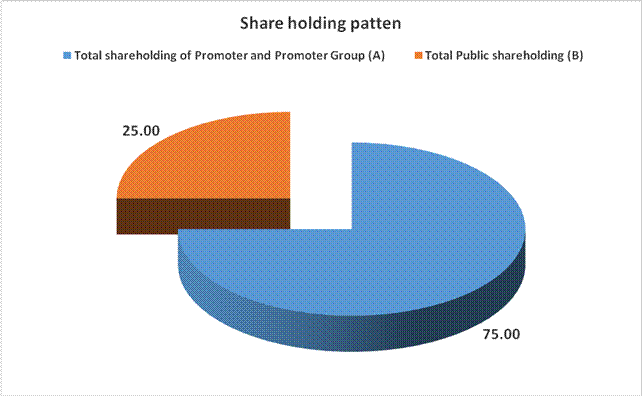
MAJOR SHAREHOLDERS / SHAREHOLDING PATTERN
As on 30.06.2014
|
Category of
Shareholder |
No.
of Shares |
Percentage
of Holding |
|
(A) Shareholding of Promoter
and Promoter Group |
|
|
|
|
|
|
|
|
|
|
|
|
158931281 |
75.00 |
|
|
158931281 |
75.00 |
|
Total shareholding of Promoter
and Promoter Group (A) |
158931281 |
75.00 |
|
(B) Public Shareholding |
|
|
|
|
|
|
|
|
2936625 |
1.39 |
|
|
22632219 |
10.68 |
|
|
10094271 |
4.76 |
|
|
35663115 |
16.83 |
|
|
|
|
|
|
1136809 |
0.54 |
|
|
|
|
|
|
15580879 |
7.35 |
|
|
194000 |
0.09 |
|
|
402291 |
0.19 |
|
|
297721 |
0.14 |
|
|
23656 |
0.01 |
|
|
80914 |
0.04 |
|
|
17313979 |
8.17 |
|
Total Public shareholding (B) |
52977094 |
25.00 |
|
Total (A)+(B) |
211908375 |
100.00 |
|
(C) Shares held by Custodians
and against which Depository Receipts have been issued |
0 |
0.00 |
|
|
0 |
0.00 |
|
|
0 |
0.00 |
|
|
0 |
0.00 |
|
Total (A)+(B)+(C) |
211908375 |
0.00 |
BUSINESS DETAILS
|
Line of Business : |
Manufacturing of Instrument and Electric Motor. |
GENERAL INFORMATION
|
No. of Employees : |
6371 (Approximately) |
|
|
|
|
Bankers : |
|
|
|
|
|
Banking Relations
: |
--- |
|
|
|
|
Auditors : |
|
|
Name : |
S. R. Batliboi and Company Chartered Accountant |
|
|
|
|
Cost Auditors: |
|
|
Name : |
Ashwin Solanki and Associates Cost Accountants |
|
|
|
|
Ultimate Holding
Company |
ABB Limited, Zurich, Switzerland |
|
|
|
|
Holding Company : |
ABB Asea Brown Boveri Limited, Zurich, Switzerland |
|
|
|
|
Subsidiary : |
Baldor Electric India Private Limited., Pune, India (from December 1, 2011 till March 31, 2012.) |
|
|
|
|
Fellow subsidiaries: |
|
CAPITAL STRUCTURE
As on 31.12.2013
Authorised Capital :
|
No. of Shares |
Type |
Value |
Amount |
|
|
|
|
|
|
212500000 |
Equity Shares |
Rs.2/- each |
Rs.425.000 Millions |
|
750000 |
11% Redeemable Cumulative Preferences Shares |
Rs.100/- each |
Rs.75.000 Millions |
|
|
Total |
|
Rs.500.000
Millions |
Issued, Subscribed & Paid-up Capital :
|
No. of Shares |
Type |
Value |
Amount |
|
|
|
|
|
|
211908375 |
Equity Shares |
Rs.2/- each |
Rs.423.800
Millions |
|
|
|
|
|
a) Terms/rights attached
to equity shares
The Company has only one class of equity shares having a par value of Rs 2/- per share. Each holder of equity shares is entitled to one vote per share. The Company declares and pay dividends in Indian Rupees. The dividend proposed by the Board of Directors is subject to the approval of the shareholders in the ensuing Annual General Meeting.
During the year ended December 31, 2013, the amount of per share dividend recommended and provided for distribution to equity shareholders is Rs 3.00 (December 31, 2012 : Rs 3.00)
In the event of liquidation of the Company, the holders of equity shares will be entitled to receive remaining assets of the Company, after distribution of all preferential amounts. The distribution will be in proportion to the number of equity shares held by the shareholders.
b) Shares held by
holding / ultimate holding company and / or their subsidiaries / associates
|
Name of
Shareholder |
Number
of Shares |
Rs. In Millions |
|
ABB Asea Brown Boveri Limited - the holding company |
146390952 |
292.800 |
|
ABB Norden Holding AB - a fellow subsidiary |
12540330 |
25.100 |
c) Details of equity shares held by shareholders holding more than 5%
shares:
|
Name of
Shareholder |
Number
of Shares |
% of Holding |
|
ABB Asea Brown Boveri Limited - the holding company |
146390952 |
69.08% |
|
ABB Norden Holding AB - a fellow subsidiary |
12540330 |
5.92% |
|
Life Insurance Corporation of India |
20196092 |
9.53% |
As per of the Company and other declarations received from shareholders, the above shareholding represents both legal and beneficial ownerships of shares.
FINANCIAL DATA
[all figures are
in Rupees Millions]
ABRIDGED BALANCE
SHEET
|
SOURCES OF FUNDS |
31.12.2013 |
31.12.2012 |
31.12.2011 |
|
I.
EQUITY
AND LIABILITIES |
|
|
|
|
(1)Shareholders' Funds |
|
|
|
|
(a) Share Capital |
423.800 |
423.800 |
423.800 |
|
(b) Reserves & Surplus |
26351.800 |
25556.700 |
24921.400 |
|
(c) Money
received against share warrants |
0.000 |
0.000 |
0.000 |
|
|
|
|
|
|
(2) Share Application money pending
allotment |
0.000 |
0.000 |
0.000 |
|
Total
Shareholders’ Funds (1) + (2) |
26775.600 |
25980.500 |
25345.200 |
|
|
|
|
|
|
(3)
Non-Current Liabilities |
|
|
|
|
(a) long-term borrowings |
0.000 |
0.000 |
0.000 |
|
(b) Deferred tax liabilities (Net) |
0.000 |
0.000 |
0.000 |
|
(c) Other long term
liabilities |
41.700 |
38.900 |
33.000 |
|
(d) long-term
provisions |
57.100 |
57.100 |
57.100 |
|
Total Non-current
Liabilities (3) |
98.800 |
96.000 |
90.100 |
|
|
|
|
|
|
(4)
Current Liabilities |
|
|
|
|
(a) Short
term borrowings |
6201.100 |
3276.800 |
0.000 |
|
(b) Trade
payables |
20825.800 |
18993.700 |
19654.100 |
|
(c) Other
current liabilities |
13959.500 |
13945.600 |
15582.700 |
|
(d) Short-term
provisions |
2634.500 |
2407.400 |
2273.500 |
|
Total Current
Liabilities (4) |
43620.900 |
38623.500 |
37510.300 |
|
|
|
|
|
|
TOTAL |
70495.300 |
64700.000 |
62945.600 |
|
|
|
|
|
|
II.
ASSETS |
|
|
|
|
(1)
Non-current assets |
|
|
|
|
(a) Fixed
Assets |
|
|
|
|
(i)
Tangible assets |
12680.200 |
10780.600 |
10302.400 |
|
(ii)
Intangible Assets |
1234.900 |
1292.800 |
1381.600 |
|
(iii) Capital
work-in-progress |
474.900 |
1170.100 |
744.300 |
|
(iv)
Intangible assets under development |
0.000 |
0.000 |
0.000 |
|
(b) Non-current Investments |
164.700 |
523.900 |
506.200 |
|
(c) Deferred tax assets (net) |
279.300 |
148.000 |
224.000 |
|
(d) Long-term Loan and Advances |
3508.900 |
2301.800 |
1638.900 |
|
(e) Other
Non-current assets |
83.000 |
84.500 |
84.900 |
|
Total Non-Current
Assets |
18425.900 |
16301.700 |
14882.300 |
|
|
|
|
|
|
(2)
Current assets |
|
|
|
|
(a) Current
investments |
0.800 |
0.800 |
0.800 |
|
(b)
Inventories |
9888.500 |
9204.000 |
9255.500 |
|
(c) Trade
receivables |
32357.200 |
32643.800 |
30825.100 |
|
(d) Cash
and cash equivalents |
3165.800 |
766.700 |
2558.800 |
|
(e) Short-term
loans and advances |
2567.700 |
2283.000 |
1999.700 |
|
(f) Other
current assets |
4089.400 |
3500.000 |
3423.400 |
|
Total
Current Assets |
52069.400 |
48398.300 |
48063.300 |
|
|
|
|
|
|
TOTAL |
70495.300 |
64700.000 |
62945.600 |
PROFIT & LOSS
ACCOUNT
|
|
PARTICULARS |
31.12.2013 |
31.12.2012 |
31.12.2011 |
|
|
|
SALES |
|
|
|
|
|
|
|
Income |
77219.900 |
75649.900 |
74489.700 |
|
|
|
Other Income |
69.900 |
70.500 |
414.600 |
|
|
|
TOTAL (A) |
77289.800 |
75720.400 |
74904.300 |
|
|
|
|
|
|
|
|
Less |
EXPENSES |
|
|
|
|
|
|
|
Cost of Materials Consumed |
46291.900 |
46856.800 |
47250.800 |
|
|
|
Purchases of Stock-in-Trade |
3140.700 |
2635.000 |
3201.600 |
|
|
|
Changes in inventories of finished
goods, work-in-progress and Stock-in-Trade |
(129.800) |
(6.900) |
(845.300) |
|
|
|
Subcontracting charges |
4682.000 |
4793.400 |
4346.700 |
|
|
|
Employees benefits expense |
6770.600 |
6196.000 |
5868.200 |
|
|
|
Other expenses |
11765.300 |
11810.700 |
11302.600 |
|
|
|
TOTAL (B) |
72520.700 |
72285.000 |
71124.600 |
|
|
|
|
|
|
|
|
Less |
PROFIT
BEFORE INTEREST, TAX, DEPRECIATION AND AMORTISATION (A-B) (C) |
4769.100 |
3435.400 |
3779.700 |
|
|
|
|
|
|
|
|
|
Less |
FINANCIAL EXPENSES (D) |
1011.300 |
432.400 |
306.800 |
|
|
|
|
|
|
|
|
|
|
PROFIT
BEFORE TAX, DEPRECIATION AND AMORTISATION (C-D) (E) |
3757.800 |
3003.000 |
3472.900 |
|
|
|
|
|
|
|
|
|
Less/ Add |
DEPRECIATION/
AMORTISATION (F) |
1033.100 |
940.900 |
795.500 |
|
|
|
|
|
|
|
|
|
|
PROFIT BEFORE
TAX (E-F) (G) |
2724.700 |
2062.100 |
2677.400 |
|
|
|
|
|
|
|
|
|
Less |
TAX (H) |
955.800 |
688.000 |
832.000 |
|
|
|
|
|
|
|
|
|
|
PROFIT AFTER TAX
(G-H) (I) |
1768.900 |
1374.100 |
1845.400 |
|
|
|
|
|
|
|
|
|
|
Profit of Baldor Electric India Private Limited (Baldor)
for the period April 1, 2012 to December 31, 2012 of the previous year on
amalgamation |
24.200 |
0.000 |
0.000 |
|
|
|
|
|
|
|
|
|
Add |
PREVIOUS
YEARS’ BALANCE BROUGHT FORWARD |
850.400 |
855.100 |
546.900 |
|
|
|
|
|
|
|
|
|
Less |
APPROPRIATIONS |
|
|
|
|
|
|
|
Transfer to General Reserve |
1000.000 |
640.000 |
800.000 |
|
|
|
Proposed Dividend |
635.700 |
635.700 |
635.700 |
|
|
|
Corporate Dividend Tax |
108.100 |
103.100 |
103.100 |
|
|
|
Corporate Dividend Tax (previous years) |
4.900 |
0.000 |
(1.600) |
|
|
BALANCE CARRIED
TO THE B/S |
894.800 |
850.400 |
855.100 |
|
|
|
|
|
|
|
|
|
|
EARNINGS IN
FOREIGN CURRENCY |
|
|
|
|
|
|
|
Export of goods on FOB basis |
9393.600 |
8706.700 |
8237.400 |
|
|
|
Goods supplied/ services rendered locally against foreign exchange
remittances |
1081.900 |
559.600 |
2034.200 |
|
|
|
Erection and other services |
838.400 |
717.600 |
532.200 |
|
|
|
Commission |
41.500 |
41.600 |
36.600 |
|
|
|
Services charges and others |
454.100 |
430.80 |
329.400 |
|
|
TOTAL EARNINGS |
11809.500 |
10456.300 |
11169.800 |
|
|
|
|
|
|
|
|
|
|
IMPORTS |
|
|
|
|
|
|
|
Raw Materials |
1963.900 |
2006.000 |
1649.100 |
|
|
|
Stores & Spares |
12750.600 |
11433.200 |
12171.400 |
|
|
|
Finished Goods |
976.600 |
1578.500 |
1942.300 |
|
|
|
Capital Goods |
499.000 |
380.300 |
514.100 |
|
|
|
Project Item |
3586.700 |
4040.100 |
5824.100 |
|
|
TOTAL IMPORTS |
19776.800 |
19438.100 |
22101.000 |
|
|
|
|
|
|
|
|
|
|
Earnings Per
Share (Rs.) |
8.46 |
6.48 |
8.71 |
|
QUARTERLY RESULTS
|
PARTICULARS |
|
31.03.2014 |
30.06.2014 |
|
|
|
1st
Quarter |
2nd
Quarter |
|
Net Sales |
|
18277.100 |
1,8221.800 |
|
Total Expenditure |
|
17019.900 |
1,6963.700 |
|
PBIDT (Excl OI) |
|
1257.200 |
1258.100 |
|
Other Income |
|
11.300 |
04.100 |
|
Operating Profit |
|
1268.500 |
1262.200 |
|
Interest |
|
220.700 |
253.600 |
|
Exceptional Items |
|
0.000 |
0.000 |
|
PBDT |
|
1047.800 |
1008.600 |
|
Depreciation |
|
274.100 |
278.600 |
|
Profit Before Tax |
|
773.700 |
730.000 |
|
Tax |
|
256.900 |
253.100 |
|
Provisions and contingencies |
|
0.000 |
0.000 |
|
Profit After Tax |
|
516.800 |
476.900 |
|
Extraordinary Items |
|
0.000 |
0.000 |
|
Prior Period Expenses |
|
0.000 |
0.000 |
|
Other Adjustments |
|
0.000 |
0.000 |
|
Net Profit |
|
516.800 |
476.900 |
KEY RATIOS
|
PARTICULARS |
|
31.12.2013 |
31.12.2012 |
31.12.2011 |
|
PAT / Total Income |
(%) |
2.29 |
1.81 |
2.46 |
|
|
|
|
|
|
|
Net Profit Margin (PBT/Sales) |
(%) |
3.53 |
2.73 |
3.59 |
|
|
|
|
|
|
|
Return on Total Assets (PBT/Total Assets} |
(%) |
3.92 |
3.28 |
4.36 |
|
|
|
|
|
|
|
Return on Investment (ROI) (PBT/Networth) |
|
0.10 |
0.08 |
0.11 |
|
|
|
|
|
|
|
Debt Equity Ratio (Total Debt /Networth) |
|
0.23 |
0.13 |
0.00 |
|
|
|
|
|
|
|
Current Ratio (Current Asset/Current Liability) |
|
1.19 |
1.25 |
1.28 |
FINANCIAL ANALYSIS
[all figures are
in Rupees Millions]
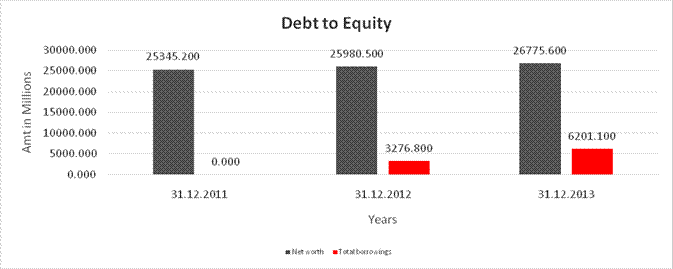
DEBT EQUITY RATIO
|
Particular |
31.12.2011 |
31.12.2012 |
31.12.2013 |
|
|
(Rs.
In Millions) |
(Rs.
In Millions) |
(Rs.
In Millions) |
|
Share Capital |
423.800 |
423.800 |
423.800 |
|
Reserves & Surplus |
24921.400 |
25556.700 |
26351.800 |
|
Net
worth |
25345.200 |
25980.500 |
26775.600 |
|
|
|
|
|
|
long-term borrowings |
0.000 |
0.000 |
0.000 |
|
Short term borrowings |
0.000 |
3276.800 |
6201.100 |
|
Total
borrowings |
0.000 |
3276.800 |
6201.100 |
|
Debt/Equity
ratio |
0.000 |
0.126 |
0.232 |
YEAR-ON-YEAR GROWTH
|
Year
on Year Growth |
31.12.2011 |
31.12.2012 |
31.12.2013 |
|
|
(Rs.
In Millions) |
(Rs.
In Millions) |
(Rs.
In Millions) |
|
Sales |
74489.700 |
75649.900 |
77219.900 |
|
|
|
1.558 |
2.075 |
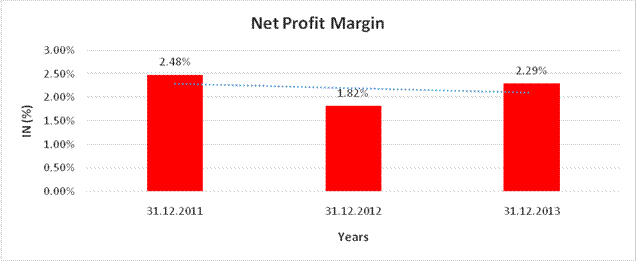
NET PROFIT MARGIN
|
Net
Profit Margin |
31.12.2011 |
31.12.2012 |
31.12.2013 |
|
|
(Rs.
In Millions) |
(Rs.
In Millions) |
(Rs.
In Millions) |
|
Sales |
74489.700 |
75649.900 |
77219.900 |
|
Profit |
1845.400 |
1374.100 |
1768.900 |
|
|
2.48% |
1.82% |
2.29% |
LOCAL AGENCY FURTHER INFORMATION
|
Sr. No. |
Check List by Info
Agents |
Available in Report (Yes / No) |
|
1] |
Year of Establishment |
Yes |
|
2] |
Locality of the firm |
Yes |
|
3] |
Constitutions of the firm |
Yes |
|
4] |
Premises details |
No |
|
5] |
Type of Business |
Yes |
|
6] |
Line of Business |
Yes |
|
7] |
Promoter's background |
No |
|
8] |
No. of employees |
Yes |
|
9] |
Name of person contacted |
Yes |
|
10] |
Designation of contact person |
Yes |
|
11] |
Turnover of firm for last three years |
Yes |
|
12] |
Profitability for last three years |
Yes |
|
13] |
Reasons for variation <> 20% |
------ |
|
14] |
Estimation for coming financial year |
No |
|
15] |
Capital in the business |
Yes |
|
16] |
Details of sister concerns |
Yes |
|
17] |
Major suppliers |
No |
|
18] |
Major customers |
No |
|
19] |
Payments terms |
No |
|
20] |
Export / Import details (if applicable) |
No |
|
21] |
Market information |
------ |
|
22] |
Litigations that the firm / promoter involved in |
Yes |
|
23] |
Banking Details |
Yes |
|
24] |
Banking facility details |
Yes |
|
25] |
Conduct of the banking account |
----- |
|
26] |
Buyer visit details |
------ |
|
27] |
Financials, if provided |
Yes |
|
28] |
Incorporation details, if applicable |
Yes |
|
29] |
Last accounts filed at ROC |
Yes |
|
30] |
Major Shareholders, if available |
Yes |
|
31] |
Date of Birth of Proprietor/Partner/Director, if available |
No |
|
32] |
PAN of Proprietor/Partner/Director, if available |
No |
|
33] |
Voter ID No of Proprietor/Partner/Director, if available |
No |
|
34] |
External Agency Rating, if available |
Yes |
LITIGATIONS DETAILS
CASE PENDING
|
High Court of Karnataka
-Bangalore Bench |
COP 127/2013 |
|
Petitioner/Appnt.
Name |
BHARAT BIJLEE LIMITED |
Respondent/Defnt.
Name |
ABB LIMITED |
|
Petnr./Appnt.
Advocate |
MURALIDHARA C |
Respnt./Defnt.
Advocate |
KEERTHIKUMAR D NAIK |
|
Date Filed |
28/06/2013 |
District |
Bangalore City |
|
Stage |
PENDING FOR ADMISSON |
Last Posted For |
ADMISSION |
|
Last Action Taken |
ADJOURNED |
Last Date of Action |
25/09/2014 |
|
Next Hearing Date : |
|
|
|
|
Latest Order |
LIST AFTER 2 WKS |
||
|
Before Hon'ble
Judge/s |
A. S. Bopanna |
||
Details of the Daily Order
(Click on date of order to get full order)
|
Sl No |
Honble Judge |
Date of Order |
|
1 |
HONBLE SANJ |
06/09/2013 |
|
2 |
HONBLE SANJ |
20/09/2013 |
CORPORATE INFORMATION
Subject has served utility and industry customers for over six decades with the complete range of engineering, products, solutions and services in areas of Automation and Power technology. The Company has extensive installed base for manufacturing and a countrywide marketing and service presence. Besides catering to Indian domestic market, the Company is also playing an increasing role in the global market.
PERFORMANCE REVIEW
The Company secured orders valued Rs 671.700 Millions in 2013 as against Rs 696.600 Millions in the previous year. Base orders from wider spectrum of customers helped offset the paucity of large projects in the market. Exports grew annulling the effect of a contraction in domestic market opportunities. The company continued to tap sectors like Renewable energy, Data center, Railways, Grid stability, Mining that look increasingly promising now and for the future. The order backlog at the end of the year stood at Rs 770.900 Millions which continued to give more visibility to the future revenue streams. The revenues for the Company for the year 2013 stood at Rs 763.200 Millions as against Rs 756.500 Millions in the previous year, reflecting stability of operations in an uncertain market situation. Profit before tax was at Rs 27.200 Millions in 2013 improved as compared to Rs 20.600 Millions in the previous year mainly due to operational excellence initiatives, supply chain efficiencies, focus on project management and localization of the products inspite of higher interest costs. Net profit after tax stood at Rs 17.900 Millions for the current year as compared to Rs 13.700 Millions in the previous year. Consequently the earnings per share for 2013 stood at Rs 8.46 per share as compared to Rs 6.48 in 2012.
MANAGEMENT’S
DISCUSSION AND ANALYSIS
ECONOMY AND MARKET
OVERVIEW
The economic landscape in 2013 continued to remain under pressure with year-on-year growth in gross domestic product declining to sub 5 percent, where the growth came primarily from agriculture and services. On the contrary, industry growth through the year remained flat and new project announcements fell to a third over a two year period. High interest rates, low policy visibility, delayed environmental clearances, issues around land acquisitions and fuel linkages, along with increasing inflation continued to impact global investor confidence in India. During the year, the rupee depreciated to an all-time low. Towards the end of the year, certain focused measures by the government and central bank, helped to bring in some positive trends as rupee stabilized, exports increased, current account deficit declined and project clearances were fast-tracked.
OPERATIONS OVERVIEW
During the year, the Company’s performance was mainly driven by continued penetration into new markets viz. renewables, energy efficiency solutions, data centers, railways and operational excellence initiatives. Focus on project management, supply chain efficiencies, aggressive localization, productivity improvement and various other optimization initiatives led to improved quality of execution across business segments. These initiatives also helped address market challenges, thereby reflecting in steady improvement of results. The Company has reported a healthy turnaround in cash in the midst of a tight liquidity market.
The year was marked by successful commissioning of several landmark projects – including 765/400 kV air insulated substation for Power Grid Corporation of India Limited, supporting the integration of the northern and southern grid, thereby help realizing the ‘one nation – one grid’ vision of the country. The Company also successfully commissioned the 2x25 MW of solar PV project for Mahagenco a/c Megha Engineering in the state of Maharashtra. While short cycle projects continued to be in focus, the Company remained selective in projects and sectors that offered better profitability and cash, which included higher content of its own manufactured items. There were, however, specific segments that faced some strain due to slowing investments in domestic industries. The cost of imports was also adversely impacted by currency volatility. Exports witnessed healthy growth, bolstered by orders for products and solutions with further penetration into new geographies.
With a strategic long-term focus, the Company added new capacity in 2013. The Company invested in new factories for Gas Insulated Switchgears (GIS), Plug and Switch Systems (PASS), oil-type and dry-type distribution transformers at Savli near Vadodara, along with a new miniature circuit breaker line at Nelamangala in Bangalore.
The Company secured orders valued at Rs 6,717 crores in 2013 as against Rs 696.600 Millions in the previous year. Base orders from wider spectrum of customers helped offset the paucity of large projects in the market. Exports grew annulling the effect of a contraction in domestic market opportunities. The Company continued to tap sectors like renewable energy, data center, railways, grid stability, mining, that look increasingly promising now and for the future.
The revenues for the Company for the year stood at Rs 763.200 Millions as against Rs 747.000 Millions in 2012, reflecting stability of operations in an uncertain market situation.
The order backlog at the end of the year stood at Rs 770.900 Millions, which continued to give more visibility to the future revenue streams.
Profit before tax was at Rs 27.200 Millions in 2013 as compared to Rs 20.600 Millions in the previous year. Net profit after tax stood at Rs 17.900 Millions for the current year as compared to Rs 13.700 Millions in the previous year. Consequently the earnings per share for 2013 stood at Rs 8.46 per share as compared to Rs 6.48 in 2012.
EXPORTS
During 2013, exports grew by well over 20 percent. Export revenue was driven by increased focus on market development and improving product quality. Significant export orders included those for dry type transformers, Safe Link circuit breaker, high voltage breakers and transformers, and miniature circuit breakers. Exports were spread over Europe, the Middle East, Brazil, Bangladesh, Bhutan, Nigeria, Oman, Angola, Australia, etc.
OUTLOOK
Led by the current macro trends, various projections peg inflation to remain at current levels, thus keeping interest rates elevated. While infrastructure investments by the government are expected to continue, the impending national elections introduce uncertainty in the investment climate in 2014. Towards the end of 2013, measures to fast-track project implementation gained traction. With respect to supply of coal to the power sector, signing of fuel supply agreements is likely to address the fuel linkage issues to a certain extent. Debt recast plans for state electricity boards is gaining momentum with a few states already in the fold. Interest in renewable energy saw a revival in 2013 with more orders in wind and larger installations for solar power. Investment in power quality improvement, grid reliability and stability, renewables, rail, oil and gas, and mining are likely to provide growth opportunities.
CONTINGENT
LIABILITIES
Rs.
In Millions
|
Particular |
31.12.2013 |
31.12.2012 |
|
Excise duty / Service tax and sales tax liabilities in dispute |
3848.300 |
3646.800 |
|
Custom duty liabilities in dispute |
161.400 |
20.200 |
|
Claims against the Company not acknowledged as debts |
88.500 |
88.500 |
|
Income tax matters in dispute |
2107.000 |
2540.500 |
INDEX OF CHARGES
|
S.No. |
Charge ID |
Date of Charge
Creation/Modification |
Charge amount
secured |
Charge Holder |
Address |
Service Request
Number (SRN) |
|
1 |
80017474 |
08/09/2003 |
150,000,000.00 |
ICICI BANK LIMITED |
ICICI BANK TOWERS, 1,COMMISSORIAT ROAD, BANGALORE, KARNATAKA - 560001, INDIA |
- |
* Date of charge modification
FIXED ASSETS
- Freehold land
- Leasehold Land
- Leasehold Improvements
- Factory Buildings
- Other Building
- Residential Quarters
- Plant and Machinery
- Furniture and Fixture
- Vehicle
STATEMENT OF UNAUDITED RESULTS FOR THE QUARTER AND SIX MONTHS ENDED
30.06.2014
Rs. In Millions
|
Particulars |
3 Months ended |
Preceding 3
Months ended |
Year to date
figures for current period ended |
|
|
30.06.2014 |
31.03.2014 |
30.06.2014 |
||
|
Unaudited |
Unaudited |
Unaudited |
||
|
1 |
Income from Operations |
|
|
|
|
|
(a) Net sates/income from operations (Net of excise duty) |
17944.000 |
18099.800 |
36043.800 |
|
|
(b) Other Operating Income |
277.800 |
177.300 |
455.100 |
|
|
Total income from
operations (net) |
18221.800 |
18277.100 |
36498.900 |
|
2 |
Expenses |
|
|
|
|
|
(a) Cost of materials consumed |
10925.400 |
10333.500 |
21258.900 |
|
|
(b) Purchases of stock-in trade |
657.000 |
823.300 |
1480.300 |
|
|
(c) Changes in inventories of finished goods. work-in-progress and
stock in trade |
(175.700) |
103.900 |
(71.800) |
|
|
(d) Subcontracting Charges |
929.300 |
1076.000 |
2005.300 |
|
|
(e) Employee benefits expense |
1697.100 |
1681.400 |
3378.600 |
|
|
(f) Depreciation and Anmortisation Expenses |
278.600 |
274.100 |
552.700 |
|
|
(g) Other Expenses |
2930.600 |
3001.800 |
5932.400 |
|
|
Total expenses |
17242.300 |
17294.000 |
34536.300 |
|
3 |
Profit/ (Loss) from operations before other Income, finance costs and
exceptional Items (1-2) |
979.500 |
983.100 |
1962.600 |
|
4 |
Other Income |
4.100 |
11.300 |
15.400 |
|
5 |
Profit/ (Loss) from operations before other income, finance costs and
exceptional items (3+4) |
983.600 |
994.400 |
1978.000 |
|
6 |
Finance Costs |
253.600 |
220.700 |
474.300 |
|
7 |
Profit/ (Loss) from ordinary activities after finance cost but before
exceptional items (5-6) |
730.000 |
773.700 |
1503.700 |
|
8 |
Exceptional items |
0.000 |
0.000 |
0.000 |
|
9 |
Profit/ (Loss) from ordinary activities before tax (7+8) |
730.000 |
773.700 |
1503.700 |
|
10 |
Tax expenses |
253.100 |
256.900 |
510.000 |
|
11 |
Net Profit / (Loss) from ordinary activities after tax (9-10) |
476.900 |
516.800 |
993.700 |
|
12 |
Extraordinary item (net of tax expense) |
0.000 |
0.000 |
0.000 |
|
13 |
Net Profit / (Loss) for the period (11-12) |
476.900 |
516.800 |
993.700 |
|
14 |
Share of profit' (loss) of associates |
-- |
-- |
-- |
|
15 |
Minority Interest |
-- |
-- |
-- |
|
16 |
Net Profit/ (Loss) after taxes, minority interest and share of profit/(loss)
of associates (13+14+15) |
476.900 |
516.800 |
993.700 |
|
17 |
Paid up equity share capital (Face Value of Rs2/-each) |
423.800 |
423.800 |
423.800 |
|
18 |
Reserve excluding Revaluation Reserve as per Balance Sheet of previous
accounting year |
-- |
-- |
-- |
|
19.i |
Earnings per share (before extraordinary items) of Rs.10/- each (not
annualised): |
|
|
|
|
|
(a) Basic |
2.25 |
2.44 |
4.69 |
|
|
(b) Diluted |
2.25 |
2.44 |
4.69 |
|
19.ii |
Earnings per share (after extraordinary items) of Rs.10/- each (not
annualised) |
|
|
|
|
|
(a) Basic |
2.25 |
2.44 |
4.69 |
|
|
(b) Diluted |
2.25 |
2.44 |
4.69 |
|
|
|
|
|
|
|
A |
PARTICULARS OF SHAREHOLDING |
|
|
|
|
1 |
Public Shareholding |
|
|
|
|
|
- Number of shares |
52977094 |
52977094 |
52977094 |
|
|
- Percentage of shareholding |
25.00% |
25.00% |
25.00% |
|
2 |
Promoters and Promoter group shareholding |
|
|
|
|
|
a) Pledged / Encumbered |
|
|
|
|
|
- Number of shares |
-- |
-- |
-- |
|
|
- Percentage of shares (as a % of the total shareholding of Promoter
& Promoter group) |
-- |
-- |
-- |
|
|
- Percentage of shares (as a % of the total Share Capital of the
Company) |
-- |
-- |
-- |
|
|
b) Non Encumbered |
|
|
|
|
|
- Number of shares |
158931281 |
158931281 |
158931281 |
|
|
- Percentage of shares (as a % of the total shareholding of Promoter
& Promoter group) |
100.00% |
100.00% |
100.00% |
|
|
- Percentage of shares (as a % of the total Share Capital of the Company) |
75.00% |
75.00% |
75.00% |
|
|
|
|
|
|
|
B |
INVESTOR COMPLAINTS |
|
|
|
|
|
Pending at the beginning of the quarter |
Nil |
|
|
|
|
Received during the quarter |
144 |
|
|
|
|
Disposed off during the quarter |
144 |
|
|
|
|
Remaining unresolved at the end of the quarter |
Nil |
|
|
REVENUE, RESULTS AND
CAPITAL EMPLOYED FOR THE SEGMENTS
Rs. In Millions
|
Particulars |
3 Months ended |
Preceding 3 Months ended |
Year to date figures for current period ended |
|
|
30.06.2014 |
31.03.2014 |
30.06.2014 |
||
|
Unaudited |
Unaudited |
Unaudited |
||
|
1 |
Segment Revenue |
|
|
|
|
|
a Power Systems |
5364.700 |
4766.100 |
10130.800 |
|
|
b Power Products |
5535.600 |
5739.000 |
11274.600 |
|
|
c Process Automation |
3016.900 |
2890.600 |
5907.500 |
|
|
d Discrete Automation and Motion |
3955.100 |
4352.900 |
8308.000 |
|
|
e Low Voltage Products |
1931.600 |
1814.800 |
3746.400 |
|
|
Total |
19803.900 |
19563.400 |
39367.300 |
|
|
Unallocated |
147.700 |
104.000 |
251.700 |
|
|
Total |
19951.600 |
19667.400 |
39619.000 |
|
|
Less: Inter-Segment revenue |
1729.800 |
1390.300 |
3120.100 |
|
|
Net Sales I
Income from Operations |
18221.800 |
18277.100 |
36498.900 |
|
|
|
|
|
|
|
2 |
Segment Results
Profit I (Loss) (before tax, finance cost and exceptional items) from Segment |
|
|
|
|
|
a Power Systems |
314.700 |
231.300 |
546.000 |
|
|
b Power Products |
349.700 |
579.700 |
929.400 |
|
|
c Process Automation |
282.300 |
205.500 |
487.800 |
|
|
d Discrete Automation and Motion |
209.900 |
192.100 |
402.000 |
|
|
e Low Voltage Products |
112.800 |
78.200 |
191.000 |
|
|
Total |
1269.400 |
1286.800 |
2556.200 |
|
|
Less: |
|
|
|
|
|
i) Finance costs |
253.600 |
220.700 |
474.300 |
|
|
ii) Other un-allocable expenditure net off un-allocable income |
285.800 |
292.400 |
578.200 |
|
|
Total
Profit(Loss) before Tax |
730.000 |
773.700 |
1503.700 |
|
|
|
|
|
|
|
3 |
Segment Capital
employed |
|
|
|
|
|
a Power Systems |
9189.000 |
7324.900 |
9189.000 |
|
|
b Power Products |
8229.200 |
9017.100 |
8229.200 |
|
|
c Process Automation |
4399.500 |
4093.200 |
4399.500 |
|
|
d Discrete Automation and Motion |
3758.200 |
3901.000 |
3758.200 |
|
|
e Low Voltage Products |
3011.200 |
2989.000 |
3011.200 |
|
|
f Unallocated |
(817.800) |
(32.800) |
(817.800) |
|
|
Total Segment
Capital Employed |
27769.300 |
27292.400 |
27769.300 |
STANDALONE /
CONSOLIDATED STATEMENT OF ASSETS AND LIABILITIES
Rs. In Millions
|
Particulars |
As at 30.06.2014 |
|
|
|
Particulars |
|
|
A |
EQUITY AND LIABILITIES |
|
|
1 |
Shareholder’s Funds |
|
|
|
a) Share Capital |
423.800 |
|
|
b) Reserves & Surplus |
27345.500 |
|
|
Sub Total- Shareholders funds |
27769.300 |
|
2 |
Share application money pending allotment |
0.000 |
|
3 |
Minority Interest |
0.000 |
|
4 |
Non-current liabilities |
|
|
|
(a) Other long term liabilities |
43.400 |
|
|
(b) Long term provisions |
57.100 |
|
|
Sub Total- Non Current Liabilities |
100.500 |
|
5 |
Current liabilities |
|
|
|
(a) Short term borrowings |
8080.000 |
|
|
(b) Trade Payables |
18553.800 |
|
|
(c) Other current liabilities |
13703.100 |
|
|
(d) Short term provisions |
1977.400 |
|
|
Sub Total- Current Liabilities |
42314.300 |
|
|
TOTAL-EQUITY AND LIABILITIES |
70184.100 |
|
B |
ASSETS |
|
|
1 |
Non-current assets |
|
|
|
(a) Fixed assets |
143284 |
|
|
(b) Non-current Investments |
163.900 |
|
|
(c) Deferred tax assets (net) |
99.400 |
|
|
(d) Long-term Loan and Advances |
4092.800 |
|
|
(e) Other
Non-current assets |
83.000 |
|
|
Sub-Total- Non current assets |
18767.500 |
|
2 |
Current assets |
|
|
|
a) Current Investments |
0.800 |
|
|
b) Inventories |
9980.600 |
|
|
c) Trade Receivables |
31864.000 |
|
|
d) Cash and cash equivalents |
2382.200 |
|
|
(e) Short term loans and advances |
3142.100 |
|
|
(f) Other current assets |
4046.900 |
|
|
Sub-Total- current assets |
51416.600 |
|
|
TOTAL ASSETS |
70184.100 |
Note:
1. This statement has been reviewed by the Audit Committee and recommended for approval to the Board and the Board approved at its meeting held on July 23, 2014.
2. Net profit of Rs. 24.200 Millions of Baldor Electric India Private Limited
(erstwhile wholly owned subsidiary of the Company) on amalgamation, from the
appointed date i.e, April 01, 2012 to December 31, 2012 of the earlier year has
been accounted separately in the previous year ended December 31, 2013. The
Scheme has become effective on November 01, 2013. The financial results for the
corresponding 3 months ended June 30, 2013 in the previous year and year to
date figures for the previous year ended June 30, 2013 has been restated to
include results of operations of Baldor in these periods.
3. The auditors have conducted a limited review of the above financial results
for the quarter ended on June 30, 2014.
4. The figures of the previous year/ periods have been regrouped/ reclassified,
wherever necessary, to conform with the current year's classification.
AS PER WEBSITE
PRESS RELEASES
ABB WINS POWER
PRODUCTS ORDER WORTH OVER $30 MILLION IN THE USA
Gas-insulated switchgear to strengthen transmission infrastructure in New Jersey
Zurich, Switzerland, September 12, 2014 – ABB, the leading power and automation technology group, has won an order worth over $30 million from Public Service Electric and Gas (PSE&G) to supply gas-insulated switchgear (GIS) for substations to boost the reliability of transmission infrastructure in New Jersey.
ABB’s order includes design, supply and commissioning of ABB’s 550 kilovolt (kV) GIS type ELK-3, a compact and modular solution that offers increased reliability and safety.
PSE&G is spending $4 billion between 2014 and 2016 to
upgrade its electricity infrastructure to meet demand for electricity that per
person has more than doubled since the 1970s. Upgrading the grid is a necessity
in a populated area like New Jersey that is focusing on strengthening
infrastructure for the state’s expanding high-tech economy.
“ABB has supplied GIS to several PSE&G projects and we are delighted to
work with them once again,” said Bernhard Jucker, head of ABB’s Power Products
division. ”Our compact GIS technology will help strengthen the transmission
network in the region and facilitate reliable supply of electricity to
residential and commercial customers.”
In a power system, switchgear controls, protects and isolates electrical
equipment to boost the reliability of power supply. With GIS technology, key components
including breakers, switches, contacts and conductors are protected with
insulating gas. Compactness, reliability and robustness make it an ideal
solution in urban areas and other locations where space is limited or in harsh
environmental conditions.
ABB pioneered high-voltage GIS in the mid-1960s and continues to drive the
technology, offering a full range product portfolio with voltage levels from
72.5kV to 1,200kV. As a market leader in high-voltage GIS technology, ABB has a
global installed base of more than 23,000 bays.
PSE&G is New Jersey's oldest and largest publicly owned utility, serving
nearly three quarters of state’s population across a 4,200 square-kilometer
diagonal corridor. As one of the largest combined electric and gas companies in
the United States it provides gas to 1.8 million customers and electricity to
2.2 million customers in more than 300 urban, suburban and rural communities,
including New Jersey's six largest cities. PSE&G has consistently been
ranked among the most reliable electric utilities in the USA.
ABB (www.abb.com) is a leader in power and automation technologies that enable
utility, industry, and transport and infrastructure customers to improve
performance while lowering environmental impact. The ABB Group of companies
operates in around 100 countries and employs about 145,000 people.
CMT REPORT (Corruption, Money Laundering & Terrorism]
The Public Notice information has been collected from various sources
including but not limited to: The Courts,
1] INFORMATION ON
DESIGNATED PARTY
No exist designating subject or any of its beneficial owners,
controlling shareholders or senior officers as terrorist or terrorist
organization or whom notice had been received that all financial transactions
involving their assets have been blocked or convicted, found guilty or against
whom a judgement or order had been entered in a proceedings for violating
money-laundering, anti-corruption or bribery or international economic or
anti-terrorism sanction laws or whose assets were seized, blocked, frozen or
ordered forfeited for violation of money laundering or international
anti-terrorism laws.
2] Court Declaration :
No records exist to suggest that subject is or
was the subject of any formal or informal allegations, prosecutions or other
official proceeding for making any prohibited payments or other improper
payments to government officials for engaging in prohibited transactions or
with designated parties.
3] Asset Declaration :
No records exist to suggest that the property or assets of the subject
are derived from criminal conduct or a prohibited transaction.
4] Record on Financial
Crime :
Charges or conviction
registered against subject: None
5] Records on Violation of
Anti-Corruption Laws :
Charges or
investigation registered against subject: None
6] Records on Int’l
Anti-Money Laundering Laws/Standards :
Charges or
investigation registered against subject: None
7] Criminal Records
No
available information exist that suggest that subject or any of its principals
have been formally charged or convicted by a competent governmental authority
for any financial crime or under any formal investigation by a competent
government authority for any violation of anti-corruption laws or international
anti-money laundering laws or standard.
8] Affiliation with
Government :
No record
exists to suggest that any director or indirect owners, controlling
shareholders, director, officer or employee of the company is a government
official or a family member or close business associate of a Government
official.
9] Compensation Package :
Our market
survey revealed that the amount of compensation sought by the subject is fair
and reasonable and comparable to compensation paid to others for similar
services.
10] Press Report :
No press reports / filings exists on
the subject.
CORPORATE GOVERNANCE
MIRA INFORM as part of its Due Diligence do provide comments on Corporate
Governance to identify management and governance. These factors often have been
predictive and in some cases have created vulnerabilities to credit
deterioration.
Our Governance Assessment focuses principally on the interactions
between a company’s management, its Board of Directors, Shareholders and other
financial stakeholders.
CONTRAVENTION
Subject is not known to have contravened any existing local laws,
regulations or policies that prohibit, restrict or otherwise affect the terms
and conditions that could be included in the agreement with the subject.
FOREIGN EXCHANGE RATES
|
Currency |
Unit
|
Indian Rupees |
|
US Dollar |
1 |
Rs.61.30 |
|
|
1 |
Rs.99.16 |
|
Euro |
1 |
Rs.78.89 |
INFORMATION DETAILS
|
Information
Gathered by : |
PRT |
|
|
|
|
Analysis Done by
: |
KAR |
|
|
|
|
Report Prepared
by : |
SNT |
SCORE & RATING EXPLANATIONS
|
SCORE FACTORS |
RANGE |
POINTS |
|
HISTORY |
1~10 |
7 |
|
PAID-UP CAPITAL |
1~10 |
8 |
|
OPERATING SCALE |
1~10 |
8 |
|
FINANCIAL CONDITION |
|
|
|
--BUSINESS SCALE |
1~10 |
9 |
|
--PROFITABILIRY |
1~10 |
9 |
|
--LIQUIDITY |
1~10 |
9 |
|
--LEVERAGE |
1~10 |
8 |
|
--RESERVES |
1~10 |
9 |
|
--CREDIT LINES |
1~10 |
8 |
|
--MARGINS |
-5~5 |
-- |
|
DEMERIT POINTS |
|
|
|
--BANK CHARGES |
YES/NO |
YES |
|
--LITIGATION |
YES/NO |
YES |
|
--OTHER ADVERSE INFORMATION |
YES/NO |
NO |
|
MERIT POINTS |
|
|
|
--SOLE DISTRIBUTORSHIP |
YES/NO |
NO |
|
--EXPORT ACTIVITIES |
YES/NO |
NO |
|
--AFFILIATION |
YES/NO |
YES |
|
--LISTED |
YES/NO |
YES |
|
--OTHER MERIT FACTORS |
YES/NO |
YES |
|
DEFAULTER |
|
|
|
--RBI |
YES/NO |
NO |
|
--EPF |
YES/NO |
NO |
|
TOTAL |
|
75 |
This score serves as a reference to assess
SC’s credit risk and to set the amount of credit to be extended. It is calculated
from a composite of weighted scores obtained from each of the major sections of
this report. The assessed factors and their relative weights (as indicated
through %) are as follows:
Financial
condition (40%) Ownership
background (20%) Payment record
(10%)
Credit history
(10%) Market trend (10%) Operational size
(10%)
RATING EXPLANATIONS
|
RATING |
STATUS |
PROPOSED CREDIT LINE |
|
|
>86 |
Aaa |
Possesses an extremely sound financial base with the strongest capability
for timely payment of interest and principal sums |
Unlimited |
|
71-85 |
Aa |
Possesses adequate working capital. No caution needed for credit
transaction. It has above average (strong) capability for payment of interest
and principal sums |
Large |
|
56-70 |
A |
Financial & operational base are regarded healthy. General
unfavourable factors will not cause fatal effect. Satisfactory capability for
payment of interest and principal sums |
Fairly Large |
|
41-55 |
Ba |
Overall operation is considered normal. Capable to meet normal
commitments. |
Satisfactory |
|
26-40 |
B |
Capability to overcome financial difficulties seems comparatively
below average. |
Small |
|
11-25 |
Ca |
Adverse factors are apparent. Repayment of interest and principal sums
in default or expected to be in default upon maturity |
Limited with
full security |
|
<10 |
C |
Absolute credit risk exists. Caution needed to be exercised |
Credit not
recommended |
|
-- |
NB |
New Business |
-- |
This report is issued at your request without any
risk and responsibility on the part of MIRA INFORM PRIVATE LIMITED (MIPL)
or its officials.