MIRA INFORM REPORT
|
Report Date : |
07.11.2014 |
IDENTIFICATION DETAILS
|
Name : |
MANUFACTURAS CLIMA SA |
|
|
|
|
Registered Office : |
Calle Dos De Maig 195 - Barcelona - 08013 - Barcelona |
|
|
|
|
Country : |
Spain |
|
|
|
|
Financials (as on) : |
31.12.2013 |
|
|
|
|
Date of Incorporation : |
19.07.1933
|
|
|
|
|
Legal Form : |
Public Company |
|
|
|
|
Line of Business : |
Manufacture
of other textiles |
|
|
|
|
No. of Employees : |
25 |
RATING & COMMENTS
|
MIRA’s Rating : |
Ba |
|
RATING |
STATUS |
PROPOSED CREDIT LINE |
|
|
41-55 |
Ba |
Overall operation is considered normal. Capable to meet normal
commitments. |
Satisfactory |
|
Status : |
Satisfactory |
|
|
|
|
Payment Behaviour : |
No Complaints |
|
|
|
|
Litigation : |
Clear |
NOTES:
Any query related to this report can be made
on e-mail: infodept@mirainform.com
while quoting report number, name and date.
ECGC Country Risk Classification List – June 1, 2014
|
Country Name |
Previous Rating (31.03.2014) |
Current Rating (01.06.2014) |
|
Spain |
A2 |
A2 |
|
Risk Category |
ECGC
Classification |
|
Insignificant |
A1 |
|
Low |
A2 |
|
Moderate |
B1 |
|
High |
B2 |
|
Very High |
C1 |
|
Restricted |
C2 |
|
Off-credit |
D |
SPAIN - ECONOMIC OVERVIEW
Spain experienced a prolonged recession in the wake of the global financial crisis. GDP contracted by 3.7% in 2009, ending a 16-year growth trend, and continued contracting through most of 2013. Economic growth resumed in late 2013, albeit only modestly, as credit contraction in the private sector, fiscal austerity, and high unemployment continued to weigh on domestic consumption and investment. Exports, however, have been resilient throughout the economic downturn, partially offsetting declines in domestic consumption and helped to bring Spain's current account into surplus in 2013 for the first time since 1986. The unemployment rate rose from a low of about 8% in 2007 to more than 26% in 2013, straining Spain's public finances as spending on social benefits increased while tax revenues fell. Spain’s budget deficit peaked at 11.4% of GDP in 2009. Spain gradually reduced the deficit to just under 7% of GDP in 2013, slightly above the 6.5% target negotiated between Spain and the EU. Public debt has increased substantially – from 60.1% of GDP in 2010 to 93.4% in 2013. Rising labor productivity, moderating labor costs, and lower inflation have helped to improve foreign investor interest in the economy and to reduce government borrowing costs. The government's ongoing efforts to implement reforms - labor, pension, health, tax, and education - are aimed at supporting investor sentiment. The government also has shored up struggling banks exposed to Spain's depressed domestic construction and real estate sectors by successfully completing an EU-funded restructuring and recapitalization program in December 2013.
|
Source
: CIA |
EXECUTIVE
SUMMARY
|
Name: |
MANUFACTURAS CLIMA SA |
|
NIF / Fiscal code: |
A08029951 |
|
Status: |
ACTIVE |
|
Incorporation Date: |
19/07/1933 |
|
Register Data |
Register Section 8 Sheet 4834 |
|
Last Publication in
BORME: |
20/06/2014 [Appointments] |
|
Last Published Account Deposit: |
2013 |
|
Share Capital: |
230.788,65 |
|
|
|
|
Localization: |
CALLE DOS DE MAIG 195 - BARCELONA - 08013 - BARCELONA |
|
Telephone - Fax - Email - Website: |
Ph.:. 932 456 436 Email. clima@clima.es Website. www.clima.es |
|
|
|
|
Activity: |
|
|
NACE: |
1399 - Manufacture of other textiles |
|
Registered Trademarks: |
|
|
Audited / Opinion: |
Si / |
|
Tenders and Awards: |
0 for a total cost of 0 |
|
Subsidies: |
0 for a total cost of 0 |
|
Quality Certificate: |
No |
|
|
|
|
Defaults,
Legal Claims and Insolvency Proceedings
|
|
|
|
|
|
|
|
Number |
Amount (€) |
Most Recent Entry |
|
Insolvency Proceedings, Bankruptcy and Suspension of Payments |
|
Unpublished |
--- |
--- |
|
Defaults on debt with Financial Institutions and Large Companies |
|
None |
--- |
--- |
|
Judicial Claims (Notices, Executive Proceedings, Attachments,
Auctions, Bad Debt) |
|
None |
0 |
--- |
|
Proceedings heard by the Civil Court |
|
Unpublished |
0 |
--- |
|
Proceedings heard by the Labour Court |
|
Unpublished |
0 |
--- |
|
|
|
Partners
|
|
|
|
ACCIONES PROPIAS DE MANUFACTURAS CLIMA, S.A. |
3.91 % |
|
|
Shares: |
1 |
|
|
Other Links: |
1 |
|
|
No. of Active Corporate Bodies: |
CHIEF EXECUTIVE OFFICER 1 |
|
|
Ratios |
2013 |
2012 |
Change |
|
|
|
|
|
Guarantees: |
|
|
Properties Registered: |
Company NO, Administrator NO |
|
Financing / Guarantee Sources : |
Sources YES, Guarantees YES |
|
|
|
|
|
|
|
INVESTIGATION SUMMARY |
|
|
Company incorporated in the year 1933, although it started its activity
in 1919. It is engaged in the manufacture and sale of umbrellas and the
activity that it develops is national and international. In the sources
consulted nothing appears against it. In light of the foregoing we consider
it apt to be related to risk operations according to its importance. |
|
|
Interviewed Person: |
|
Enquiry
Details
|
Identification |
|
|
Social Denomination: |
MANUFACTURAS
CLIMA SA |
|
NIF / Fiscal code: |
A08029951 |
|
Corporate Status: |
ACTIVE |
|
Start of activity: |
1966 |
|
Registered Office: |
CALLE DOS DE
MAIG 195 |
|
Locality: |
BARCELONA |
|
Province: |
BARCELONA |
|
Postal Code: |
08013 |
|
Telephone: |
932 456 436 |
|
Fax: |
932 455 824 |
|
Website: |
www.clima.es |
|
Email: |
clima@clima.es |
|
Interviewed Person: |
Sr.: Juan
Santacana |
Activity
|
NACE: |
1399 |
|
CNAE Obtaining Source: |
1399 |
|
Additional Information: |
It is engaged
in the manufacture and sale of umbrellas |
|
Franchise: |
No |
|
Import / export: |
EXPORTS |
|
Future Perspective: |
Consolidation |
|
Industry situation: |
Maturity |
Number
of Employees
|
|
Year |
No. of employees |
Established |
Incidentals |
|
|
|
2014 |
25 |
|
|
|
|
Chronological
Summary
|
|||
|
|
|
|
|
|
|
Year |
Act |
|
|
|
1990 |
Adaptation to Law (1) Appointments/ Re-elections (2)
Cessations/ Resignations/ Reversals (1) Change of Social address (1)
Statutory Modifications (1) |
|
|
|
1991 |
Accounts deposit (ejer. 1989, 1990) |
|
|
|
1992 |
Accounts deposit (ejer. 1991) |
|
|
|
1993 |
Accounts deposit (ejer. 1992) |
|
|
|
1994 |
Accounts deposit (ejer. 1993) |
|
|
|
1995 |
Accounts deposit (ejer. 1994) Appointments/ Re-elections (1)
Cessations/ Resignations/ Reversals (1) |
|
|
|
1996 |
Accounts deposit (ejer. 1995) |
|
|
|
1997 |
Accounts deposit (ejer. 1996) Appointments/ Re-elections
(3) |
|
|
|
1998 |
Board Meeting (1) |
|
|
|
1999 |
Accounts deposit (ejer. 1997, 1998) |
|
|
|
2000 |
Accounts deposit (ejer. 1999) Appointments/ Re-elections
(2) Board Meeting (1) |
|
|
|
2001 |
Accounts deposit (ejer. 2000) Board Meeting (1) Capital
Reduction (2) |
|
|
|
2002 |
Accounts deposit (ejer. 2001) Board Meeting (1) |
|
|
|
2003 |
Accounts deposit (ejer. 2002) Appointments/ Re-elections
(1) |
|
|
|
2004 |
Accounts deposit (ejer. 2003) Board Meeting (1) |
|
|
|
2005 |
Accounts deposit (ejer. 2004) Appointments/ Re-elections
(1) Board Meeting (2) |
|
|
|
2006 |
Accounts deposit (ejer. 2005) Board Meeting (1)
Cessations/ Resignations/ Reversals (2) Change of Social Denomination (1) |
|
|
|
2007 |
Accounts deposit (ejer. 2006) Board Meeting (1) |
|
|
|
2008 |
Accounts deposit (ejer. 2007) Appointments/ Re-elections
(1) Board Meeting (1) |
|
|
|
2009 |
Accounts deposit (ejer. 2008) Capital Reduction (2) |
|
|
|
2010 |
Accounts deposit (ejer. 2009) Appointments/ Re-elections
(1) Capital Reduction (2) |
|
|
|
2011 |
Accounts deposit (ejer. 2010) Appointments/ Re-elections
(3) Cessations/ Resignations/ Reversals (1) Statutory Modifications (1) |
|
|
|
2012 |
Accounts deposit (ejer. 2011) |
|
|
|
2013 |
Accounts deposit (ejer. 2012) Statutory Modifications (1) |
|
|
|
2014 |
Accounts deposit (ejer. 2013) Appointments/ Re-elections
(3) Cessations/ Resignations/ Reversals (1) |
|
|
Breakdown
of Owners' Equity
|
|
|
Registered Capital: |
230.788,65 |
|
Paid up capital: |
230.788,65 |
|
Updated
Evolution of the Subscribed and Paid-in Capital
|
|||||
|
|
|
|
|
|
|
|
|
|||||
|
|
|
|
|
|
|
|
Publishing Date |
Registration Type |
Capital Subscribed |
Paid up capital |
Underwritten result |
Disbursed Result |
|
18/10/2001 |
Capital Reduction |
-189.319 |
-189.319 |
435.734 |
435.734 |
|
21/05/2009 |
Capital Reduction |
-119.902 |
-119.902 |
315.832 |
315.832 |
|
26/11/2010 |
Capital Reduction |
-85.043 |
-85.043 |
230.789 |
230.789 |

Active
Social Bodies
|
Post published |
Social Body's Name |
Appointment Date |
Other Positions in this Company |
|
PRESIDENT |
GISPERT SEGURA BERTA |
14/04/2014 |
3 |
|
MEMBER OF THE BOARD |
ENSENYAT SALADA JORDI |
14/03/2011 |
2 |
|
|
GISPERT SEGURA BERTA |
14/03/2011 |
3 |
|
|
GISPERT SEGURA MIREIA |
14/03/2011 |
2 |
|
JOINT ATTORNEY |
GISPERT SEGURA BERTA |
21/05/2014 |
3 |
|
PROXY |
MORANT FERNANDEZ RICARDO |
25/06/2003 |
1 |
|
|
TORRAS CASANOVAS ALBERTO |
07/01/1997 |
1 |
|
|
ENSEÑAT SALADA JORDI |
07/01/1997 |
1 |
|
CHIEF EXECUTIVE OFFICER |
ENSENYAT SALADA JORDI |
28/03/2011 |
2 |
|
SECRETARY |
GISPERT SEGURA MIREIA |
14/03/2011 |
2 |
|
ACCOUNTS' AUDITOR / HOLDER |
PROAUDIT SLP |
11/06/2014 |
1 |
Historical
Social Bodies
|
Social Body's Name |
Post published |
End Date |
Other Positions in this Company |
|
ALONSO GAMARRA ANTONIO |
MEMBER OF THE BOARD |
17/10/1990 |
3 |
|
|
SECRETARY |
17/10/1990 |
|
|
|
PROXY |
16/01/2006 |
|
|
GISPERT ACEÑA ALFONSO |
SINGLE ADMINISTRATOR |
10/05/1995 |
11 |
|
|
SINGLE ADMINISTRATOR |
27/05/2010 |
|
|
|
SINGLE ADMINISTRATOR |
14/03/2011 |
|
|
|
ADMINISTRATOR |
18/05/2000 |
|
|
|
ADMINISTRATOR |
05/05/2005 |
|
|
|
MEMBER OF THE BOARD |
17/10/1990 |
|
|
|
MEMBER OF THE BOARD |
14/04/2014 |
|
|
|
CHIEF EXECUTIVE OFFICER |
17/10/1990 |
|
|
|
PRESIDENT |
17/10/1990 |
|
|
|
PRESIDENT |
14/04/2014 |
|
|
|
CHIEF EXECUTIVE OFFICER |
14/04/2014 |
|
|
LLOP DESCARREGA LUIS |
PROXY |
01/03/2006 |
1 |
|
LORCA CARPES FERNANDO |
MEMBER OF THE BOARD |
17/10/1990 |
4 |
|
|
PROXY |
16/01/2006 |
|
|
|
CHIEF EXECUTIVE OFFICER |
17/10/1990 |
|
|
|
VICE CHAIRMAN |
17/10/1990 |
|
|
MELICH VIDAL ANTONIO |
MEMBER OF THE BOARD |
17/10/1990 |
1 |
|
MILLERA MONTOLIU MIGUEL |
MEMBER OF THE BOARD |
17/10/1990 |
1 |
|
PROAUDIT SL |
ACCOUNTS' AUDITOR / HOLDER |
11/06/2014 |
3 |
|
|
ACCOUNTS' AUDITOR / HOLDER |
12/08/2008 |
|
|
|
ACCOUNTS' AUDITOR / HOLDER |
01/02/2011 |
|
|
RUBERT ALEGRIN PELAYO |
MEMBER OF THE BOARD |
17/10/1990 |
2 |
|
|
HONOUR PRESIDENT |
17/10/1990 |
|
|
RUBERT VILA DOLORES |
MEMBER OF THE BOARD |
17/10/1990 |
1 |
Executive
board
|
Post |
NIF |
Name |
|
FINANCIAL DIRECTOR |
|
JUAN SANTACANA |
|
MANAGING DIRECTOR |
|
JORGE ENSEÑAT SALADA |
Defaults,
Legal Claims and Insolvency Proceedings
Section enabling assessment of the degree of compliance of
the company queried with its payment obligations. It provides information on
the existence and nature of all stages of Insolvency and Legal Proceedings
published with reference to the Company in the country's various Official
Bulletins and national newspapers, as well Defaults Registered in the main
national credit bureaus (ASNEF Industrial and RAI ).
> Summary
Chronological
summary
|
|
|
Number of Publications |
Amount (_) |
Start date |
End date |
|
Insolvency Proceedings, Bankruptcy and Suspension of Payments |
|
Unpublished |
--- |
--- |
--- |
|
Request/Declaration |
|
0 |
--- |
date |
|
|
Proceedings |
|
--- |
--- |
|
--- |
|
Resolution |
|
--- |
--- |
|
--- |
|
Defaults on debt with Financial Institutions and Large Companies |
Bank and Commercial Delinquency |
None |
0 |
|
|
|
Status: Friendly |
|
--- |
|
|
|
|
Status: Pre-Litigation |
|
--- |
|
|
|
|
Status: Litigation |
|
--- |
|
|
|
|
Status: Non-performing |
|
--- |
|
|
|
|
Status: insolvency proceedings, bankruptcy and suspension of
payments |
|
--- |
|
|
|
|
Other status |
|
--- |
|
|
|
|
Legal and Administrative Proceedings |
|
Unpublished |
--- |
|
|
|
Notices of defaults and enforcement |
|
--- |
--- |
|
--- |
|
Seizures |
|
--- |
--- |
|
--- |
|
Auctions |
|
--- |
--- |
|
--- |
|
Declarations of insolvency and bad debt |
|
--- |
--- |
|
--- |
|
Proceedings heard by the Civil Court |
|
Unpublished |
--- |
|
|
|
Proceedings heard by the Labour Court |
|
Unpublished |
--- |
|
|
> Details
Basis
for scoring
|
Positive Factors |
Adverse Factors |
|
No judicial claims have been detected in the Official
Gazettes, regarding any Entity's outstanding debts with the Tax Bureau or Social
Security administrations, as submitted by Courts of the various court
jurisdictions. No irregular payment performance has been detected based
on information obtained from credit bureaus. The current debt represents a 9.69of the financial
structure. In principle, a decrease in this ratio would indicate an
improvement in the short-term financial situation. Positive Working CapitalThe Company's Working Capital
quality is significant, i.e. much of the Company financing comes from its
equity. A structure is considered optimal if its liquidity level is slightly
above its debt volume as a result of low idleness levels of its financial
resources involved. Debts assumed by the company based on the volume of its
own resources have decreased in the previous financial year. |
It does not have any economic profitability.. It has no
return from the necessary investments in the development of its main activity
in comparison with its assets. It does not have any financial profitability..
MANUFACTURAS CLIMA SAIt does not obtain any financial return as a consequence
of an investment in its own resources which, a priori, might deteriorate its
financial and economic situation. MANUFACTURAS CLIMA SA presents a low turnover of the
current assets , which could indicate an inefficient use of non-current
assets due to the lacking of enough operating income capacity based on the
dedicated assets available for sale. Audit qualifications . The company has submitted the audit
with a qualified opinion, indicating that the financial statements may not
reflect the true picture because of the existence of circumstances that may
be significant. Among the companies with similar characteristics,
MANUFACTURAS CLIMA SA is located in one of the autonomous communities that
have shown lesser business development in Spain. In principle, this feature
hinders the consolidation of companies. |
The information contained in the latest annual statements has led
to a Scoring review for the company.
Probability
of default
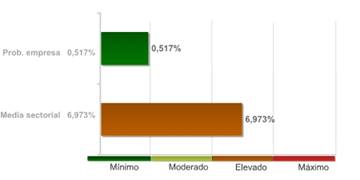
> Estimated Probability
of Default for the next 12 months: 0.517 %
|
Sector in which comparison is carried out: 139 Manufacture of other textiles |
|
|
Relative Position:
|
The company's comparative analysis with the rest of the companies
that comprise the sector, shows the company holds a better position with regard
to the probability of non-compliance.
The 99.00% of the companies of the sector MANUFACTURAS CLIMA SA
belongs to show a higher probability of non-compliance.
The probability of the company's non-compliance with its payment
obligations within deadlines estimated by our qualifications models is 0.517%.
|
In the event they fail to comply with the payment, the seriousness of the loss will depend on factors such as the promptness of the commencement of the charging management, the existence of executive documents which match the credit or the existence of guarantees and free debt assets under the name of the debtor. Therefore, the |
|
|
Summary
of Judicial Claims
|
|
|
|
|
|
|
|
|
||
|
|
|
No se han publicado |
|
|
|
|
No se han publicado |
|
|
|
|
||
|
|
|
No se han publicado |
|
|
|
|
No se han publicado |
|
|
|
|
No se han publicado |
|
|
|
|
No se han publicado |
|
|
|
|
||
|
|
|
No se han publicado |
|
|
|
|
No se han publicado |
|
|
|
|
||
|
|
|
No se han publicado |
|
Link
list
|
BELONGS TO THE
ADMINISTRATION BOARD OF: |
1 Entities |
|
PARTICIPATES
IN: |
1 Entities |
|
SHAREHOLDERS: |
1 Entities |
> Shareholders
|
Relationship |
Entity |
Province |
Shareholding
stake |
|
SHAREHOLDERS |
ACCIONES PROPIAS
DE MANUFACTURAS CLIMA, S.A. |
|
3.91 |
|
PARTICIPATES
IN |
ANDREA HOUSE
SL |
BARCELONA |
50 |
> Other relationships
|
Relationship |
Entity |
Province |
Shareholding
stake |
|
BELONGS TO THE
ADMINISTRATION BOARD OF |
ANDREA HOUSE
SL |
BARCELONA |
|
|
Turnover
|
|
|
Total Sales |
5.889.393,31 |
Financial Accounts and Balance Sheets
|
Ejercicio |
Tipo de Cuentas Anuales |
Fecha Presentacion |
|
2013 |
Normales |
October 2014 |
|
2012 |
Normales |
September 2013 |
|
2011 |
Normales |
August 2012 |
|
2010 |
Normales |
August 2011 |
|
2009 |
Normales |
July 2010 |
|
2008 |
Normales |
July 2009 |
|
2007 |
Normales |
August 2008 |
|
2006 |
Normales |
July 2007 |
|
2005 |
Normales |
July 2006 |
|
2004 |
Normales |
August 2005 |
|
2003 |
Normales |
July 2004 |
|
2002 |
Normales |
July 2003 |
|
2001 |
Normales |
August 2002 |
|
2000 |
Normales |
September 2001 |
|
1999 |
Normales |
August 2000 |
|
1998 |
Normales |
July 1999 |
|
1997 |
Normales |
December 1998 |
|
1996 |
Normales |
August 1997 |
|
1995 |
Normales |
September 1996 |
|
1994 |
Normales |
July 1995 |
|
1993 |
Normales |
September 1994 |
|
1992 |
Normales |
July 1993 |
|
1991 |
Normales |
July 1992 |
|
1990 |
Normales |
August 1991 |
|
1989 |
Normales |
October 1990 |
The data in the report
regarding the last Company Accounts submitted by the company is taken from the TRADE
REGISTER serving the region in which the company's address is located
31/12/2013
> Balance en formato Abreviado de acuerdo al Nuevo Plan
General Contable 2007
Information
corresponding to the fiscal year
2013 2012 2011 2010 2009 is taken from information
submitted to the TRADE REGISTER. Data corresponding to fiscal years before
2013 2012 2011 2010 2009 has been compiled based on
the equivalence criteria stipulated in Act JUS/206/2009. Where the provisions
of the Act did not establish relevant equivalence criteria, axesor created such
criteria using its own methodology. To view details on the methodology.
|
|
ORIGINAL |
ORIGINAL |
ORIGINAL |
ORIGINAL |
ORIGINAL |
|
|
Assets |
2013 |
2012 |
2011 |
2010 |
2009 |
|
|
A) NON-CURRENT ASSETS: 11000 |
563.004,00 |
381.657,00 |
245.651,00 |
241.877,00 |
155.117,00 |
|
|
I. Intangible fixed assets : 11100 |
2.890,00 |
5.306,00 |
2.134,00 |
0,00 |
632,00 |
|
|
II. Tangible fixed assets : 11200 |
57.011,00 |
34.196,00 |
38.180,00 |
45.412,00 |
58.020,00 |
|
|
III. Real estate investment: 11300 |
0,00 |
0,00 |
0,00 |
0,00 |
0,00 |
|
|
IV. Long-term investments in Group companies
and associates : 11400 |
30.000,00 |
30.000,00 |
30.000,00 |
30.000,00 |
30.000,00 |
|
|
V. Long-term financial investments:
11500 |
422.915,00 |
265.782,00 |
175.337,00 |
166.464,00 |
66.464,00 |
|
|
VI. Assets for deferred tax : 11600 |
50.187,00 |
46.374,00 |
0,00 |
0,00 |
0,00 |
|
|
VII. Non-current trade debtors :
11700 |
0,00 |
0,00 |
0,00 |
0,00 |
0,00 |
|
|
B) CURRENT ASSETS: 12000 |
8.304.351,00 |
9.149.522,00 |
9.905.057,00 |
10.977.726,00 |
9.517.376,00 |
|
|
I. Non-current assets held for sale :
12100 |
0,00 |
0,00 |
0,00 |
0,00 |
0,00 |
|
|
II. Stocks: 12200 |
2.234.052,00 |
2.420.516,00 |
2.010.828,00 |
2.249.963,00 |
1.679.587,00 |
|
|
III. Trade debtors and others receivable
accounts: 12300 |
2.600.502,00 |
2.637.043,00 |
2.898.172,00 |
4.245.836,00 |
3.320.114,00 |
|
|
1.- Customers for
sales and provisions of services : 12380 |
2.444.099,00 |
2.479.304,00 |
2.692.629,00 |
3.940.858,00 |
3.217.111,00 |
|
|
a) Long-term receivables from sales and services supplied : 12381 |
0,00 |
0,00 |
0,00 |
0,00 |
0,00 |
|
|
b)
Customers for sales and provisions of services : 12382 |
2.444.099,00 |
2.479.304,00 |
2.692.629,00 |
3.940.858,00 |
3.217.111,00 |
|
|
2.- Called up share
capital : 12370 |
0,00 |
0,00 |
0,00 |
0,00 |
0,00 |
|
|
3.- Other accounts
receivable : 12390 |
156.403,00 |
157.739,00 |
205.544,00 |
304.978,00 |
103.003,00 |
|
|
IV. Short-term investments in Group
companies and associates: 12400 |
0,00 |
0,00 |
200.000,00 |
0,00 |
0,00 |
|
|
V. Short-term financial investments :
12500 |
1.486.016,00 |
1.794.504,00 |
2.072.642,00 |
1.791.055,00 |
1.377.000,00 |
|
|
VI. Short-term accruals: 12600 |
111.721,00 |
77.468,00 |
76.370,00 |
21.360,00 |
35.723,00 |
|
|
VII. Cash and other equivalent liquid
assets : 12700 |
1.872.059,00 |
2.219.991,00 |
2.647.045,00 |
2.669.513,00 |
3.104.952,00 |
|
|
TOTAL ASSETS (A + B) : 10000 |
8.867.354,00 |
9.531.179,00 |
10.150.709,00 |
11.219.603,00 |
9.672.492,00 |
|
|
|
ORIGINAL |
ORIGINAL |
ORIGINAL |
ORIGINAL |
ORIGINAL |
|
|
Liabilities and Net Worth |
2013 |
2012 |
2011 |
2010 |
2009 |
|
|
A) NET WORTH: 20000 |
7.983.884,00 |
8.010.785,00 |
8.005.234,00 |
7.554.636,00 |
7.657.490,00 |
|
|
A1) Shareholders' equity :
21000 |
7.974.193,00 |
8.098.812,00 |
8.005.234,00 |
7.554.636,00 |
7.657.490,00 |
|
|
I. Capital:
21100 |
230.789,00 |
230.789,00 |
230.789,00 |
230.789,00 |
315.832,00 |
|
|
1.- Registered capital: 21110 |
230.789,00 |
230.789,00 |
230.789,00 |
230.789,00 |
315.832,00 |
|
|
2.- (Uncalled capital) : 21120 |
0,00 |
0,00 |
0,00 |
0,00 |
0,00 |
|
|
II. Share premium:
21200 |
1.262,00 |
1.262,00 |
1.262,00 |
1.262,00 |
1.262,00 |
|
|
III. Reserves:
21300 |
7.866.762,00 |
7.767.704,00 |
7.275.786,00 |
6.374.291,00 |
6.564.286,00 |
|
|
IV. (Common stock
equity): 21400 |
0,00 |
0,00 |
-14.521,00 |
-14.521,00 |
-14.521,00 |
|
|
V. Profit or loss
brought forward: 21500 |
0,00 |
0,00 |
0,00 |
0,00 |
0,00 |
|
|
VI. Other
shareholders' contributions: 21600 |
0,00 |
0,00 |
0,00 |
0,00 |
0,00 |
|
|
VII. Result of the
period: 21700 |
-124.619,00 |
99.057,00 |
511.919,00 |
962.814,00 |
790.631,00 |
|
|
VIII. (Interim
dividend): 21800 |
0,00 |
0,00 |
0,00 |
0,00 |
0,00 |
|
|
IX. Other net worth instruments:
21900 |
0,00 |
0,00 |
0,00 |
0,00 |
0,00 |
|
|
A-2) Adjustments due to changes in value:
22000 |
9.691,00 |
-88.027,00 |
0,00 |
0,00 |
0,00 |
|
|
A-3) Received subsidies, donations and
legacies: 23000 |
0,00 |
0,00 |
0,00 |
0,00 |
0,00 |
|
|
B) NON-CURRENT LIABILITIES: 31000 |
24.051,00 |
0,00 |
1.738,00 |
336.226,00 |
3.752,00 |
|
|
I. Long-term provisions: 31100 |
0,00 |
0,00 |
0,00 |
0,00 |
0,00 |
|
|
II. Long-term creditors : 31200 |
19.898,00 |
0,00 |
0,00 |
334.000,00 |
0,00 |
|
|
1.- Amounts owed to
credit institutions: 31220 |
0,00 |
0,00 |
0,00 |
0,00 |
0,00 |
|
|
2.- Creditors from
financial leasing : 31230 |
19.898,00 |
0,00 |
0,00 |
0,00 |
0,00 |
|
|
3.- Other long-term
creditors : 31290 |
0,00 |
0,00 |
0,00 |
334.000,00 |
0,00 |
|
|
III. Long-term debts with Group companies
and associates: 31300 |
0,00 |
0,00 |
0,00 |
0,00 |
0,00 |
|
|
IV. Liabilities for deferred tax:
31400 |
4.153,00 |
0,00 |
1.738,00 |
2.226,00 |
3.752,00 |
|
|
V. Long-term accruals: 31500 |
0,00 |
0,00 |
0,00 |
0,00 |
0,00 |
|
|
VI. Non-current trade creditors :
31600 |
0,00 |
0,00 |
0,00 |
0,00 |
0,00 |
|
|
VII. Special long-term debts : 31700 |
0,00 |
0,00 |
0,00 |
0,00 |
0,00 |
|
|
C) CURRENT LIABILITIES : 32000 |
859.419,00 |
1.520.394,00 |
2.143.736,00 |
3.328.742,00 |
2.011.250,00 |
|
|
I. Liabilities linked to non-current assets
held for sale : 32100 |
0,00 |
0,00 |
0,00 |
0,00 |
0,00 |
|
|
II. Short-term provisions: 32200 |
0,00 |
0,00 |
0,00 |
0,00 |
0,00 |
|
|
III. Short-term creditors : 32300 |
347.853,00 |
295.949,00 |
632.692,00 |
835.496,00 |
377.770,00 |
|
|
1.- Amounts owed to
credit institutions: 32320 |
336.760,00 |
295.949,00 |
298.692,00 |
499.928,00 |
377.770,00 |
|
|
2.- Creditors from
financial leasing : 32330 |
11.094,00 |
0,00 |
0,00 |
0,00 |
0,00 |
|
|
3.- Other short-term
creditors : 32390 |
0,00 |
0,00 |
334.000,00 |
335.568,00 |
0,00 |
|
|
IV. Short-term debts with Group companies
and associates: 32400 |
0,00 |
0,00 |
0,00 |
0,00 |
0,00 |
|
|
V. Trade creditors and other accounts
payable: 32500 |
511.566,00 |
1.224.445,00 |
1.511.044,00 |
2.493.245,00 |
1.633.481,00 |
|
|
1.- Suppliers:
32580 |
212.488,00 |
727.344,00 |
877.839,00 |
954.521,00 |
482.944,00 |
|
|
a) Long-term debts : 32581 |
0,00 |
0,00 |
0,00 |
0,00 |
0,00 |
|
|
b) Short-term debts : 32582 |
212.488,00 |
727.344,00 |
877.839,00 |
954.521,00 |
482.944,00 |
|
|
2.- Other creditors :
32590 |
299.078,00 |
497.101,00 |
633.205,00 |
1.538.724,00 |
1.150.537,00 |
|
|
VI. Short-term accruals: 32600 |
0,00 |
0,00 |
0,00 |
0,00 |
0,00 |
|
|
VII. Special short-term debts : 32700 |
0,00 |
0,00 |
0,00 |
0,00 |
0,00 |
|
|
TOTAL NET WORTH AND LIABILITIES (A + B + C) : 30000 |
8.867.354,00 |
9.531.179,00 |
10.150.709,00 |
11.219.603,00 |
9.672.492,00 |
|
|
|
ORIGINAL |
ORIGINAL |
ORIGINAL |
ORIGINAL |
ORIGINAL |
|
|
Profit and Loss |
2013 |
2012 |
2011 |
2010 |
2009 |
|
|
1. Net turnover: 40100 |
5.889.393,00 |
5.556.957,00 |
7.532.498,00 |
10.592.163,00 |
8.496.780,00 |
|
|
2. Changes in stocks of finished goods and
work in progress: 40200 |
0,00 |
0,00 |
0,00 |
0,00 |
0,00 |
|
|
3. Works carried out by the company for its
assets: 40300 |
0,00 |
0,00 |
0,00 |
0,00 |
0,00 |
|
|
4. Supplies : 40400 |
-3.575.004,00 |
-3.255.932,00 |
-4.469.959,00 |
-6.053.605,00 |
-4.663.965,00 |
|
|
5. Other operating income: 40500 |
308.696,00 |
356.874,00 |
334.522,00 |
271.828,00 |
337.275,00 |
|
|
6. Personnel costs: 40600 |
-1.278.546,00 |
-1.285.634,00 |
-1.240.290,00 |
-1.213.050,00 |
-1.159.016,00 |
|
|
7. Other operating costs: 40700 |
-1.508.428,00 |
-1.418.763,00 |
-1.685.300,00 |
-2.207.363,00 |
-1.919.657,00 |
|
|
8. Amortisation of fixed assets:
40800 |
-17.448,00 |
-13.717,00 |
-17.708,00 |
-25.067,00 |
-32.199,00 |
|
|
9. Allocation of subsidies of non-financial
fixed assets and other: 40900 |
0,00 |
0,00 |
0,00 |
0,00 |
0,00 |
|
|
10. Excess provisions : 41000 |
0,00 |
0,00 |
0,00 |
0,00 |
0,00 |
|
|
11. Impairment and result of transfers of
fixed assets: 41100 |
0,00 |
0,00 |
0,00 |
0,00 |
0,00 |
|
|
12. Negative difference in combined
businesses: 41200 |
0,00 |
0,00 |
0,00 |
0,00 |
0,00 |
|
|
13. Other results : 41300 |
-2.337,00 |
6.974,00 |
2.591,00 |
3.518,00 |
1.011,00 |
|
|
A) OPERATING INCOME (1 + 2 + 3 + 4 + 5 + 6 + 7 + 8 + 9 + 10 + 11
+ 12 + 13) : 49100 |
-183.674,00 |
-53.242,00 |
456.355,00 |
1.368.425,00 |
1.060.228,00 |
|
|
14. Financial income : 41400 |
70.844,00 |
209.592,00 |
285.420,00 |
67.296,00 |
92.165,00 |
|
|
a) Allocation of
financial subsidies, donations and legacies: 41430 |
0,00 |
0,00 |
0,00 |
0,00 |
0,00 |
|
|
b) Other financial
income: 41490 |
70.844,00 |
209.592,00 |
285.420,00 |
67.296,00 |
92.165,00 |
|
|
15. Financial expenditure: 41500 |
-11.515,00 |
-18.164,00 |
-32.144,00 |
-14.350,00 |
-11.395,00 |
|
|
16. Changes in fair value of financial
instruments : 41600 |
-3.114,00 |
0,00 |
1.515,00 |
565,00 |
0,00 |
|
|
17. Exchange rate differences : 41700 |
-35.632,00 |
-47.776,00 |
-54.966,00 |
-49.092,00 |
-33.983,00 |
|
|
18. Impairment and result for transfers of
financial instruments: 41800 |
-3.069,00 |
0,00 |
-10.582,00 |
-4.325,00 |
0,00 |
|
|
19. Other financial income and expenditure:
42100 |
0,00 |
0,00 |
0,00 |
0,00 |
0,00 |
|
|
a) Incorporation of
financial expenditure to assets: 42110 |
0,00 |
0,00 |
0,00 |
0,00 |
0,00 |
|
|
b) Financial income
from arrangement with creditors: 42120 |
0,00 |
0,00 |
0,00 |
0,00 |
0,00 |
|
|
c) Other income and
expenditure: 42130 |
0,00 |
0,00 |
0,00 |
0,00 |
0,00 |
|
|
B) FINANCIAL REVENUE (14 + 15 + 16 + 17 + 18 + 19) : 49200 |
17.515,00 |
143.651,00 |
189.243,00 |
94,00 |
46.787,00 |
|
|
C) NET RESULT BEFORE TAXES (A + B) : 49300 |
-166.159,00 |
90.410,00 |
645.598,00 |
1.368.519,00 |
1.107.016,00 |
|
|
20. Income taxes: 41900 |
41.540,00 |
8.648,00 |
-133.679,00 |
-405.705,00 |
-316.384,00 |
|
|
D) RESULT OF THE PERIOD (C + 20) : 49500 |
-124.619,00 |
99.057,00 |
511.919,00 |
962.814,00 |
790.631,00 |
|
> Normal Balance Sheet under the rules of the 1990 General
Accounting Plan (repealed since 1st January of 2008)
Information corresponding
to the fiscal year 2013 2012 2011 2010 2009 has been
compiled based on the equivalence criteria stipulated in Act JUS/206/2009.
Where the provisions of the Act did not establish relevant equivalence
criteria, Axesor created such criteria using its own methodology. To view
details on the methodology 2013 2012 2011 2010 2009
is taken from information submitted to the TRADE REGISTER.
|
|
EQUIVALENCIA |
EQUIVALENCIA |
EQUIVALENCIA |
EQUIVALENCIA |
EQUIVALENCIA |
|
|
ASSETS |
2013 |
2012 |
2011 |
2010 |
2009 |
|
|
A) SHAREHOLDERS (PARTNERS) BY UNCALLED SUSCRIBED CAPITAL: |
0,00 |
0,00 |
0,00 |
0,00 |
0,00 |
|
|
B) FIXED ASSETS: |
512.816,00 |
335.284,00 |
260.172,00 |
256.397,00 |
169.637,00 |
|
|
I. Formation expenses: |
0,00 |
0,00 |
0,00 |
0,00 |
0,00 |
|
|
II. Intangible fixed assets: |
2.890,00 |
5.306,00 |
2.134,00 |
0,00 |
632,00 |
|
|
1. Research and
development costs: |
0,00 |
0,00 |
0,00 |
0,00 |
0,00 |
|
|
2. Concessions,
patents, licences, trademarks et al.: |
0,00 |
0,00 |
0,00 |
0,00 |
0,00 |
|
|
3. Goodwill: |
0,00 |
0,00 |
0,00 |
0,00 |
0,00 |
|
|
4. Key money paid for
premises: |
0,00 |
0,00 |
0,00 |
0,00 |
0,00 |
|
|
5. Software: |
0,00 |
5.306,00 |
2.134,00 |
0,00 |
632,00 |
|
|
6. Assets under
capital leases: |
0,00 |
0,00 |
0,00 |
0,00 |
0,00 |
|
|
7. Payments on
account: |
0,00 |
0,00 |
0,00 |
0,00 |
0,00 |
|
|
8. Provisions: |
0,00 |
0,00 |
0,00 |
0,00 |
0,00 |
|
|
9. Accumulated
depreciation: |
0,00 |
0,00 |
0,00 |
0,00 |
0,00 |
|
|
III. Tangible fixed assets: |
57.011,00 |
34.196,00 |
38.180,00 |
45.412,00 |
58.020,00 |
|
|
1. Land and
construction: |
0,00 |
2.597,00 |
3.542,00 |
4.486,00 |
6.483,00 |
|
|
2. Technical
installations and machinery: |
0,00 |
11.611,00 |
12.728,00 |
15.039,00 |
18.938,00 |
|
|
3. Other
installations, tools and furniture: |
0,00 |
11.163,00 |
12.238,00 |
14.459,00 |
18.208,00 |
|
|
4. Payments on account
and tangible fixed assets under construction: |
0,00 |
0,00 |
0,00 |
0,00 |
0,00 |
|
|
5. Other tangible
assets: |
0,00 |
8.824,00 |
9.673,00 |
11.429,00 |
14.392,00 |
|
|
6. Provisions: |
0,00 |
0,00 |
0,00 |
0,00 |
0,00 |
|
|
7. Accumulated depreciation:
|
0,00 |
0,00 |
0,00 |
0,00 |
0,00 |
|
|
IV. Financial investments: |
452.915,00 |
295.782,00 |
205.337,00 |
196.464,00 |
96.464,00 |
|
|
1. Equity investments
in group companies: |
45.937,00 |
30.000,00 |
30.000,00 |
30.000,00 |
30.000,00 |
|
|
2. Receivables from
group companies: |
0,00 |
0,00 |
0,00 |
0,00 |
0,00 |
|
|
3. Equity investment
in associated companies: |
0,00 |
0,00 |
0,00 |
0,00 |
0,00 |
|
|
4. Credits to
associated companies: |
0,00 |
0,00 |
0,00 |
0,00 |
0,00 |
|
|
5. Long-term
securities portfolio: |
397.079,00 |
259.318,00 |
168.873,00 |
160.000,00 |
60.000,00 |
|
|
6. Other receivables:
|
0,00 |
0,00 |
0,00 |
0,00 |
0,00 |
|
|
7. Long term
guarantees and deposits: |
9.898,00 |
6.464,00 |
6.464,00 |
6.464,00 |
6.464,00 |
|
|
8. Provisions: |
0,00 |
0,00 |
0,00 |
0,00 |
0,00 |
|
|
9. Long-term
receivables from public bodies: |
0,00 |
0,00 |
0,00 |
0,00 |
0,00 |
|
|
V. Own shares: |
0,00 |
0,00 |
14.521,00 |
14.521,00 |
14.521,00 |
|
|
VI. Long-term trade receivables: |
0,00 |
0,00 |
0,00 |
0,00 |
0,00 |
|
|
C) Deferred expenses: |
0,00 |
0,00 |
0,00 |
0,00 |
0,00 |
|
|
D) CURRENT ASSETS: |
8.354.538,00 |
9.195.895,00 |
9.905.057,00 |
10.977.726,00 |
9.517.376,00 |
|
|
I. Called-up share capital (not paid):
|
0,00 |
0,00 |
0,00 |
0,00 |
0,00 |
|
|
II. Stocks: |
2.234.052,00 |
2.420.516,00 |
2.010.828,00 |
2.249.963,00 |
1.679.587,00 |
|
|
1. Goods for resale:
|
2.208.771,00 |
2.393.124,00 |
2.010.828,00 |
2.181.152,00 |
1.619.485,00 |
|
|
2. Raw materials and
other consumables: |
0,00 |
0,00 |
0,00 |
0,00 |
0,00 |
|
|
3. Goods in process
and semifinished ones: |
0,00 |
0,00 |
0,00 |
0,00 |
0,00 |
|
|
4. Finished products:
|
0,00 |
0,00 |
0,00 |
0,00 |
0,00 |
|
|
5. Byproducts, scrap
and recovered materials: |
0,00 |
0,00 |
0,00 |
0,00 |
0,00 |
|
|
6. Payments on
account: |
25.282,00 |
27.392,00 |
0,00 |
68.811,00 |
60.102,00 |
|
|
7. Provisions: |
0,00 |
0,00 |
0,00 |
0,00 |
0,00 |
|
|
III. Debtors: |
2.650.689,00 |
2.683.417,00 |
2.898.172,00 |
4.245.836,00 |
3.320.114,00 |
|
|
1. Trade debtors /
accounts receivable: |
2.449.066,00 |
2.479.304,00 |
2.692.629,00 |
3.940.858,00 |
3.217.111,00 |
|
|
2. Accounts
receivable, Group companies: |
75.290,00 |
76.220,00 |
72.973,00 |
69.103,00 |
79.412,00 |
|
|
3. Accounts
receivable, associated companies: |
0,00 |
0,00 |
0,00 |
0,00 |
0,00 |
|
|
4. Other debtors:
|
2.924,00 |
2.960,00 |
12.266,00 |
14.759,00 |
14.857,00 |
|
|
5. Staff: |
0,00 |
0,00 |
800,00 |
0,00 |
0,00 |
|
|
6. Public bodies:
|
123.410,00 |
124.933,00 |
119.505,00 |
221.115,00 |
8.734,00 |
|
|
7. Provisions: |
0,00 |
0,00 |
0,00 |
0,00 |
0,00 |
|
|
IV. Short-term investments: |
1.486.016,00 |
1.794.504,00 |
2.272.642,00 |
2.314.871,00 |
1.377.000,00 |
|
|
1. Equity investments
in group companies: |
0,00 |
0,00 |
0,00 |
0,00 |
0,00 |
|
|
2. Receivables from
group companies: |
0,00 |
0,00 |
0,00 |
0,00 |
0,00 |
|
|
3. Equity investment
in associated companies: |
0,00 |
0,00 |
0,00 |
0,00 |
0,00 |
|
|
4. Credits to
associated companies: |
0,00 |
0,00 |
0,00 |
0,00 |
0,00 |
|
|
5. Short term
securities portfolio: |
57.967,00 |
70.000,00 |
381.257,00 |
814.871,00 |
932.000,00 |
|
|
6. Other receivables:
|
124.582,00 |
150.444,00 |
350.444,00 |
0,00 |
0,00 |
|
|
7. Shor term
guarantees and deposits: |
1.303.468,00 |
1.574.059,00 |
1.540.941,00 |
1.500.000,00 |
445.000,00 |
|
|
8. Provisions: |
0,00 |
0,00 |
0,00 |
0,00 |
0,00 |
|
|
V. Short-term treasury shares: |
0,00 |
0,00 |
0,00 |
0,00 |
0,00 |
|
|
VI. Cash at bank and in hand: |
1.872.059,00 |
2.219.991,00 |
2.647.045,00 |
2.145.696,00 |
3.104.952,00 |
|
|
VII. Prepayments and accrued income: |
111.721,00 |
77.468,00 |
76.370,00 |
21.360,00 |
35.723,00 |
|
|
GENERAL TOTAL (A + B + C + D): |
8.867.354,00 |
9.531.179,00 |
10.165.229,00 |
11.234.124,00 |
9.687.013,00 |
|
MERCANTILE
REGISTRY
|
|
EQUIVALENCIA |
EQUIVALENCIA |
EQUIVALENCIA |
EQUIVALENCIA |
EQUIVALENCIA |
|
|
LIABILITIES |
2013 |
2012 |
2011 |
2010 |
2009 |
|
|
A) EQUITY: |
7.983.884,00 |
8.010.785,00 |
8.019.755,00 |
7.569.156,00 |
7.672.011,00 |
|
|
I. Subscribed capital: |
230.789,00 |
230.789,00 |
230.789,00 |
230.789,00 |
315.832,00 |
|
|
II. Share premium: |
1.262,00 |
1.262,00 |
1.262,00 |
1.262,00 |
1.262,00 |
|
|
III. Revaluation reserves: |
0,00 |
0,00 |
0,00 |
0,00 |
0,00 |
|
|
IV. Reserves: |
7.876.453,00 |
7.679.677,00 |
7.275.786,00 |
6.374.291,00 |
6.564.286,00 |
|
|
1. Legal reserve:
|
128.214,00 |
125.011,00 |
125.011,00 |
125.011,00 |
125.011,00 |
|
|
2. Reserves for own
shares: |
69.461,00 |
67.726,00 |
63.366,00 |
55.378,00 |
57.062,00 |
|
|
3. Reserves for shares
of the controlling company: |
0,00 |
0,00 |
0,00 |
0,00 |
0,00 |
|
|
4. Statutory reserves:
|
0,00 |
0,00 |
0,00 |
0,00 |
0,00 |
|
|
5. Miscellaneous
reserves: |
7.678.778,00 |
7.486.941,00 |
7.087.409,00 |
6.193.903,00 |
6.382.214,00 |
|
|
Differences due to
capital adjustement to euros: |
0,00 |
0,00 |
0,00 |
0,00 |
0,00 |
|
|
V. Profit or loss brought forward: |
0,00 |
0,00 |
0,00 |
0,00 |
0,00 |
|
|
1. Retained earnings:
|
0,00 |
0,00 |
0,00 |
0,00 |
0,00 |
|
|
2. Prior year losses:
|
0,00 |
0,00 |
0,00 |
0,00 |
0,00 |
|
|
3. Partners'
contributions so as to compensate losses: |
0,00 |
0,00 |
0,00 |
0,00 |
0,00 |
|
|
VI. Profit or loss for the financial year:
|
-124.619,00 |
99.057,00 |
511.919,00 |
962.814,00 |
790.631,00 |
|
|
VII. Interim dividend paid: |
0,00 |
0,00 |
0,00 |
0,00 |
0,00 |
|
|
VIII. Own shares for capital reduction:
|
0,00 |
0,00 |
0,00 |
0,00 |
0,00 |
|
|
B) Deferred income: |
0,00 |
0,00 |
0,00 |
0,00 |
0,00 |
|
|
1. Capital grants:
|
0,00 |
0,00 |
0,00 |
0,00 |
0,00 |
|
|
2. Unrealised exchange
gains: |
0,00 |
0,00 |
0,00 |
0,00 |
0,00 |
|
|
3. Other deferred
income: |
0,00 |
0,00 |
0,00 |
0,00 |
0,00 |
|
|
4. Public revenues to
distribute in several financial years: |
0,00 |
0,00 |
0,00 |
0,00 |
0,00 |
|
|
C) PROVISIONS FOR LIABILITIES AND CHARGES: |
0,00 |
0,00 |
0,00 |
0,00 |
0,00 |
|
|
1. Provisions for
pension fund and other similar obligations: |
0,00 |
0,00 |
0,00 |
0,00 |
0,00 |
|
|
2. Provisions for
taxes: |
0,00 |
0,00 |
0,00 |
0,00 |
0,00 |
|
|
3. Other provisions:
|
0,00 |
0,00 |
0,00 |
0,00 |
0,00 |
|
|
4. Reversion fund:
|
0,00 |
0,00 |
0,00 |
0,00 |
0,00 |
|
|
D) LONG TERM LIABILITIES: |
24.051,00 |
0,00 |
1.738,00 |
336.226,00 |
3.752,00 |
|
|
I. Issued debentures and other marketable
securities: |
0,00 |
0,00 |
0,00 |
0,00 |
0,00 |
|
|
1. Non-convertible
debentures: |
0,00 |
0,00 |
0,00 |
0,00 |
0,00 |
|
|
2. Convertible
debentures: |
0,00 |
0,00 |
0,00 |
0,00 |
0,00 |
|
|
3. Other debt
securities: |
0,00 |
0,00 |
0,00 |
0,00 |
0,00 |
|
|
II. Amounts owed to credit institutions:
|
19.898,00 |
0,00 |
0,00 |
0,00 |
0,00 |
|
|
1. Loans and other
liabilities: |
0,00 |
0,00 |
0,00 |
0,00 |
0,00 |
|
|
2. Long-term
liabilities from capital leases: |
19.898,00 |
0,00 |
0,00 |
0,00 |
0,00 |
|
|
III. Debts with companies of the group and
affiliated ones: |
0,00 |
0,00 |
0,00 |
0,00 |
0,00 |
|
|
1. Amounts owed to
group companies: |
0,00 |
0,00 |
0,00 |
0,00 |
0,00 |
|
|
2. Amounts owed to associated
companies: |
0,00 |
0,00 |
0,00 |
0,00 |
0,00 |
|
|
IV. Other creditors: |
4.153,00 |
0,00 |
1.738,00 |
336.226,00 |
3.752,00 |
|
|
1. Long-term bills of
exchange payable: |
0,00 |
0,00 |
0,00 |
0,00 |
0,00 |
|
|
2. Other creditors:
|
0,00 |
0,00 |
0,00 |
334.000,00 |
0,00 |
|
|
3. Long term
guarantees and deposits received: |
0,00 |
0,00 |
0,00 |
0,00 |
0,00 |
|
|
4. Long term payables
to public bodies: |
4.153,00 |
0,00 |
1.738,00 |
2.226,00 |
3.752,00 |
|
|
V. Unpaid portion of equity investment:
|
0,00 |
0,00 |
0,00 |
0,00 |
0,00 |
|
|
1. Group companies:
|
0,00 |
0,00 |
0,00 |
0,00 |
0,00 |
|
|
2. Associated
companies: |
0,00 |
0,00 |
0,00 |
0,00 |
0,00 |
|
|
3. Third parties:
|
0,00 |
0,00 |
0,00 |
0,00 |
0,00 |
|
|
VI. Long term trade creditors: |
0,00 |
0,00 |
0,00 |
0,00 |
0,00 |
|
|
E) SHORT TERM CREDITORS: |
859.419,00 |
1.520.394,00 |
2.143.736,00 |
3.328.742,00 |
2.011.250,00 |
|
|
I. Issued debentures and other marketable
securities: |
0,00 |
0,00 |
0,00 |
0,00 |
0,00 |
|
|
1. Non-convertible debentures:
|
0,00 |
0,00 |
0,00 |
0,00 |
0,00 |
|
|
2. Convertible
debentures: |
0,00 |
0,00 |
0,00 |
0,00 |
0,00 |
|
|
3. Other debt
securities: |
0,00 |
0,00 |
0,00 |
0,00 |
0,00 |
|
|
4. Accrued interest on
debentures and other debt securities: |
0,00 |
0,00 |
0,00 |
0,00 |
0,00 |
|
|
II. Amounts owed to credit institutions:
|
347.853,00 |
295.949,00 |
298.692,00 |
499.928,00 |
377.770,00 |
|
|
1. Loans and other
liabilities: |
336.760,00 |
295.949,00 |
298.692,00 |
499.928,00 |
377.770,00 |
|
|
2. Accrued interest on
liabilities with credit institutions: |
0,00 |
0,00 |
0,00 |
0,00 |
0,00 |
|
|
3. Short-term
liabilities from capital leases: |
11.094,00 |
0,00 |
0,00 |
0,00 |
0,00 |
|
|
III. Short-term amounts owed to group and
associated companies: |
219,00 |
1.127,00 |
1.274,00 |
1.532,00 |
0,00 |
|
|
1. Amounts owed to
group companies: |
219,00 |
1.127,00 |
1.274,00 |
1.532,00 |
0,00 |
|
|
2. Amounts owed to
associated companies: |
0,00 |
0,00 |
0,00 |
0,00 |
0,00 |
|
|
IV. Trade creditors: |
511.346,00 |
1.091.387,00 |
1.296.014,00 |
2.127.465,00 |
1.354.144,00 |
|
|
1. Advanced payments
from customers: |
0,00 |
0,00 |
0,00 |
0,00 |
0,00 |
|
|
2. Amounts owed for
purchases of goods or services: |
212.269,00 |
1.091.387,00 |
1.296.014,00 |
2.127.465,00 |
1.354.144,00 |
|
|
3. Debts represented
by notes payable: |
299.078,00 |
0,00 |
0,00 |
0,00 |
0,00 |
|
|
V. Other creditors: |
0,00 |
131.931,00 |
547.756,00 |
699.816,00 |
279.337,00 |
|
|
1. Public bodies:
|
0,00 |
74.002,00 |
157.330,00 |
308.553,00 |
222.501,00 |
|
|
2. Bills of exchange
payable: |
0,00 |
0,00 |
0,00 |
0,00 |
0,00 |
|
|
3. Miscellaneous
debts: |
0,00 |
0,00 |
334.000,00 |
335.568,00 |
0,00 |
|
|
4. Wages and salaries
payable: |
0,00 |
57.930,00 |
56.426,00 |
55.696,00 |
56.836,00 |
|
|
5. Guarantees and
deposits received at short term: |
0,00 |
0,00 |
0,00 |
0,00 |
0,00 |
|
|
VI. Provisions: |
0,00 |
0,00 |
0,00 |
0,00 |
0,00 |
|
|
VII. Prepayments and accrued income: |
0,00 |
0,00 |
0,00 |
0,00 |
0,00 |
|
|
F) SHORT-TERM PROVISIONS FOR LIABILITIES AND CHARGES: |
0,00 |
0,00 |
0,00 |
0,00 |
0,00 |
|
|
GENERAL TOTAL (A + B + C + D + E + F): |
8.867.354,00 |
9.531.179,00 |
10.165.229,00 |
11.234.124,00 |
9.687.013,00 |
|
MERCANTILE
REGISTRY.
|
|
EQUIVALENCIA |
EQUIVALENCIA |
EQUIVALENCIA |
EQUIVALENCIA |
EQUIVALENCIA |
|
|
DEBIT |
2013 |
2012 |
2011 |
2010 |
2009 |
|
|
A) CHARGES (A.1 to A.15): |
6.393.553,00 |
6.031.339,00 |
7.644.628,00 |
9.972.557,00 |
8.136.600,00 |
|
|
A.1. Operating
consumption: |
3.575.004,00 |
3.255.932,00 |
4.469.959,00 |
6.053.605,00 |
4.663.965,00 |
|
|
A.2. Staff Costs:
|
1.278.546,00 |
1.285.634,00 |
1.240.290,00 |
1.213.050,00 |
1.159.016,00 |
|
|
a) Wages, salaries et al.: |
1.027.603,00 |
1.033.300,00 |
996.855,00 |
974.962,00 |
931.534,00 |
|
|
b) Social security costs: |
250.943,00 |
252.334,00 |
243.434,00 |
238.088,00 |
227.483,00 |
|
|
A.3. Depreciation
expense: |
17.448,00 |
13.717,00 |
17.708,00 |
25.067,00 |
32.199,00 |
|
|
A.4. Variation of
trade provisions and losses of unrecovered receivables: |
0,00 |
0,00 |
0,00 |
0,00 |
0,00 |
|
|
A.5. Other operating
charges: |
1.508.428,00 |
1.418.763,00 |
1.685.300,00 |
2.207.363,00 |
1.919.657,00 |
|
|
A.I. OPERATING BENEFITS
(B.1-A.1-A.2-A.3-A.4-A.5): |
0,00 |
0,00 |
453.764,00 |
1.364.906,00 |
1.059.218,00 |
|
|
A.6. Financial and
similar charges: |
14.584,00 |
18.164,00 |
42.726,00 |
18.675,00 |
11.395,00 |
|
|
a) Due to liabilities with companies of the group: |
0,00 |
0,00 |
0,00 |
0,00 |
0,00 |
|
|
b) Due to liabilities with associated companies: |
0,00 |
0,00 |
0,00 |
0,00 |
0,00 |
|
|
c) Due to other debts: |
11.515,00 |
18.164,00 |
32.144,00 |
14.350,00 |
11.395,00 |
|
|
d) Losses from financial investments: |
3.069,00 |
0,00 |
10.582,00 |
4.325,00 |
0,00 |
|
|
A.7. Financial
investment provision change: |
3.114,00 |
0,00 |
0,00 |
0,00 |
0,00 |
|
|
A.8. Exchange losses:
|
35.632,00 |
47.776,00 |
54.966,00 |
49.092,00 |
33.983,00 |
|
|
A.II. POSITIVE FINANCIAL RESULTS
(B.2+B.3-A.6-A.7-A.8): |
17.515,00 |
143.651,00 |
189.243,00 |
94,00 |
46.787,00 |
|
|
A.III. PROFIT FROM ORDINARY ACTIVITIES
(A.I+A.II-B.I-B.II): |
0,00 |
83.436,00 |
643.007,00 |
1.365.000,00 |
1.106.005,00 |
|
|
A.9. Changes in
provisions for intangible, tangible and securities portfolio: |
0,00 |
0,00 |
0,00 |
0,00 |
0,00 |
|
|
A.10. Losses from
tangible and intangible fixed assets and portfolio: |
0,00 |
0,00 |
0,00 |
0,00 |
0,00 |
|
|
A.11. Losses from
transactions with own shares and debentures: |
0,00 |
0,00 |
0,00 |
0,00 |
0,00 |
|
|
A.12. Extraordinary
expenses: |
2.337,00 |
0,00 |
0,00 |
0,00 |
0,00 |
|
|
A.13. Prior year
expenses and losses: |
0,00 |
0,00 |
0,00 |
0,00 |
0,00 |
|
|
A.IV. EXTRAORDINARY PROFIT
(B.4+B.5+B.6+B.7+B.8-A.9-A.10-A.11-A.12-A.13): |
0,00 |
6.974,00 |
2.591,00 |
3.518,00 |
1.011,00 |
|
|
A.V. PROFIT BEFORE TAXES
(A.III+A.IV-B.III-B.IV): |
0,00 |
90.410,00 |
645.598,00 |
1.368.519,00 |
1.107.016,00 |
|
|
A.14. Corporation Tax:
|
-41.540,00 |
-8.648,00 |
133.679,00 |
405.705,00 |
316.384,00 |
|
|
A.15. Miscellaneous
taxes: |
0,00 |
0,00 |
0,00 |
0,00 |
0,00 |
|
|
A.VI. FINANCIAL YEAR RESULT (PROFIT)
(A.V-A.14-A.15): |
0,00 |
99.057,00 |
511.919,00 |
962.814,00 |
790.631,00 |
|
MERCANTILE
REGISTRY
|
|
EQUIVALENCIA |
EQUIVALENCIA |
EQUIVALENCIA |
EQUIVALENCIA |
EQUIVALENCIA |
|
|
CREDIT |
2013 |
2012 |
2011 |
2010 |
2009 |
|
|
B) INCOME ( B.1 to B.8): |
6.268.934,00 |
6.130.396,00 |
8.156.547,00 |
10.935.371,00 |
8.927.232,00 |
|
|
B.1. Operating income:
|
6.198.090,00 |
5.913.831,00 |
7.867.020,00 |
10.863.991,00 |
8.834.055,00 |
|
|
a) Net total sales: |
5.889.393,00 |
5.556.957,00 |
7.532.498,00 |
10.592.163,00 |
8.496.780,00 |
|
|
b) Miscellaneous operating income: |
308.696,00 |
356.874,00 |
334.522,00 |
271.828,00 |
337.275,00 |
|
|
B.I. PÉRDIDAS DE EXPLOTACIÓN
(A.1+A.2+A.3+A.4+A.5-B.1 ): |
181.337,00 |
60.215,00 |
0,00 |
0,00 |
0,00 |
|
|
B.2. Financial income:
|
70.844,00 |
209.592,00 |
286.936,00 |
67.861,00 |
92.165,00 |
|
|
a) Companies of the group: |
0,00 |
0,00 |
0,00 |
0,00 |
0,00 |
|
|
b) In associated companies: |
0,00 |
0,00 |
0,00 |
0,00 |
0,00 |
|
|
c) Miscellaneous: |
70.844,00 |
209.592,00 |
286.936,00 |
67.861,00 |
92.165,00 |
|
|
d) Profit on financial investment: |
0,00 |
0,00 |
0,00 |
0,00 |
0,00 |
|
|
B.3. Exchange gains:
|
0,00 |
0,00 |
0,00 |
0,00 |
0,00 |
|
|
B.II. NEGATIVE FINANCIAL RESULTS
(A.6+A.7+A.8-B.2-B.3): |
0,00 |
0,00 |
0,00 |
0,00 |
0,00 |
|
|
B.III. LOSSES ON ORDINARY ACTIVITIES ( B.I
+ B.II - A.I - A.II ): |
163.822,00 |
0,00 |
0,00 |
0,00 |
0,00 |
|
|
B.4. Profit on
disposal of both tangible and intangible fixed assets and securities
portfolio: |
0,00 |
0,00 |
0,00 |
0,00 |
0,00 |
|
|
B.5. Profit on transactions
with own shares and debentures: |
0,00 |
0,00 |
0,00 |
0,00 |
0,00 |
|
|
B.6. Capital grants
transferred to profit and loss: |
0,00 |
0,00 |
0,00 |
0,00 |
0,00 |
|
|
B.7. Extraordinary
income: |
0,00 |
6.974,00 |
2.591,00 |
3.518,00 |
1.011,00 |
|
|
B.8. Income and profit
of former financial years: |
0,00 |
0,00 |
0,00 |
0,00 |
0,00 |
|
|
B.IV. NEGATIVE EXTRAORDINARY RESULTS
(A.9+A.10+A.11+A.12+A.13-B.4-B.5-B.6-B.7-B.8): |
2.337,00 |
0,00 |
0,00 |
0,00 |
0,00 |
|
|
B.V. LOSSES BEFORE TAXES
(B.III+B.IV-A.III-A.IV): |
166.159,00 |
0,00 |
0,00 |
0,00 |
0,00 |
|
|
B.VI. FINANCIAL YEAR RESULTS (LOSSES)
(B.V+A.14+A.15): |
124.619,00 |
0,00 |
0,00 |
0,00 |
0,00 |
|
MERCANTILE
REGISTRY
CASHFLOW STATEMENT
Model: Normal
> Source of information: Data contained in this section is
taken from the information declared in the Annual Accounts submitted to the
Trade Register.
|
~'This company is not active, since it has been more than 6
years without entering any registration in the Companies House~' |
2013 |
2012 |
2011 |
2010 |
2009 |
|
|
1. Fiscal year result before taxes.: 61100 |
-166.159,00 |
90.410,00 |
645.598,00 |
1.368.519,00 |
1.107.016,00 |
|
|
2. Results adjustments.: 61200 |
55.837,00 |
-145.846,00 |
-168.894,00 |
-20.597,00 |
-48.572,00 |
|
|
a) Fixed Assets Amortization (+).:
61201 |
17.448,00 |
13.717,00 |
17.708,00 |
25.067,00 |
32.199,00 |
|
|
b) Obsolescence Allowances (+/-). :
61202 |
0,00 |
30.850,00 |
0,00 |
0,00 |
0,00 |
|
|
c) Variation in Provision (+/-). :
61203 |
0,00 |
0,00 |
23.090,00 |
7.281,00 |
0,00 |
|
|
f) Results on disposal of financial
instruments (+/-).: 61206 |
0,00 |
0,00 |
-1.515,00 |
0,00 |
0,00 |
|
|
g) Financial income (-).: 61207 |
-70.844,00 |
-209.592,00 |
-285.420,00 |
-67.296,00 |
-92.165,00 |
|
|
h) Financial Expenses (+). : 61208 |
11.515,00 |
18.164,00 |
32.144,00 |
14.350,00 |
11.395,00 |
|
|
i) Exchange differences (+/-). :
61209 |
0,00 |
0,00 |
34.517,00 |
0,00 |
0,00 |
|
|
j) Reasonable Value Variation in Financial Instruments
(+/-).: 61210 |
0,00 |
455,00 |
10.582,00 |
0,00 |
0,00 |
|
|
k) Other income and expense (-/+). :
61211 |
97.719,00 |
-1.738,00 |
-200.000,00 |
0,00 |
0,00 |
|
|
3. Changes in current capital equity.: 61300 |
-174.101,00 |
-372.730,00 |
454.850,00 |
-712.182,00 |
-543.644,00 |
|
|
a) Stock (+/-).: 61301 |
186.464,00 |
-409.688,00 |
239.135,00 |
-570.376,00 |
-108.536,00 |
|
|
d) Debtors and other accounts receivable
(+/-). : 61302 |
36.541,00 |
246.049,00 |
1.147.997,00 |
-933.003,00 |
-829.624,00 |
|
|
c) Other current assets (+/-). :
61303 |
274.234,00 |
-1.098,00 |
-55.010,00 |
14.363,00 |
-13.156,00 |
|
|
d) Creditors and other accounts payable
(+/-). : 61304 |
-671.340,00 |
-207.994,00 |
-877.273,00 |
776.834,00 |
407.672,00 |
|
|
4. Other cash flows for operating activities.: 61400 |
59.329,00 |
294.754,00 |
-45.080,00 |
-277.022,00 |
-173.485,00 |
|
|
a) Interest payments (-). : 61401 |
-11.515,00 |
-18.164,00 |
-32.144,00 |
-14.350,00 |
-11.395,00 |
|
|
b) Dividend payment collection (+). :
61402 |
0,00 |
202.299,00 |
0,00 |
0,00 |
0,00 |
|
|
c) Interest collection (+). : 61403 |
70.844,00 |
204.994,00 |
85.420,00 |
67.296,00 |
92.165,00 |
|
|
d) Income tax payment collection (payments)
(+/-).: 61404 |
0,00 |
-94.375,00 |
-98.357,00 |
-329.968,00 |
-254.256,00 |
|
|
5. Operating activity cash flows (1 + 2 + 3 + 4) : 61500 |
-225.094,00 |
-133.412,00 |
886.473,00 |
358.717,00 |
341.315,00 |
|
|
6. Payments for investment (-).: 62100 |
-183.763,00 |
-938.969,00 |
-1.222.137,00 |
-1.203.382,00 |
-1.405.835,00 |
|
|
b) Intangible fixed assets. : 62102 |
0,00 |
-4.498,00 |
-3.640,00 |
0,00 |
0,00 |
|
|
c) Fixed assets. : 62103 |
-22.816,00 |
-8.407,00 |
-8.970,00 |
-11.827,00 |
-835,00 |
|
|
e) Other financial assets. : 62105 |
-157.133,00 |
-926.064,00 |
-1.209.527,00 |
-1.191.555,00 |
-1.405.000,00 |
|
|
h) Other assets. : 62108 |
-3.814,00 |
0,00 |
0,00 |
0,00 |
0,00 |
|
|
7. Divestment payment collection (+). : 62200 |
2.417,00 |
987.550,00 |
910.000,00 |
677.500,00 |
25.000,00 |
|
|
b) Intangible fixed assets. : 62202 |
2.417,00 |
0,00 |
0,00 |
0,00 |
0,00 |
|
|
e) Other financial assets. : 62205 |
0,00 |
987.550,00 |
910.000,00 |
677.500,00 |
25.000,00 |
|
|
8. Investment activity cash flows (6 + 7) minus Amortization:
62300 |
-198.794,00 |
34.864,00 |
-329.845,00 |
-550.950,00 |
-1.413.034,00 |
|
|
9. Payment collection and payments for equity instruments. :
63100 |
0,00 |
14.521,00 |
-335.568,00 |
-333.000,00 |
-750.000,00 |
|
|
c) Acquisition of own equity instruments
(-). : 63103 |
0,00 |
14.521,00 |
-335.568,00 |
-333.000,00 |
-750.000,00 |
|
|
10. Payment collection and payments for financial liabilities
instruments.: 63200 |
75.956,00 |
-336.743,00 |
-201.237,00 |
124.726,00 |
2.736,00 |
|
|
a) Issuance : 63201 |
75.956,00 |
-336.743,00 |
0,00 |
124.726,00 |
2.736,00 |
|
|
2. Debts incurred with credit institutions
(+). : 63203 |
40.811,00 |
-336.743,00 |
0,00 |
122.159,00 |
2.736,00 |
|
|
4. Special characteristic debts (+). :
63205 |
30.991,00 |
0,00 |
0,00 |
0,00 |
0,00 |
|
|
5. Other debts (+). : 63206 |
4.153,00 |
0,00 |
0,00 |
2.568,00 |
0,00 |
|
|
b) Repayment and amortization of :
63207 |
0,00 |
0,00 |
-201.237,00 |
0,00 |
0,00 |
|
|
2. Debts incurred with credit institutions
(-).: 63209 |
0,00 |
0,00 |
-201.237,00 |
0,00 |
0,00 |
|
|
11. Payments from dividends and remunerations from other assets
instruments. : 63300 |
0,00 |
-20.000,00 |
-60.000,00 |
-60.000,00 |
-60.000,00 |
|
|
a) Dividends (-).: 63301 |
0,00 |
-20.000,00 |
-60.000,00 |
-60.000,00 |
-60.000,00 |
|
|
12. Cash flows for financing activities (9+10+11).: 63400 |
75.956,00 |
-342.222,00 |
-596.804,00 |
-268.274,00 |
-807.264,00 |
|
|
D) EFFECT OF EXCHANGE RATE CHANGES: 64000 |
0,00 |
0,00 |
0,00 |
0,00 |
0,00 |
|
|
E) NET INCREASE/DECREASE OF CASH OR EQUIVALENT ASSETS
(+/-5+/-8+/12+/-D) : 65000 |
-347.932,00 |
-427.053,00 |
-22.468,00 |
-435.438,00 |
-1.846.785,00 |
|
|
Cash or equivalent assets as of beginning
of the fiscal year.: 65100 |
2.219.991,00 |
2.647.045,00 |
2.669.513,00 |
3.104.952,00 |
4.951.736,00 |
|
|
Cash or equivalent assets as of end of the
fiscal year.: 65200 |
1.872.059,00 |
2.219.991,00 |
2.647.045,00 |
2.669.513,00 |
3.104.952,00 |
|
FINANCIAL
DIAGNOSIS
> Economic-Financial Comparative Analysis
Data used in the following ratios and indicators is
taken from the Annual Accounts submitted by the company to the TRADE REGISTER.
> Comparison within the Sector
|
Cash Flow |
2013 |
2012 |
Variación 2013 - 2012 |
|
|||
|
|
Empresa |
Sector |
Empresa |
Sector |
Empresa |
Sector |
|
|
Cash Flow over Sales: |
-0,06 % |
0,00 % |
-0,08 % |
0,00 % |
23,13 % |
|
|
|
EBITDA over Sales: |
-2,78 % |
5,85 % |
-0,84 % |
5,92 % |
-232,57 % |
-1,33 % |
|
|
Cash Flow Yield: |
-0,04 % |
0,00 % |
-0,04 % |
0,00 % |
12,43 % |
|
|
|
Profitability |
2013 |
2012 |
Variación 2013 - 2012 |
|
|||
|
|
Empresa |
Sector |
Empresa |
Sector |
Empresa |
Sector |
|
|
Operating economic profitability: |
-2,62 % |
0,06 % |
-0,81 % |
2,32 % |
-223,42 % |
-97,61 % |
|
|
Total economic profitability: |
-1,74 % |
0,36 % |
1,14 % |
1,93 % |
-253,10 % |
-81,24 % |
|
|
Financial profitability: |
-1,56 % |
-2,13 % |
1,22 % |
-0,50 % |
-227,77 % |
-323,63 % |
|
|
Margin: |
-2,93 % |
0,09 % |
-1,02 % |
2,07 % |
-187,34 % |
-95,60 % |
|
|
Mark-up: |
-2,64 % |
-3,90 % |
1,41 % |
0,31 % |
-287,34 % |
-1.339,27 % |
|
|
Solvency |
2013 |
2012 |
Variación 2013 - 2012 |
|
|||
|
|
Empresa |
Sector |
Empresa |
Sector |
Empresa |
Sector |
|
|
Liquidity: |
2,18 |
0,17 |
1,46 |
0,17 |
49,18 |
0,64 |
|
|
Acid Test: |
6,93 |
0,93 |
4,37 |
1,01 |
58,48 |
-8,27 |
|
|
Working Capital / Investment: |
0,84 |
0,10 |
0,80 |
0,14 |
4,89 |
-32,40 |
|
|
Solvency: |
9,72 |
1,47 |
6,05 |
1,53 |
60,72 |
-4,13 |
|
|
Indebtedness |
2013 |
2012 |
Variación 2013 - 2012 |
|
|||
|
|
Empresa |
Sector |
Empresa |
Sector |
Empresa |
Sector |
|
|
Indebtedness level: |
0,11 |
0,98 |
0,19 |
1,26 |
-40,98 |
-22,36 |
|
|
Borrowing Composition: |
0,03 |
1,03 |
0,00 |
0,84 |
|
22,06 |
|
|
Repayment Ability: |
-2,54 |
-829,14 |
-3,56 |
-9.277,82 |
28,68 |
91,06 |
|
|
Warranty: |
10,04 |
2,02 |
6,27 |
1,79 |
60,11 |
12,86 |
|
|
Generated resources / Total creditors: |
-0,12 |
0,02 |
0,07 |
0,05 |
-258,86 |
-59,76 |
|
|
Efficiency |
2013 |
2012 |
Variación 2013 - 2012 |
|
|||
|
|
Empresa |
Sector |
Empresa |
Sector |
Empresa |
Sector |
|
|
Productivity: |
0,87 |
1,27 |
0,96 |
1,33 |
-9,55 |
-4,44 |
|
|
Turnover of Collection Rights : |
2,38 |
3,77 |
2,24 |
4,31 |
6,28 |
-12,52 |
|
|
Turnover of Payment Entitlements: |
9,94 |
2,61 |
3,82 |
3,65 |
160,28 |
-28,63 |
|
|
Stock rotation: |
2,86 |
2,69 |
2,47 |
5,60 |
15,70 |
-51,90 |
|
|
Assets turnover: |
0,89 |
0,61 |
0,79 |
1,12 |
12,56 |
-45,76 |
|
|
Borrowing Cost: |
1,30 |
2,83 |
1,19 |
2,90 |
9,09 |
-2,44 |
|
> Trend of indicators under the General Accounting Plan of 2007
(2013, 2012, 2011, 2010, 2009)
|
Cash Flow |
2013 |
2012 |
2011 |
2010 |
2009 |
|
|
Cash Flow over Sales: |
-0,06 % |
-0,08 % |
0,00 % |
-0,04 % |
-0,22 % |
|
|
EBITDA over Sales: |
-2,78 % |
-0,84 % |
6,26 % |
13,12 % |
12,85 % |
|
|
Cash Flow Yield: |
-0,04 % |
-0,04 % |
0,00 % |
-0,04 % |
-0,19 % |
|
|
Profitability |
2013 |
2012 |
2011 |
2010 |
2009 |
|
|
Operating economic profitability: |
-2,62 % |
-0,81 % |
5,91 % |
14,78 % |
12,92 % |
|
|
Total economic profitability: |
-1,74 % |
1,14 % |
6,68 % |
12,33 % |
11,56 % |
|
|
Financial profitability: |
-1,56 % |
1,22 % |
6,39 % |
12,74 % |
10,32 % |
|
|
Margin: |
-2,93 % |
-1,02 % |
5,77 % |
12,56 % |
11,99 % |
|
|
Mark-up: |
-2,64 % |
1,41 % |
8,17 % |
12,56 % |
12,52 % |
|
|
Solvency |
2013 |
2012 |
2011 |
2010 |
2009 |
|
|
Liquidity: |
2,18 |
1,46 |
1,23 |
0,80 |
1,54 |
|
|
Acid Test: |
6,93 |
4,37 |
3,65 |
2,62 |
3,88 |
|
|
Working Capital / Investment: |
0,84 |
0,80 |
0,76 |
0,68 |
0,78 |
|
|
Solvency: |
9,72 |
6,05 |
4,62 |
3,30 |
4,73 |
|
|
Indebtedness |
2013 |
2012 |
2011 |
2010 |
2009 |
|
|
Indebtedness level: |
0,11 |
0,19 |
0,27 |
0,49 |
0,26 |
|
|
Borrowing Composition: |
0,03 |
0,00 |
0,00 |
0,10 |
0,00 |
|
|
Repayment Ability: |
-2,54 |
-3,56 |
-95,49 |
-8,42 |
-1,09 |
|
|
Warranty: |
10,04 |
6,27 |
4,73 |
3,06 |
4,80 |
|
|
Generated resources / Total creditors: |
-0,12 |
0,07 |
0,25 |
0,27 |
0,41 |
|
|
Efficiency |
2013 |
2012 |
2011 |
2010 |
2009 |
|
|
Productivity: |
0,87 |
0,96 |
1,38 |
2,15 |
1,94 |
|
|
Turnover of Collection Rights : |
2,38 |
2,24 |
2,71 |
2,56 |
2,66 |
|
|
Turnover of Payment Entitlements: |
9,94 |
3,82 |
4,07 |
3,31 |
4,03 |
|
|
Stock rotation: |
2,86 |
2,47 |
3,69 |
4,22 |
4,63 |
|
|
Assets turnover: |
0,89 |
0,79 |
1,03 |
1,18 |
1,08 |
|
|
Borrowing Cost: |
1,30 |
1,19 |
1,50 |
0,39 |
0,57 |
|
COMPARATIVE
SECTORIAL BALANCE
Sector-based Comparison
under the rules of the New General Accounting Plan.
|
~'This company is not active, since it has been more than 6
years without entering any registration in the Companies House~' |
Variación - |
|
|
|
Empresa |
Sector |
|
~'This company is not active, since it has been more than 6
years without entering any registration in the Companies House~' |
Variación - |
|
|
|
Empresa |
Sector |
|
~'This company is not active, since it has been more than 6 years
without entering any registration in the Companies House~' |
Variación - |
|
|
|
Empresa |
Sector |
Public Tenders and Works Won
No Public Tenders
assigned to the name of the company.
|
Research
Summary
|
|
Company incorporated in the year 1933, although it started
its activity in 1919. It is engaged in the manufacture and sale of umbrellas
and the activity that it develops is national and international. In the
sources consulted nothing appears against it. In light of the foregoing we
consider it apt to be related to risk operations according to its importance. |
|
Sources
|
|
Registry of Commerce's Official Gazette. Own and external
data bases Company References |
FOREIGN EXCHANGE RATES
|
Currency |
Unit
|
Indian Rupees |
|
US Dollar |
1 |
Rs.61.39 |
|
|
1 |
Rs.98.00 |
|
Euro |
1 |
Rs.76.99 |
INFORMATION DETAILS
|
Analysis Done by
: |
DIV |
|
|
|
|
Report Prepared
by : |
SNT |
RATING EXPLANATIONS
|
RATING |
STATUS |
PROPOSED CREDIT LINE |
|
|
|
>86 |
Aaa |
Possesses an extremely sound financial base with the strongest
capability for timely payment of interest and principal sums |
Unlimited |
|
|
71-85 |
Aa |
Possesses adequate working capital. No caution needed for credit transaction.
It has above average (strong) capability for payment of interest and
principal sums |
Large |
|
|
56-70 |
A |
Financial & operational base are regarded healthy. General unfavourable
factors will not cause fatal effect. Satisfactory capability for payment of
interest and principal sums |
Fairly Large |
|
|
41-55 |
Ba |
Overall operation is considered normal. Capable to meet normal
commitments. |
Satisfactory |
|
|
26-40 |
B |
Capability to overcome financial difficulties seems comparatively
below average. |
Small |
|
|
11-25 |
Ca |
Adverse factors are apparent. Repayment of interest and principal sums
in default or expected to be in default upon maturity |
Limited with
full security |
|
|
<10 |
C |
Absolute credit risk exists. Caution needed to be exercised |
Credit not
recommended |
|
|
-- |
NB |
New Business |
-- |
|
This score serves as a reference to assess SC’s
credit risk and to set the amount of credit to be extended. It is calculated
from a composite of weighted scores obtained from each of the major sections of
this report. The assessed factors and their relative weights (as indicated
through %) are as follows:
Financial
condition (40%) Ownership
background (20%) Payment
record (10%)
Credit history
(10%) Market trend (10%) Operational size
(10%)
This report is issued at your request without any
risk and responsibility on the part of MIRA INFORM PRIVATE LIMITED (MIPL)
or its officials.