MIRA INFORM REPORT
|
Report Date : |
10.11.2014 |
IDENTIFICATION DETAILS
|
Name : |
MECALUX SA |
|
|
|
|
Registered Office : |
Cl Silici 1 - Cornella De Llobregat - 08940 - Barcelona |
|
|
|
|
Country : |
Spain |
|
|
|
|
Financials (as on) : |
31.12.2013 |
|
|
|
|
Date of Incorporation : |
26.12.1966 |
|
|
|
|
Legal Form : |
Public Company |
|
|
|
|
Line of Business : |
Manufacturer of Metal Structure and Parts of Structures |
|
|
|
|
No. of Employees : |
1364 |
RATING & COMMENTS
|
MIRA’s Rating : |
B |
|
RATING |
STATUS |
PROPOSED CREDIT LINE |
|
|
26-40 |
B |
Capability to overcome financial difficulties seems comparatively
below average. |
Small |
|
Maximum Credit Limit : |
USD 8.060.000 |
|
|
|
|
Status : |
Moderate |
|
|
|
|
Payment Behaviour : |
No Complaints |
|
|
|
|
Litigation : |
Clear |
NOTES:
Any query related to this report can be made
on e-mail: infodept@mirainform.com
while quoting report number, name and date.
ECGC Country Risk Classification List – June 1, 2014
|
Country Name |
Previous Rating (31.03.2014) |
Current Rating (01.06.2014) |
|
Spain |
A2 |
A2 |
|
Risk Category |
ECGC
Classification |
|
Insignificant |
A1 |
|
Low |
A2 |
|
Moderate |
B1 |
|
High |
B2 |
|
Very High |
C1 |
|
Restricted |
C2 |
|
Off-credit |
D |
SPAIN - ECONOMIC OVERVIEW
Spain experienced a prolonged
recession in the wake of the global financial crisis. GDP contracted by 3.7% in
2009, ending a 16-year growth trend, and continued contracting through most of
2013. Economic growth resumed in late 2013, albeit only modestly, as credit
contraction in the private sector, fiscal austerity, and high unemployment
continued to weigh on domestic consumption and investment. Exports, however,
have been resilient throughout the economic downturn, partially offsetting
declines in domestic consumption and helped to bring Spain's current account
into surplus in 2013 for the first time since 1986. The unemployment rate rose
from a low of about 8% in 2007 to more than 26% in 2013, straining Spain's
public finances as spending on social benefits increased while tax revenues
fell. Spain’s budget deficit peaked at 11.4% of GDP in 2009. Spain gradually reduced
the deficit to just under 7% of GDP in 2013, slightly above the 6.5% target
negotiated between Spain and the EU. Public debt has increased substantially –
from 60.1% of GDP in 2010 to 93.4% in 2013. Rising labor productivity,
moderating labor costs, and lower inflation have helped to improve foreign
investor interest in the economy and to reduce government borrowing costs. The
government's ongoing efforts to implement reforms - labor, pension, health,
tax, and education - are aimed at supporting investor sentiment. The government
also has shored up struggling banks exposed to Spain's depressed domestic
construction and real estate sectors by successfully completing an EU-funded
restructuring and recapitalization program in December 2013
|
Source
: CIA |
Company
name and address
|
Name: |
MECALUX
SA |
|
|
NIF
/ Fiscal code: |
A08244998 |
|
|
Trade
Name |
MECALUX |
|
|
Status: |
ACTIVE |
|
|
Incorporation
Date: |
26/12/1966 |
|
|
Register Data |
Register
Section 8 Sheet 15611 |
|
|
Last Publication in BORME: |
21/10/2014
[Appointments] |
|
|
Last
Published Account Deposit: |
2013 |
|
|
Share
Capital: |
36.968.525 |
|
|
Localization: |
CL
SILICI 1 - CORNELLA DE LLOBREGAT - 08940 - BARCELONA |
|
|
Telephone
- Fax - Email - Website: |
Ph.:.
902313242 Email.
mecalux@mecalux.com
Website.
www.mecalux.es |
|
|
Number
of Branches |
14 |
|
|
Activity: |
|
|
|
NACE: |
2511
- Manufacture of metal structures and parts of structures |
|
|
Registered
Trademarks: |
|
|
|
Audited
/ Opinion: |
Si
/ |
|
|
Tenders
and Awards: |
15
for a total cost of NaN |
|
|
Subsidies: |
45
for a total cost of 12609000 |
|
|
Quality
Certificate: |
No |
|
|
|
|
|
|
Scoring and Risk: |
||
|
Maximum
recommended commercial credit: |
USD
8.060.000 |
|
Defaults, Legal Claims and Insolvency
Proceedings
|
|
|
Number |
Amount
(€) |
Most
Recent Entry |
|
Insolvency
Proceedings, Bankruptcy and Suspension of Payments |
|
Unpublished |
--- |
--- |
|
Defaults
on debt with Financial Institutions and Large Companies |
|
None |
--- |
--- |
|
Judicial
Claims (Notices, Executive Proceedings, Attachments, Auctions, Bad Debt) |
|
None |
0 |
--- |
|
Proceedings
heard by the Civil Court |
|
Unpublished |
0 |
--- |
|
Proceedings
heard by the Labour Court |
|
Unpublished |
0 |
--- |
Partners
|
ACEROLUX
SL |
40.47 % |
|
BALBOA
PARTICIPACIONES SA |
5.23 % |
|
BREA
INVESTMENTS, S.L. |
9 % |
|
CORPORACION
INDUSTRIAL BANKIA SA |
20 % |
|
CARTERA
INDUSTRIAL REA SA |
5 % |
|
DEYA
CAPITAL II SCR DE REGIMEN COMUN SA |
1.38 % |
|
DEYA
CAPITAL III FONDO DE CAPITAL REISGO DE REGIMEN COMUN, S.A. |
1.62 % |
|
DEYA
CAPITAL SCR DE REGIMEN SIMPLIFICADO, S.A. |
9 % |
|
HISCAN
PATRIMONIO S.A |
7.8 % |
|
Shares: |
30 |
|
Other
Links: |
19 |
|
No.
of Active Corporate Bodies: |
|
|
Ratios |
2013 |
2012 |
Change |
|
|
Nº
of employees: |
1364 |
|
|
|
|
|
|
|
Guarantees: |
|
|
Properties
Registered: |
Company
NO, Administrator NO |
|
Financing/
Guarantee Sources : |
Sources
YES, Guarantees YES |
INVESTIGATION
SUMMARY
The company was established in 1.985, although it continues invidual
business started in 1.966 by Mr. José Luis Carrillo. Engaged in the
manufacturing and marketing of integrated storage. It operates both nationally
and internationally. It is one of the most important companies in the sector
worldwide. There is no evidence of any incidents. In the light of the
foregoing, we consider the company apt to be related to risk operations in
accordance with its size, although and due to its high debt, we recommend to
track closely its business evolution.
Identification
|
|
|
Social Denomination: |
MECALUX SA |
|
Trade Name: |
MECALUX |
|
NIF / Fiscal code: |
A08244998 |
|
Corporate Status: |
ACTIVE |
|
Start of activity: |
1969 |
|
Registered Office: |
CL SILICI 1 |
|
Locality: |
CORNELLA DE LLOBREGAT |
|
Province: |
BARCELONA |
|
Postal Code: |
08940 |
|
Telephone: |
902313242 |
|
Fax: |
932632682 |
|
Website: |
www.mecalux.es |
|
Email: |
mecalux@mecalux.com |
|
Interviewed Person: |
This information has been obtained from indirect sources, given the impossibility of contacting the person authorized to provide information about the subject. |
Branch
Offices
|
Address |
Postal Code |
City |
Province |
|
CALLE PORTAL DE GAMARRA
1 EDIFICIO DEBA |
01013 |
VITORIA-GASTEIZ |
ALAVA |
|
CALLE FEDERICO
GARCIA LORCA 14 |
02006 |
ALBACETE |
ALBACETE |
|
CALLE MERCURI 14
NAVE 1 |
03690 |
SAN VICENTE DEL
RASPEIG/SANT VICENT DEL RASPEIG |
ALICANTE |
|
CALLE JOAN
CRESPI 51 |
07014 |
PALMA DE
MALLORCA |
BALEARES |
|
Av. Maresme,
14-60 |
08940 |
CORNELLA DE
LLOBREGAT |
BARCELONA |
|
CALLE PLATERO
PEDRO DE BARES 31 |
14007 |
CORDOBA |
CORDOBA |
|
Av. Mas Pins
(Pol. Ind. Poligensa), S/N |
17457 |
RIUDELLOTS DE LA
SELVA |
GIRONA |
|
CALLE OIALUME
BIDEA 15 POL IND ZAMOKA |
20115 |
ASTIGARRAGA |
GUIPUZCOA |
|
CALLE JULIO
PALACIOS 14 POL IND NTRA SRA BUTARQUE |
28194 |
LEGANES |
MADRID |
|
CALLE FRANZ
LISZT 1 EDIFICIO 1 OFICINA 226 |
29590 |
MALAGA |
MALAGA |
|
CALLE JULIAN
ROMEA S/N PARCELA 19 1 POL IND OESTE |
30169 |
MURCIA |
MURCIA |
|
CALLE JUAN
GUTEMBERG 17 19 |
35013 |
PALMAS DE GRAN
CANARIA (LAS) |
LAS PALMAS |
|
AVENI LA PRENSA
3 POL IND CTRA AMARILLA |
41007 |
SEVILLA |
SEVILLA |
|
CALLE ALQUERIA
MORET 5 7 POL IND ALQURIA DE MORET |
46210 |
PICANYA |
VALENCIA |
Activity
|
NACE: |
2511 |
|
Additional Information: |
Manufacturing and marketing of integrated storage. Its
main products include: - Industrial metal shelves - Automatic storehouses -
Software warehouse management -Technical storage services |
|
Franchise: |
No |
|
Import / export: |
IMPORTS
/ EXPORTS |
|
Industry situation: |
Maturity |
Number
of Employees
|
Year |
No. of employees |
Established |
Incidentals |
|
2013 |
1364 |
|
|
Chronological
Summary
|
|
Year |
Act |
|
|
|
1990 |
Accounts
deposit (ejer. 1989) Appointments/ Re-elections (4) Cessations/ Resignations/
Reversals (1) Increase of Capital (1) Statutory Modifications (1) |
|
|
|
1991 |
Accounts
deposit (ejer. 1990) Adaptation to Law (1) Appointments/ Re-elections (3) Cessations/
Resignations/ Reversals (1) Statutory Modifications (1) |
|
|
|
1992 |
Appointments/
Re-elections (2) |
|
|
|
1993 |
Accounts
deposit (ejer. 1991 consolidated, 1991, 1992) Appointments/ Re-elections (2) |
|
|
|
1994 |
Accounts
deposit (ejer. 1993 consolidated) Appointments/ Re-elections (2) Cessations/
Resignations/ Reversals (1) |
|
|
|
1995 |
Accounts
deposit (ejer. 1993, 1994) Appointments/ Re-elections (1) |
|
|
|
1996 |
Accounts
deposit (ejer. 1994 consolidated, 1995 consolidated, 1995) Appointments/
Re-elections (4) Cessations/ Resignations/ Reversals (3) Increase of Capital
(3) Statutory Modifications (1) |
|
|
|
1997 |
Accounts
deposit (ejer. 1996 consolidated, 1996) Appointments/ Re-elections (2)
Cessations/ Resignations/ Reversals (1) Take-over Merger (4) |
|
|
|
1998 |
Accounts
deposit (ejer. 1997 consolidated, 1997) Appointments/ Re-elections (2) Cessations/
Resignations/ Reversals (2) Errata (2) Take-over Merger (8) |
|
|
|
1999 |
Accounts
deposit (ejer. 1998 consolidated, 1998) Appointments/ Re-elections (2)
Capital Reduction (2) Cessations/ Resignations/ Reversals (5) Increase of Capital
(2) Other Concepts/ Events (4) Statutory Modifications (2) |
|
|
|
2000 |
Accounts
deposit (ejer. 1999 consolidated, 1999) Appointments/ Re-elections (2) Board
Meeting (1) Cessations/ Resignations/ Reversals (1) |
|
|
|
2001 |
Accounts
deposit (ejer. 2000 consolidated, 2000) Appointments/ Re-elections (6) Board
Meeting (1) Cessations/ Resignations/ Reversals (1) Errata (1) Increase of
Capital (2) Other Concepts/ Events (3) |
|
|
|
2002 |
Accounts
deposit (ejer. 2001 consolidated, 2001) Appointments/ Re-elections (1) Board
Meeting (1) |
|
|
|
2003 |
Accounts
deposit (ejer. 2002 consolidated, 2002) Appointments/ Re-elections (3) Board
Meeting (1) Cessations/ Resignations/ Reversals (3) |
|
|
|
2004 |
Accounts
deposit (ejer. 2003 consolidated) Appointments/ Re-elections (1) Board
Meeting (2) Change of Social Purpose (1) Change of Social address (1)
Statutory Modifications (4) Take-over Merger (5) |
|
|
|
2005 |
Accounts
deposit (ejer. 2004 consolidated, 2003, 2004) Appointments/ Re-elections (4)
Board Meeting (1) |
|
|
|
2006 |
Accounts
deposit (ejer. 2005 consolidated) Appointments/ Re-elections (5) Board Meeting
(1) Cessations/ Resignations/ Reversals (3) Increase of Capital (2) Other
Concepts/ Events (2) Statutory Modifications (1) |
|
|
|
2007 |
Accounts
deposit (ejer. 2006 consolidated, 2005, 2006) Appointments/ Re-elections (8)
Board Meeting (1) Cessations/ Resignations/ Reversals (4) Increase of Capital
(2) Other Concepts/ Events (2) Statutory Modifications (2) |
|
|
|
2008 |
Appointments/ Re-elections (6) Board Meeting (2) Cessations/
Resignations/ Reversals (1) Increase of Capital (1) Other Concepts/ Events
(1) |
|
|
|
2009 |
Accounts
deposit (ejer. 2007 consolidated, 2008 consolidated, 2007, 2008) Appointments/
Re-elections (7) Board Meeting (1) Cessations/ Resignations/ Reversals (7)
Increase of Capital (2) Other Concepts/ Events (4) Statutory Modifications
(1) |
|
|
|
2010 |
Accounts
deposit (ejer. 2009 consolidated, 2009) Appointments/ Re-elections (7) Board
Meeting (2) Cessations/ Resignations/ Reversals (3) Other Concepts/ Events
(3) Statutory Modifications (2) Take-over Merger (3) |
|
|
|
2011 |
Accounts
deposit (ejer. 2010 consolidated, 2010) Appointments/ Re-elections (12) Board
Meeting (1) Cessations/ Resignations/ Reversals (3) Other Concepts/ Events
(1) Statutory Modifications (1) Take-over Merger (1) |
|
|
|
2012 |
Accounts
deposit (ejer. 2011) Appointments/ Re-elections (11) Board Meeting (1) Cessations/
Resignations/ Reversals (6) Statutory Modifications (1) |
|
|
|
2013 |
Accounts
deposit (ejer. 2011 consolidated, 2012 consolidated, 2012) Appointments/
Re-elections (7) Cessations/ Resignations/ Reversals (3) |
|
|
|
2014 |
Accounts
deposit (ejer. 2013 consolidated, 2013) Appointments/ Re-elections (2)
Cessations/ Resignations/ Reversals (3) Statutory Modifications (2) |
|
Breakdown
of Owners' Equity
|
Registered Capital: |
36.968.525 |
|
Paid up capital: |
36.968.525 |
Updated Evolution of the Subscribed and
Paid-in Capital
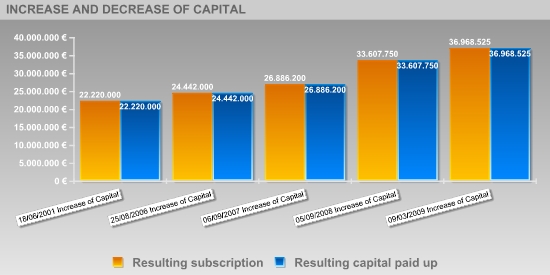
|
Publishing Date |
Registration Type |
Capital Subscribed |
Paid up capital |
Underwritten result |
Disbursed Result |
|
06/03/1990 |
Increase
of Capital |
1.816.929 |
1.816.929 |
12.089.758 |
12.089.758 |
|
15/01/1996 |
Increase
of Capital |
110.788 |
110.788 |
12.200.546 |
12.200.546 |
|
16/03/1996 |
Increase
of Capital |
5.168.704 |
5.168.704 |
17.369.250 |
17.369.250 |
|
17/09/1996 |
Increase
of Capital |
60.101 |
60.101 |
17.429.351 |
17.429.351 |
|
08/04/1999 |
Capital
Reduction |
-29.351 |
-29.351 |
17.400.000 |
17.400.000 |
|
04/05/1999 |
Increase
of Capital |
2.800.000 |
2.800.000 |
20.200.000 |
20.200.000 |
|
18/06/2001 |
Increase
of Capital |
2.020.000 |
2.020.000 |
22.220.000 |
22.220.000 |
|
25/08/2006 |
Increase
of Capital |
2.222.000 |
2.222.000 |
24.442.000 |
24.442.000 |
|
06/09/2007 |
Increase
of Capital |
2.444.200 |
2.444.200 |
26.886.200 |
26.886.200 |
|
05/09/2008 |
Increase
of Capital |
6.721.550 |
6.721.550 |
33.607.750 |
33.607.750 |
|
09/03/2009 |
Increase
of Capital |
3.360.775 |
3.360.775 |
36.968.525 |
36.968.525 |
Active
Social Bodies
|
Post
published |
Social
Body's Name |
Appointment
Date |
Other Positions in this Company |
|
PRESIDENT |
CARRILLO
RODRIGUEZ JOSE LUIS |
27/12/2010 |
15 |
|
VICE
CHAIRMAN |
CARRILLO
LOSTAO JAVIER |
27/12/2010 |
14 |
|
MEMBER
OF THE BOARD |
DEYA
CAPITAL S C R DE REGIMEN SIMPLIFICADO SA |
20/03/2014 |
1 |
|
|
MARCI
SL |
23/08/2012 |
1 |
|
|
ACEROLUX
SL |
24/08/2011 |
1 |
|
|
BRESLA
INVESTMENTS SL |
27/12/2010 |
3 |
|
|
CARRILLO
LOSTAO GREGORIO |
27/12/2010 |
2 |
|
|
PUJOL
ARTIGAS JOSE MARIA |
27/12/2010 |
4 |
|
|
MONTES
PEREZ EDUARDO |
27/12/2010 |
3 |
|
|
CARRILLO
RODRIGUEZ JOSE LUIS |
27/12/2010 |
15 |
|
|
CARRILLO
LOSTAO JAVIER |
27/12/2010 |
14 |
|
|
ARTA
CAPITAL SOCGESTORA DE ENTDE CAPITAL RIESGO |
27/12/2010 |
1 |
|
|
CARTERA
INDUSTRIAL REA SA |
27/12/2010 |
2 |
|
|
MARCH
JUAN JUAN |
27/12/2010 |
1 |
|
|
SOCIEDAD
DE PROMOCION Y PARTICIPACION EMPRESARI |
26/01/2009 |
1 |
|
|
EURO
SYNS S A |
30/12/2005 |
1 |
|
JOINT
ATTORNEY |
GALLOSTRA
RONQUILLO JORGE |
27/02/1990 |
1 |
|
PROXY |
MORENO
DIAZ JULIAN |
01/03/2013 |
1 |
|
|
NEIRA
FERNANDEZ JAVIER |
07/09/2012 |
1 |
|
|
RIVAS
CALVO JAVIER |
20/06/2012 |
1 |
|
|
BURGOS
PASTOR LUIS ALBERTO |
23/04/2012 |
3 |
|
|
PRIETO
TUSET FRANCISCO JOSE |
06/02/2012 |
1 |
|
|
PEÑARANDA
NEGRETE JESUS |
06/02/2012 |
1 |
|
|
ALCAZAR
ESPADA MANUEL |
06/02/2012 |
1 |
|
|
MARTINEZ
MOLINA JUAN JESUS |
06/02/2012 |
1 |
|
|
FORES
RAFOLS ALBERT |
30/01/2012 |
1 |
|
|
LEIRADO
CAMPO FRANCISCO JAVIER |
24/08/2011 |
2 |
|
|
CASADO
PACHECO MIGUEL |
30/03/2011 |
4 |
|
|
POLADURA
VECINO JOSE LUIS |
01/02/2011 |
1 |
|
|
VALLEJO
POLO RAFAEL |
01/02/2011 |
1 |
|
|
RAMOS
HERNANDEZ JOSE LUIS |
20/01/2011 |
1 |
|
|
CLOSAS
HERRERA MARIA DOLORS |
22/01/2010 |
2 |
|
|
DAVILA
PIÑEIRO MIGUEL |
27/02/2008 |
1 |
|
|
CARRILLO
RODRIGUEZ JOSE LUIS |
17/08/2001 |
15 |
|
|
CARRILLO
LOSTAO JAVIER |
05/02/2001 |
14 |
|
|
FERNANDEZ
MENDEZ HIPOLITO |
04/06/1998 |
1 |
|
|
BASSAS
BRESCA CARLOS |
28/05/1991 |
5 |
|
NON
CONSELLOR SECRETARY |
KIRCHNER
BALIU PERE |
04/05/1999 |
1 |
|
NON
CONSELLOR ASSISTANT SECRETARY |
GAMAZO
MARTIN ANA MARIA |
26/11/2007 |
1 |
|
MANAGING
ENTITY |
SERVICIO
COMPENSACION LIQUIDACION VALORES SA |
08/04/1999 |
1 |
|
REPRESENTATIVE |
JIMENEZ
UGARTE LUELMO NICOLAS |
20/03/2014 |
1 |
|
|
CARRILLO
LOSTAO JAVIER |
23/08/2012 |
14 |
|
|
CARRILLO
RODRIGUEZ JOSE LUIS |
24/08/2011 |
15 |
|
|
GONZALEZ
ADALID GARCIA ZOZAYA ANTONIO |
27/12/2010 |
2 |
|
|
ZARDOYA
ARANA ALBERTO |
27/12/2010 |
2 |
|
|
CARNE
CASAS RAMON |
27/12/2010 |
3 |
|
ACCOUNTS'
AUDITOR / HOLDER |
DELOITTE
SL |
13/10/2014 |
18 |
|
CONSOLIDATED
ACCOUNTS' AUDITOR |
DELOITTE
SL |
13/10/2014 |
18 |
Historical
Social Bodies
|
Social
Body's Name |
Post
published |
End
Date |
Other Positions in this Company |
|
ACEBO
SANCHEZ FRANCISCO JAVIER |
NON
CONSELLOR SECRETARY |
04/05/1999 |
1 |
|
ARISTIN
FRONTELA ROSA MARIA |
PROXY |
20/06/2012 |
1 |
|
ARTHUR ANDERSEN Y CIA S COM |
ACCOUNTS'
AUDITOR / HOLDER |
14/06/1993 |
11 |
|
|
ACCOUNTS'
AUDITOR / HOLDER |
04/05/1999 |
|
|
|
CONSOLIDATED
ACCOUNTS' AUDITOR |
04/05/1999 |
|
|
|
CONSOLIDATED
ACCOUNTS' AUDITOR |
15/03/2001 |
|
|
|
ACCOUNTS'
AUDITOR / HOLDER |
15/03/2001 |
|
|
|
ACCOUNTS'
AUDITOR / HOLDER |
02/10/2001 |
|
|
|
CONSOLIDATED
ACCOUNTS' AUDITOR |
02/10/2001 |
|
|
|
CONSOLIDATED
ACCOUNTS' AUDITOR |
10/01/2003 |
|
|
|
ACCOUNTS'
AUDITOR / HOLDER |
10/01/2003 |
|
|
|
ACCOUNTS'
AUDITOR / HOLDER |
04/11/2003 |
|
|
|
CONSOLIDATED
ACCOUNTS' AUDITOR |
04/11/2003 |
|
|
AVANZA
INVERSIONES EMPRESARIALES SOCIEDAD GESTORA |
MEMBER
OF THE BOARD |
16/01/2013 |
1 |
|
BASSAS
BRESCA CARLOS |
MEMBER
OF THE BOARD |
16/03/1996 |
5 |
|
|
PROXY |
28/05/1991 |
|
|
|
NON
CONSELLOR SECRETARY |
04/02/1994 |
|
|
|
SECRETARY |
16/03/1996 |
|
|
BELLAVISTA
AULADELL FRANCESC |
REPRESENTATIVE |
03/01/2014 |
1 |
|
BERNARDO
ALVAREZ JUAN CARLOS |
PROXY |
20/06/2012 |
1 |
|
BETETA
ROBLES VALENTIN |
REPRESENTATIVE |
03/01/2014 |
1 |
|
BRESLA
INVESTMENTS SL |
MEMBER
OF THE BOARD |
27/12/2010 |
3 |
|
|
MEMBER
OF THE BOARD |
04/09/2007 |
|
|
BURGOS
PASTOR LUIS ALBERTO |
PROXY |
22/01/2010 |
3 |
|
|
PROXY |
23/04/2012 |
|
|
CARNE
CASAS RAMON |
MEMBER
OF THE BOARD |
07/08/2003 |
3 |
|
|
MEMBER
OF THE BOARD |
04/05/1999 |
|
|
CARRILLO
LOSTAO GREGORIO |
PROXY |
01/08/2014 |
2 |
|
CARRILLO
LOSTAO JAVIER |
MEMBER
OF THE BOARD |
20/09/1997 |
14 |
|
|
REPRESENTATIVE |
04/05/1999 |
|
|
|
PROXY |
05/02/2001 |
|
|
|
MEMBER
OF THE BOARD |
19/02/2001 |
|
|
|
VICE
CHAIRMAN |
27/12/2010 |
|
|
|
MEMBER
OF THE BOARD |
27/12/2010 |
|
|
|
MEMBER
OF THE BOARD |
18/11/2003 |
|
|
|
VICE
CHAIRMAN |
18/11/2003 |
|
|
|
MEMBER
OF THE BOARD |
07/06/2006 |
|
|
|
VICE
CHAIRMAN |
05/09/2008 |
|
|
CARRILLO
LOSTAO LUIS |
REPRESENTATIVE |
04/05/1999 |
4 |
|
|
MEMBER
OF THE BOARD |
20/09/1997 |
|
|
|
MEMBER
OF THE BOARD |
18/11/2003 |
|
|
|
MEMBER
OF THE BOARD |
31/03/2006 |
|
|
CARRILLO
LOSTAO MARCIAL |
REPRESENTATIVE |
04/05/1999 |
1 |
|
CARRILLO
RODRIGUEZ JOSE LUIS |
MEMBER
OF THE BOARD |
04/02/1994 |
15 |
|
|
MEMBER
OF THE BOARD |
16/03/1996 |
|
|
|
MEMBER
OF THE BOARD |
04/05/1999 |
|
|
|
MEMBER
OF THE BOARD |
18/11/2003 |
|
|
|
MEMBER
OF THE BOARD |
05/09/2008 |
|
|
|
MEMBER
OF THE BOARD |
27/12/2010 |
|
|
|
PROXY |
17/08/2001 |
|
|
|
PRESIDENT |
04/02/1994 |
|
|
|
PRESIDENT |
16/03/1996 |
|
|
|
PRESIDENT |
05/09/2008 |
|
|
|
PRESIDENT |
27/12/2010 |
|
|
CARTERA
INDUSTRIAL REA SA |
MEMBER
OF THE BOARD |
27/12/2010 |
2 |
|
CASADO
PACHECO MIGUEL |
PROXY |
29/10/2009 |
4 |
|
|
PROXY |
17/04/1997 |
|
|
|
PROXY |
01/09/2009 |
|
|
CASTEJON
FERNANDEZ GERMAN |
MEMBER
OF THE BOARD |
02/04/1990 |
1 |
|
CASTIÑEIRAS
CENAMOR EDUARDO |
REPRESENTATIVE |
09/06/2010 |
1 |
|
CATALA
MASDEU JORDI |
CHIEF
EXECUTIVE OFFICER |
04/05/1999 |
13 |
|
|
MEMBER
OF THE BOARD |
04/05/1999 |
|
|
|
MEMBER
OF THE BOARD |
16/03/1996 |
|
|
|
CHIEF
EXECUTIVE OFFICER |
16/03/1996 |
|
|
|
MEMBER
OF THE BOARD |
27/12/2010 |
|
|
|
MEMBER
OF THE BOARD |
01/06/2011 |
|
|
|
PROXY |
10/01/2012 |
|
|
|
MEMBER
OF THE BOARD |
18/11/2003 |
|
|
|
CHIEF
EXECUTIVE OFFICER |
18/11/2003 |
|
|
|
MEMBER
OF THE BOARD |
05/09/2008 |
|
|
|
CHIEF
EXECUTIVE OFFICER |
09/10/2008 |
|
|
|
CHIEF
EXECUTIVE OFFICER |
27/12/2010 |
|
|
|
CHIEF
EXECUTIVE OFFICER |
01/06/2011 |
|
|
CLOFENT
SUÑER GUILLEM |
MEMBER
OF THE BOARD |
28/12/2011 |
2 |
|
|
CHIEF
EXECUTIVE OFFICER |
28/12/2011 |
|
|
CLOSAS
HERRERA MARIA DOLORES |
PROXY |
29/10/2009 |
1 |
|
CLOSAS
HERRERA MARIA DOLORS |
PROXY |
22/01/2010 |
2 |
|
CORDOBA
DIAZ ANGEL |
REPRESENTATIVE |
27/12/2010 |
2 |
|
|
REPRESENTATIVE |
19/10/2012 |
|
|
CORPORACION
FINANCIERA CAJA MADRID SA |
MEMBER
OF THE BOARD |
09/06/2010 |
1 |
|
CUATRECASAS
SABATA PEDRO |
MEMBER
OF THE BOARD |
29/11/2001 |
1 |
|
DE
SANTIAGO RESTOY JOSE MARIA |
REPRESENTATIVE |
16/01/2013 |
2 |
|
|
REPRESENTATIVE |
16/12/2013 |
|
|
DELOITTE AND TOUCHE ESPAÑA SL |
CONSOLIDATED
ACCOUNTS' AUDITOR |
13/12/2005 |
4 |
|
|
ACCOUNTS'
AUDITOR / HOLDER |
13/12/2005 |
|
|
|
ACCOUNTS'
AUDITOR / HOLDER |
28/12/2004 |
|
|
|
CONSOLIDATED
ACCOUNTS' AUDITOR |
28/12/2004 |
|
|
DELOITTE
S L |
ACCOUNTS'
AUDITOR / HOLDER |
23/08/2007 |
2 |
|
|
CONSOLIDATED
ACCOUNTS' AUDITOR |
23/08/2007 |
|
|
DELOITTE
SL |
ACCOUNTS'
AUDITOR / HOLDER |
02/12/2008 |
18 |
|
|
CONSOLIDATED
ACCOUNTS' AUDITOR |
02/12/2008 |
|
|
|
ACCOUNTS'
AUDITOR / HOLDER |
16/10/2006 |
|
|
|
CONSOLIDATED
ACCOUNTS' AUDITOR |
16/10/2006 |
|
|
|
ACCOUNTS'
AUDITOR / HOLDER |
15/10/2013 |
|
|
|
CONSOLIDATED
ACCOUNTS' AUDITOR |
15/10/2013 |
|
|
|
CONSOLIDATED
ACCOUNTS' AUDITOR |
13/10/2014 |
|
|
|
ACCOUNTS'
AUDITOR / HOLDER |
13/10/2014 |
|
|
|
CONSOLIDATED
ACCOUNTS' AUDITOR |
30/01/2013 |
|
|
|
ACCOUNTS'
AUDITOR / HOLDER |
30/01/2013 |
|
|
|
CONSOLIDATED
ACCOUNTS' AUDITOR |
10/01/2012 |
|
|
|
ACCOUNTS'
AUDITOR / HOLDER |
10/01/2012 |
|
|
|
ACCOUNTS'
AUDITOR / HOLDER |
09/11/2009 |
|
|
|
CONSOLIDATED
ACCOUNTS' AUDITOR |
09/11/2009 |
|
|
|
CONSOLIDATED
ACCOUNTS' AUDITOR |
25/08/2010 |
|
|
|
ACCOUNTS'
AUDITOR / HOLDER |
25/08/2010 |
|
|
EURO
SYNS SA |
MEMBER
OF THE BOARD |
31/05/2007 |
2 |
|
|
MEMBER
OF THE BOARD |
06/11/2000 |
|
|
FERNANDEZ
FIGARES DE LA CHICA JUAN JOSE |
MEMBER
OF THE BOARD |
01/06/1991 |
1 |
|
FERNANDEZ
FONTECHA TORRENS MANUEL |
SECRETARY |
04/02/1994 |
1 |
|
FREIXES
PORTES XAVIER |
NON
CONSELLOR ASSISTANT SECRETARY |
26/11/2007 |
1 |
|
GALLOSRTA
RONQUILLO JORDI |
MEMBER
OF THE BOARD |
04/02/1994 |
1 |
|
GALLOSTRA
RONQUILLO JORDI |
PROXY |
13/03/1999 |
4 |
|
|
CHIEF
EXECUTIVE OFFICER |
06/08/1999 |
|
|
|
PROXY |
06/08/1999 |
|
|
|
MEMBER
OF THE BOARD |
01/06/1991 |
|
|
GARCIA
VARELA JOSE MANUEL |
MEMBER
OF THE BOARD |
27/12/2010 |
2 |
|
|
MEMBER
OF THE BOARD |
16/01/2013 |
|
|
GENNER
DE INVERSIONES SA |
MEMBER
OF THE BOARD |
04/05/1999 |
1 |
|
GONZALEZ
ADALID GARCIA ZOZAYA ANTONIO |
REPRESENTATIVE |
27/12/2010 |
2 |
|
GRANDA
ALBUERNE ANTONIO OSCAR |
PROXY |
04/03/2014 |
1 |
|
GRUPO
CORPORATIVO EMPRESARIAL CAJA DE AHORROS Y MO |
MEMBER
OF THE BOARD |
03/01/2014 |
2 |
|
|
MEMBER
OF THE BOARD |
27/12/2010 |
|
|
HUGUET
BREA JOSE MARIA |
PROXY |
29/10/2009 |
1 |
|
INMOGESTION
Y PATRIMONIOS SA |
MEMBER
OF THE BOARD |
03/01/2014 |
2 |
|
|
MEMBER
OF THE BOARD |
16/12/2013 |
|
|
JODRA
URIARTE IÑIGO |
REPRESENTATIVE |
26/10/2009 |
1 |
|
JOVER
DE CASTRO JUAN BOSCO |
PROXY |
22/01/2007 |
1 |
|
LEINA
SA |
MEMBER
OF THE BOARD |
04/05/1999 |
1 |
|
LEIRADO
CAMPO FRANCISCO JAVIER |
PROXY |
24/08/2011 |
2 |
|
LOCHE
QUINTANILLA FERNANDO LUIS |
PROXY |
04/03/2014 |
1 |
|
LOIZAGA
VIGURI JOSE MARIA |
MEMBER
OF THE BOARD |
01/12/1998 |
4 |
|
|
MEMBER
OF THE BOARD |
04/09/2007 |
|
|
|
MEMBER
OF THE BOARD |
27/12/2010 |
|
|
|
MEMBER
OF THE BOARD |
01/08/2011 |
|
|
LORING
TASSARA IGNACIO |
MEMBER
OF THE BOARD |
01/06/1991 |
1 |
|
MANCHON
ALCAZAR GONZALO |
MEMBER
OF THE BOARD |
01/06/1991 |
1 |
|
MARIN
MATEU VICENTE |
PROXY |
12/12/2012 |
2 |
|
|
PROXY |
29/10/2009 |
|
|
MONTES
PEREZ EDUARDO |
MEMBER
OF THE BOARD |
05/09/2008 |
3 |
|
|
MEMBER
OF THE BOARD |
27/12/2010 |
|
|
NEGRE
VILLAVECCHIA ANTONIO |
MEMBER
OF THE BOARD |
02/04/1990 |
1 |
|
ODERIZ
SAN MARTIN JUAN |
REPRESENTATIVE |
31/10/2008 |
1 |
|
PEREZ
CLAVER MARIANO |
REPRESENTATIVE |
13/10/2009 |
1 |
|
POCH
SERRATS JUAN |
MEMBER
OF THE BOARD |
26/11/2007 |
2 |
|
|
MEMBER
OF THE BOARD |
18/11/2003 |
|
|
PUIG
MOLIAS ISABEL |
PROXY |
25/02/2005 |
6 |
|
|
PROXY |
13/10/1998 |
|
|
|
PROXY |
24/04/2009 |
|
|
|
PROXY |
01/09/2009 |
|
|
|
PROXY |
17/04/1997 |
|
|
|
PROXY |
29/10/2009 |
|
|
PUJOL
ARTIGAS JOSE MARIA |
MEMBER
OF THE BOARD |
27/09/2002 |
4 |
|
|
MEMBER
OF THE BOARD |
27/12/2010 |
|
|
|
MEMBER
OF THE BOARD |
26/09/2007 |
|
|
RECIO
VILLASCLARAS JOSE ANTONIO |
PROXY |
20/05/2003 |
1 |
|
RIBO
MASSO JAVIER |
MEMBER
OF THE BOARD |
04/02/1994 |
2 |
|
|
MEMBER
OF THE BOARD |
16/03/1996 |
|
|
RIBO
MASSO XAVIER |
MEMBER
OF THE BOARD |
02/04/1990 |
1 |
|
RISCAL
DE INVERSIONES SA |
MEMBER
OF THE BOARD |
04/05/1999 |
1 |
|
SAN
SEGUNDO HERNANDEZ ANTONIO |
REPRESENTATIVE |
03/01/2014 |
1 |
|
SEBASTIAN
GASCON CARLOS |
MEMBER
OF THE BOARD |
01/06/1991 |
2 |
|
|
PRESIDENT |
01/06/1991 |
|
|
SECTOR
DE PARTICIPACIONES INTEGRALES SL |
MEMBER
OF THE BOARD |
16/12/2013 |
2 |
|
|
MEMBER
OF THE BOARD |
03/01/2014 |
|
|
SOCIEDAD
DE PROMOCION Y PARTICIPACION EMPRESARIAL |
MEMBER
OF THE BOARD |
03/01/2014 |
1 |
|
SOCIEDAD
DE PROMOCION Y PARTICIPACION EMRESARIAL C |
MEMBER
OF THE BOARD |
27/12/2010 |
1 |
|
SOLANA
MARTINEZ SEVERIANO |
REPRESENTATIVE |
31/07/2013 |
1 |
|
SORIA
VIDAL IGNACIO |
REPRESENTATIVE |
16/12/2013 |
2 |
|
|
REPRESENTATIVE |
03/01/2014 |
|
|
SOTO
LOPEZ DORIGA PEDRO |
MEMBER
OF THE BOARD |
01/06/1991 |
1 |
|
TORRES
BARRIERAS MARGARITA |
PROXY |
17/11/1993 |
5 |
|
|
MEMBER
OF THE BOARD |
04/02/1994 |
|
|
|
MEMBER
OF THE BOARD |
16/03/1996 |
|
|
|
PROXY |
13/07/1998 |
|
|
|
MEMBER
OF THE BOARD |
01/06/1991 |
|
|
TORRES
ROSELLO VICENTE |
PROXY |
15/06/1994 |
5 |
|
|
PROXY |
13/03/1999 |
|
|
|
PROXY |
06/11/1996 |
|
|
|
PROXY |
06/11/1996 |
|
|
|
PROXY |
17/04/1997 |
|
|
TRIMIÑO
MARQUEZ RAFAEL |
MEMBER
OF THE BOARD |
16/03/1996 |
2 |
|
|
PROXY |
20/11/2006 |
|
|
URIA
GARCIA ALFREDO |
PROXY |
12/12/2012 |
2 |
|
|
PROXY |
01/02/2011 |
|
|
VILLEGAS
DIAZ JUAN IGNACIO |
REPRESENTATIVE |
27/12/2010 |
2 |
|
|
REPRESENTATIVE |
09/10/2012 |
|
|
VIVAS
GOMEZ OSCAR |
PROXY |
14/07/2006 |
1 |
|
ZARDOYA
ARANA ALBERTO |
REPRESENTATIVE |
27/12/2010 |
2 |
|
ZARDOYA
ARANA FRANCISCO JAVIER |
REPRESENTATIVE |
27/02/2009 |
2 |
|
|
REPRESENTATIVE |
31/05/2007 |
|
|
ZARDOYA
ARANA JAVIER |
REPRESENTATIVE |
31/05/2007 |
1 |
|
ZARDOYA
GARCIA FRANCISCO JAVIER |
MEMBER
OF THE BOARD |
18/03/2000 |
1 |
Executive
board
|
Post |
NIF |
Name |
|
COMMERCIAL
MANAGER |
|
PABLO
GUARDANS CAMBO |
|
COMPUTER
SCIENCE DIRECTOR |
|
JOSE
MARIA CONCEPCION MARTI |
|
FINANCIAL
DIRECTOR |
|
ISABEL
PUIG MOLIAS |
Defaults, Legal Claims and Insolvency
Proceedings
Section enabling assessment of the degree of compliance of the company queried
with its payment obligations. It provides information on the existence and
nature of all stages of Insolvency and Legal Proceedings published with
reference to the Company in the country's various Official Bulletins and
national newspapers, as well Defaults Registered in the main national credit
bureaus (ASNEF Industrial and RAI ).
Chronological summary
|
|
|
Number of Publications |
Amount (_) |
Start date |
End date |
|
Insolvency Proceedings, Bankruptcy and Suspension of
Payments |
|
Unpublished |
--- |
--- |
--- |
|
Request/Declaration |
|
0 |
--- |
date |
|
|
Proceedings |
|
--- |
--- |
|
--- |
|
Resolution |
|
--- |
--- |
|
--- |
|
Defaults on debt with Financial Institutions and
Large Companies |
Bank
and Commercial Delinquency |
None |
0 |
|
|
|
Status:
Friendly |
|
--- |
|
|
|
|
Status:
Pre-Litigation |
|
--- |
|
|
|
|
Status:
Litigation |
|
--- |
|
|
|
|
Status:
Non-performing |
|
--- |
|
|
|
|
Status: insolvency proceedings, bankruptcy and
suspension of payments |
|
--- |
|
|
|
|
Other
status |
|
--- |
|
|
|
|
Legal
and Administrative Proceedings |
|
Unpublished |
--- |
|
|
|
Notices of defaults and enforcement |
|
--- |
--- |
|
--- |
|
Seizures |
|
--- |
--- |
|
--- |
|
Auctions |
|
--- |
--- |
|
--- |
|
Declarations of insolvency and bad debt |
|
--- |
--- |
|
--- |
|
Proceedings heard by the Civil Court |
|
Unpublished |
--- |
|
|
|
Proceedings heard by the Labour Court |
|
Unpublished |
--- |
|
|
Basis
for scoring
|
Positive
Factors |
Adverse
Factors |
|
No judicial claims have been detected in the
Official Gazettes, regarding any Entity's outstanding debts with the Tax Bureau
or Social Security administrations, as submitted by Courts of the various
court jurisdictions. No irregular payment performance has been detected
based on information obtained from credit bureaus. It is one of the major domestic companies in terms of
sales volume. Significant level of financial autonomy. The asset
is financed mostly with equity and financing with maturity exceeding one
year, providing a solid financial structure. MECALUX SA 's borrowing cost is appropriate
according to its volume of external financing sources. |
|
Probability
of default
> Estimated Probability of Default for the next 12 months:
0.222 %
|
Sector in which comparison is carried out: 251 Manufacture of structural metal products |
|
Relative Position: Credit quality is superior to that of other
companies in the same sector. |
The company's comparative analysis with the rest of the companies that
comprise the sector, shows the company holds a better position with regard to
the probability of non-compliance.
The 99.00% of the companies of the sector MECALUX SA belongs to show a
higher probability of non-compliance.
The probability of the company's non-compliance with its payment obligations
within deadlines estimated by our qualifications models is 0.222%.
In the event they fail to comply with the payment, the seriousness of
the loss will depend on factors such as the promptness of the commencement of
the charging management, the existence of executive documents which match the
credit or the existence of guarantees and free debt assets under the name of
the debtor. Therefore, the probability of non-compliance should not be solely
interpreted as the total loss of the owed amount.
Recommended
commercial credit
Favourable until USD 8.060.000
LEGAL
CLAIMS
Summary of Judicial Claims
|
|
|
|
|
|
PROCEDURES OF CONTEST, BANKRUPTCY AND BANKRUPTCY
PROTECTION |
|
||
|
|
Legal
Proceedings (Bankruptcy Law 22/2003) |
No
se han publicado |
|
|
|
Quiebras
y Suspensiones de Pagos (anterior legislación concursal) |
No
se han publicado |
|
|
INCIDENCES WITH THE PUBLIC ADMINISTRATIONS |
|
||
|
|
Incidences with the Tax Agency |
No
se han publicado |
|
|
|
Incidences with the Social Security |
No
se han publicado |
|
|
|
Incidences with the Autonomous Administration |
No
se han publicado |
|
|
|
Incidences with the Local Administration |
No
se han publicado |
|
|
PROCEDURES BEFORE COURTS OF CIVIL MATTERS |
|
||
|
|
Procedures by the Civil Procedural Law 1/2000 |
No
se han publicado |
|
|
|
Proceedings by the old Civil Procedural Law 1.881 |
No
se han publicado |
|
|
PROCEEDINGS BEFORE THE INDUSTRIAL TRIBUNAL |
|
||
|
|
Procedimientos
ante Juzgados de lo Social |
No
se han publicado |
|
Clients
|
Name |
NIF |
Telephone |
|
CAPRABO |
|
|
|
DISALFARM |
|
|
|
ZUMEX |
|
|
|
TORRAS
PAPEL |
|
|
|
GIOSEPPO |
|
|
|
TAU
CERÁMICA |
|
|
|
BANCO
DE SABADELL |
|
|
|
CAF |
|
|
|
FONT
VELLA |
|
|
Link
List
|
PARTICIPATES
IN: |
30 Entities |
|
SHAREHOLDERS: |
9 Entities |
|
ABSORBS
TO: |
7 Entities |
|
BELONGS TO THE ADMINISTRATION BOARD OF: |
1 Entities |
|
HAS IN ITS ADMINISTRATION BOARD TO: |
6 Entities |
|
IS
RELATED WITH: |
5 Entities |
> Shareholders
|
Relationship |
Entity |
Province |
Shareholding stake |
|
SHAREHOLDERS |
ACEROLUX
SL |
BARCELONA |
40.47 |
|
|
BALBOA
PARTICIPACIONES SA |
MADRID |
5.23 |
|
|
BREA
INVESTMENTS, S.L. |
|
9 |
|
|
CORPORACION
INDUSTRIAL BANKIA SA |
MADRID |
20 |
|
|
CARTERA
INDUSTRIAL REA SA |
MADRID |
5 |
|
|
DEYA
CAPITAL II SCR DE REGIMEN COMUN SA |
MADRID |
1.38 |
|
|
DEYA
CAPITAL III FONDO DE CAPITAL REISGO DE REGIMEN COMUN, S.A. |
|
1.62 |
|
|
DEYA
CAPITAL SCR DE REGIMEN SIMPLIFICADO, S.A. |
|
9 |
|
|
HISCAN
PATRIMONIO S.A |
NAVARRA |
7.8 |
|
PARTICIPATES
IN |
MECALUX
LEVANTE SA |
VALENCIA |
99.96 |
|
|
MECALUX
UK, S.A. |
|
100 |
|
|
MECALUX
SERVIS SA |
MADRID |
99.99 |
|
|
MECALUX
CANARIAS SA |
BARCELONA |
100 |
|
|
MECALUX
FRANCE SARL |
|
100 |
|
|
MECALUX
ARGENTINA, SOCIEDAD ANONIMA, (ARGENTINA) |
|
90 |
|
|
MECALUX
ESTANTES LDA (PORTUGAL) |
|
99.99 |
|
|
MECALUX
DO BRASIL SISTEMAS DE ARMAZENAGEM LTDA (BRASIL) |
|
100 |
|
|
MECALUX
AUSTRIA, SOCIEDAD ANONIMA, (AUSTRIA) |
|
100 |
|
|
MECALUX
BELGIUM, SOCIEDAD ANONIMA, (BELGICA) |
|
100 |
|
|
MECALUX
CESKA REPUBLIKA SRO (REPUBLICA CHECA) |
|
100 |
|
|
MECALUX
CORPORATION (ESTADOS UNIDOS) |
|
100 |
|
|
MECALUX
GBMH (ALEMANIA) |
|
100 |
|
|
MECALUX
MEXICO, SOCIEDAD ANONIMA, DE CV (MEXICO) |
|
100 |
|
|
MECALUX
SP ZOO (POLONIA) |
|
100 |
|
|
MECALUX
CHILE LTDA (CHILE) |
|
|
|
|
ESMENA
NORTE SL |
BARCELONA |
100 |
|
|
INTERLAKE
MECALUX CANADA INC |
|
100 |
|
|
MECALUX
SLOVENSKO SRO |
|
100 |
|
|
INTERLAKE
MECALUX INC |
|
|
|
|
MECALUX
LOGISTICA INSAAT |
|
100 |
|
|
MECALUX
PERU SAC |
|
99.93 |
|
|
YESIMA
SL |
MADRID |
100 |
|
|
MECALUX
ITALIA, S.L. |
|
100 |
|
|
MECALUX
LOGISTICA SLU |
|
99.99 |
|
|
INTERLAKE
MECALUX INC (ESTADOS UNIDOS) |
|
|
|
|
MECALUX
LOGISTICA SLU (TURQUIA) |
|
99.99 |
|
|
MECALUX
SLOVENSKO SRO (ESLOVAQUIA) |
|
100 |
|
|
MECALUX
UK, SOCIEDAD ANONIMA, (REINO UNIDO) |
|
100 |
|
|
YESIMA,
SOCIEDAD LIMITADA, (URUGUAY) |
|
100 |
> Other Relationships
|
Relationship |
Entity |
Province |
Shareholding stake |
|
IS
RELATED WITH |
BANKIA
SA |
VALENCIA |
|
|
|
COMERCIAL
DE SOLDADURA SA |
BARCELONA |
|
|
|
HISCAN
PATRIMONIO S.A |
NAVARRA |
|
|
|
GRUPO
CORPORATIVO EMPRESARIAL DE LA CAJA DE AHORROS Y MONTE DE PIEDAD DE NAVARRA
S.A. |
NAVARRA |
|
|
|
LIGHT
HOUSE CONSULTING SL |
MADRID |
|
|
ABSORBS
TO |
ESTABIL
SOCIEDAD ANONIMA |
VIZCAYA |
|
|
|
DRAFER
SA |
BARCELONA |
|
|
|
LOGIS
MARKET SA |
BARCELONA |
|
|
|
MECALUX
INDUSTRIAL SA |
BARCELONA |
|
|
|
MECALUX
COMERCIAL SA |
BARCELONA |
|
|
|
ESMENA
SL |
ASTURIAS |
|
|
|
ESMENA
SL |
ASTURIAS |
|
|
HAS IN ITS ADMINISTRATION BOARD TO |
EURO
SYNS SA |
MADRID |
|
|
|
BRESLA
INVESTMENTS SL |
MADRID |
|
|
|
CARTERA
INDUSTRIAL REA SA |
MADRID |
|
|
|
ACEROLUX
SA |
BARCELONA |
|
|
|
MARCI
SA |
BARCELONA |
|
|
|
DEYA
CAPITAL S.C.R. DE REGIMEN SIMPLIFICADO SA |
MADRID |
|
|
BELONGS TO THE ADMINISTRATION BOARD OF |
LOGIS
MARKET SA |
BARCELONA |
|
|
Turnover |
|
|
Total Sales 2.013 |
180.212.000 |
Financial
Years Presented
|
Ejercicio |
Tipo de Cuentas Anuales |
Fecha Presentacion |
|
2013 |
Consolidadas |
October
2014 |
|
2013 |
Normales |
October
2014 |
|
2012 |
Consolidadas |
August
2013 |
|
2012 |
Normales |
August
2013 |
|
2011 |
Consolidadas |
January
2013 |
|
2011 |
Normales |
August
2012 |
|
2010 |
Consolidadas |
August
2011 |
|
2010 |
Normales |
November
2011 |
|
2009 |
Consolidadas |
August
2010 |
|
2009 |
Normales |
August
2010 |
|
2008 |
Consolidadas |
October
2009 |
|
2008 |
Normales |
October
2009 |
|
2007 |
Consolidadas |
December
2008 |
|
2007 |
Normales |
December
2008 |
|
2006 |
Consolidadas |
August
2007 |
|
2006 |
Normales |
August
2007 |
|
2005 |
Consolidadas |
August
2006 |
|
2005 |
Normales |
November
2006 |
|
2004 |
Consolidadas |
August
2005 |
|
2004 |
Normales |
August
2005 |
|
2003 |
Consolidadas |
August
2004 |
|
2003 |
Normales |
January
2005 |
|
2002 |
Consolidadas |
October
2003 |
|
2002 |
Normales |
October
2003 |
|
2001 |
Consolidadas |
July
2002 |
|
2001 |
Normales |
July
2002 |
|
2000 |
Consolidadas |
May
2001 |
|
2000 |
Normales |
May
2001 |
|
1999 |
Consolidadas |
August
2000 |
|
1999 |
Normales |
August
2000 |
|
1998 |
Consolidadas |
June
1999 |
|
1998 |
Normales |
June
1999 |
|
1997 |
Consolidadas |
September
1998 |
|
1997 |
Normales |
September
1998 |
|
1996 |
Consolidadas |
September
1997 |
|
1996 |
Normales |
September
1997 |
|
1995 |
Consolidadas |
July
1996 |
|
1995 |
Normales |
July
1996 |
|
1994 |
Consolidadas |
December
1995 |
|
1994 |
Normales |
October
1995 |
|
1993 |
Consolidadas |
September
1994 |
|
1993 |
Normales |
October
1995 |
|
1992 |
Normales |
August
1993 |
|
1991 |
Consolidadas |
June
1993 |
|
1991 |
Normales |
June
1993 |
|
1990 |
Normales |
August
1991 |
|
1989 |
Normales |
July
1990 |
The data in the
report regarding the last Company Accounts submitted by the company is taken
from the TRADE REGISTER serving the region in which the company's address is
located 31/12/2013
>
Balance en formato Normal de acuerdo al Nuevo Plan General Contable 2007
Information corresponding to the fiscal year
2013 2012 2011 2010 2009 is taken from information
submitted to the TRADE REGISTER. Data corresponding to fiscal years before
2013 2012 2011 2010 2009 has been compiled based on
the equivalence criteria stipulated in Act JUS/206/2009.
|
|
ORIGINAL |
ORIGINAL |
ORIGINAL |
ORIGINAL |
ORIGINAL |
|
|
Assets |
2013 |
2012 |
2011 |
2010 |
2009 |
|
|
A)
NON-CURRENT ASSETS: 11000 |
285.564.000,00 |
279.502.000,00 |
285.996.000,00 |
297.132.000,00 |
277.039.000,00 |
|
|
I. Intangible fixed assets : 11100 |
60.032.000,00 |
59.748.000,00 |
67.505.000,00 |
68.954.000,00 |
6.606.000,00 |
|
|
1. Development: 11110 |
6.461.000,00 |
6.874.000,00 |
7.904.000,00 |
7.874.000,00 |
4.922.000,00 |
|
|
2. Concessions: 11120 |
0,00 |
0,00 |
0,00 |
0,00 |
0,00 |
|
|
3.
Patents, licencing, trade marks and similar: 11130 |
151.000,00 |
140.000,00 |
166.000,00 |
149.000,00 |
150.000,00 |
|
|
4. Goodwill: 11140 |
46.200.000,00 |
46.200.000,00 |
55.000.000,00 |
58.362.000,00 |
0,00 |
|
|
5. IT applications: 11150 |
1.645.000,00 |
1.269.000,00 |
1.276.000,00 |
1.501.000,00 |
1.534.000,00 |
|
|
6. Investigation: 11160 |
0,00 |
0,00 |
0,00 |
0,00 |
0,00 |
|
|
7. Intellectual property: 11180 |
0,00 |
0,00 |
0,00 |
0,00 |
0,00 |
|
|
8. Greenhouse gas emission allowance:
11190 |
0,00 |
0,00 |
0,00 |
0,00 |
0,00 |
|
|
9. Other intangible fixed assets. :
11170 |
5.575.000,00 |
5.265.000,00 |
3.159.000,00 |
1.068.000,00 |
0,00 |
|
|
II. Tangible fixed assets : 11200 |
47.811.000,00 |
50.789.000,00 |
55.086.000,00 |
59.513.000,00 |
22.379.000,00 |
|
|
1. Land and buildings: 11210 |
17.366.000,00 |
17.889.000,00 |
18.413.000,00 |
18.933.000,00 |
0,00 |
|
|
2.
Technical installations and other tangible fixed assets: 11220 |
29.754.000,00 |
32.688.000,00 |
36.471.000,00 |
40.342.000,00 |
21.597.000,00 |
|
|
3.
Tangible asset in progress and advances: 11230 |
691.000,00 |
212.000,00 |
202.000,00 |
238.000,00 |
782.000,00 |
|
|
III. Real estate investment: 11300 |
0,00 |
0,00 |
0,00 |
0,00 |
0,00 |
|
|
1. Land: 11310 |
0,00 |
0,00 |
0,00 |
0,00 |
0,00 |
|
|
2. Buildings: 11320 |
0,00 |
0,00 |
0,00 |
0,00 |
0,00 |
|
|
IV. Long-term investments in
Group companies and associates : 11400 |
141.271.000,00 |
133.553.000,00 |
127.307.000,00 |
130.965.000,00 |
221.951.000,00 |
|
|
1. Equity instruments: 11410 |
140.925.000,00 |
133.098.000,00 |
127.015.000,00 |
87.817.000,00 |
118.144.000,00 |
|
|
2. Credits to businesses: 11420 |
346.000,00 |
455.000,00 |
292.000,00 |
43.148.000,00 |
103.807.000,00 |
|
|
3. Debt securities: 11430 |
0,00 |
0,00 |
0,00 |
0,00 |
0,00 |
|
|
4. Derivatives : 11440 |
0,00 |
0,00 |
0,00 |
0,00 |
0,00 |
|
|
5. Other financial assets : 11450 |
0,00 |
0,00 |
0,00 |
0,00 |
0,00 |
|
|
6. Other investments: 11460 |
0,00 |
0,00 |
0,00 |
0,00 |
0,00 |
|
|
V. Long-term financial
investments: 11500 |
1.033.000,00 |
1.055.000,00 |
1.013.000,00 |
1.011.000,00 |
1.115.000,00 |
|
|
1. Equity instruments: 11510 |
0,00 |
0,00 |
0,00 |
0,00 |
0,00 |
|
|
2. Credits to third parties : 11520 |
0,00 |
0,00 |
0,00 |
0,00 |
0,00 |
|
|
3. Debt securities: 11530 |
0,00 |
0,00 |
0,00 |
0,00 |
0,00 |
|
|
4. Derivatives : 11540 |
0,00 |
0,00 |
0,00 |
0,00 |
0,00 |
|
|
5. Other financial assets : 11550 |
1.033.000,00 |
1.055.000,00 |
1.013.000,00 |
1.011.000,00 |
1.115.000,00 |
|
|
6. Other investments: 11560 |
0,00 |
0,00 |
0,00 |
0,00 |
0,00 |
|
|
VI. Assets for deferred tax :
11600 |
35.417.000,00 |
34.357.000,00 |
35.085.000,00 |
36.689.000,00 |
24.988.000,00 |
|
|
VII. Non-current trade debts :
11700 |
0,00 |
0,00 |
0,00 |
0,00 |
0,00 |
|
|
B)
CURRENT ASSETS: 12000 |
85.066.000,00 |
74.684.000,00 |
96.343.000,00 |
117.009.000,00 |
123.986.000,00 |
|
|
I. Non-current assets held for
sale : 12100 |
0,00 |
0,00 |
0,00 |
564.000,00 |
0,00 |
|
|
II. Stocks: 12200 |
26.659.000,00 |
24.610.000,00 |
26.536.000,00 |
32.267.000,00 |
18.778.000,00 |
|
|
1. Commercial: 12210 |
0,00 |
0,00 |
0,00 |
0,00 |
0,00 |
|
|
2. Primary
material and other supplies: 12220 |
8.082.000,00 |
7.243.000,00 |
8.022.000,00 |
12.466.000,00 |
8.537.000,00 |
|
|
3. Work in progress: 12230 |
1.320.000,00 |
825.000,00 |
863.000,00 |
1.730.000,00 |
536.000,00 |
|
|
a) Of long-term production cycle : 12231 |
0,00 |
0,00 |
0,00 |
0,00 |
0,00 |
|
|
b) Of short-term production cycle : 12232 |
1.320.000,00 |
825.000,00 |
863.000,00 |
1.730.000,00 |
536.000,00 |
|
|
4. Finished goods: 12240 |
17.157.000,00 |
16.411.000,00 |
17.617.000,00 |
17.898.000,00 |
9.645.000,00 |
|
|
a) Of long-term production cycle : 12241 |
0,00 |
0,00 |
0,00 |
0,00 |
0,00 |
|
|
b) Of short-term production cycle : 12242 |
17.157.000,00 |
16.411.000,00 |
17.617.000,00 |
17.898.000,00 |
9.645.000,00 |
|
|
5.
By-products, residues and recycled materials: 12250 |
0,00 |
0,00 |
0,00 |
0,00 |
0,00 |
|
|
6. Advances to suppliers: 12260 |
100.000,00 |
131.000,00 |
34.000,00 |
173.000,00 |
60.000,00 |
|
|
III. Trade debtors and others
receivable accounts: 12300 |
53.208.000,00 |
43.537.000,00 |
54.956.000,00 |
61.089.000,00 |
75.841.000,00 |
|
|
1. Trade debtors / accounts receivable:
12310 |
16.889.000,00 |
23.108.000,00 |
26.284.000,00 |
31.071.000,00 |
24.682.000,00 |
|
|
a) Long-term receivables from sales and services supplied :
12311 |
0,00 |
0,00 |
0,00 |
0,00 |
0,00 |
|
|
b) Customers for sales and provisions of services : 12312 |
16.889.000,00 |
23.108.000,00 |
26.284.000,00 |
31.071.000,00 |
24.682.000,00 |
|
|
2.
Customers, Group companies and associates : 12320 |
32.227.000,00 |
19.443.000,00 |
24.965.000,00 |
28.726.000,00 |
45.366.000,00 |
|
|
3. Other accounts receivable: 12330 |
25.000,00 |
84.000,00 |
74.000,00 |
177.000,00 |
271.000,00 |
|
|
4. Personnel: 12340 |
0,00 |
0,00 |
0,00 |
0,00 |
0,00 |
|
|
5. Assets for deferred tax: 12350 |
4.067.000,00 |
902.000,00 |
3.633.000,00 |
1.115.000,00 |
5.522.000,00 |
|
|
6. Other
debtors, including tax and social security: 12360 |
0,00 |
0,00 |
0,00 |
0,00 |
0,00 |
|
|
7. Called up share capital: 12370 |
0,00 |
0,00 |
0,00 |
0,00 |
0,00 |
|
|
IV. Short-term investments in
Group companies and associates: 12400 |
0,00 |
2.220.000,00 |
1.023.000,00 |
0,00 |
0,00 |
|
|
1. Equity instruments: 12410 |
0,00 |
0,00 |
0,00 |
0,00 |
0,00 |
|
|
2. Credits to businesses: 12420 |
0,00 |
0,00 |
0,00 |
0,00 |
0,00 |
|
|
3. Debt securities: 12430 |
0,00 |
0,00 |
0,00 |
0,00 |
0,00 |
|
|
4. Derivatives : 12440 |
0,00 |
0,00 |
0,00 |
0,00 |
0,00 |
|
|
5. Other financial assets : 12450 |
0,00 |
0,00 |
0,00 |
0,00 |
0,00 |
|
|
6. Other investments: 12460 |
0,00 |
2.220.000,00 |
1.023.000,00 |
0,00 |
0,00 |
|
|
V. Short-term financial
investments : 12500 |
7.000,00 |
5.000,00 |
106.000,00 |
4.245.000,00 |
13.252.000,00 |
|
|
1. Equity instruments: 12510 |
0,00 |
0,00 |
0,00 |
0,00 |
0,00 |
|
|
2. Credits to businesses: 12520 |
0,00 |
0,00 |
0,00 |
0,00 |
0,00 |
|
|
3. Debt securities: 12530 |
0,00 |
0,00 |
0,00 |
0,00 |
0,00 |
|
|
4. Derivatives : 12540 |
0,00 |
0,00 |
0,00 |
0,00 |
0,00 |
|
|
5. Other financial assets : 12550 |
7.000,00 |
5.000,00 |
106.000,00 |
4.245.000,00 |
13.252.000,00 |
|
|
6. Other investments: 12560 |
0,00 |
0,00 |
0,00 |
0,00 |
0,00 |
|
|
VI. Short-term accruals: 12600 |
226.000,00 |
115.000,00 |
940.000,00 |
554.000,00 |
14.000,00 |
|
|
VII. Cash and other equivalent
liquid assets : 12700 |
4.966.000,00 |
4.197.000,00 |
12.782.000,00 |
18.290.000,00 |
16.101.000,00 |
|
|
1. Treasury: 12710 |
4.966.000,00 |
4.197.000,00 |
12.782.000,00 |
18.290.000,00 |
16.101.000,00 |
|
|
2. Other equivalent liquid assets:
12720 |
0,00 |
0,00 |
0,00 |
0,00 |
0,00 |
|
|
TOTAL
ASSETS (A + B) : 10000 |
370.630.000,00 |
354.186.000,00 |
382.339.000,00 |
414.141.000,00 |
401.025.000,00 |
|
|
|
ORIGINAL |
ORIGINAL |
ORIGINAL |
ORIGINAL |
ORIGINAL |
|
|
Liabilities
and Net Worth |
2013 |
2012 |
2011 |
2010 |
2009 |
|
|
A)
NET WORTH: 20000 |
246.726.000,00 |
234.424.000,00 |
255.755.000,00 |
275.262.000,00 |
281.876.000,00 |
|
|
A-1) Shareholders' equity: 21000 |
241.814.000,00 |
229.492.000,00 |
249.921.000,00 |
269.316.000,00 |
282.731.000,00 |
|
|
I. Capital: 21100 |
36.969.000,00 |
36.969.000,00 |
36.969.000,00 |
36.969.000,00 |
36.969.000,00 |
|
|
1. Registered capital : 21110 |
36.969.000,00 |
36.969.000,00 |
36.969.000,00 |
36.969.000,00 |
36.969.000,00 |
|
|
2. (Uncalled capital): 21120 |
0,00 |
0,00 |
0,00 |
0,00 |
0,00 |
|
|
II. Share premium: 21200 |
184.764.000,00 |
184.764.000,00 |
184.764.000,00 |
184.764.000,00 |
184.764.000,00 |
|
|
III. Reserves: 21300 |
86.160.000,00 |
86.160.000,00 |
86.160.000,00 |
86.160.000,00 |
74.884.000,00 |
|
|
1. Legal y estatutarias: 21310 |
6.321.000,00 |
6.321.000,00 |
6.320.000,00 |
6.320.000,00 |
6.320.000,00 |
|
|
2. Other reserves: 21320 |
79.839.000,00 |
79.839.000,00 |
79.840.000,00 |
79.840.000,00 |
68.564.000,00 |
|
|
3. Revaluation reserves: 21330 |
0,00 |
0,00 |
0,00 |
0,00 |
0,00 |
|
|
IV. (Common stock equity): 21400 |
0,00 |
0,00 |
0,00 |
0,00 |
-861.000,00 |
|
|
V. Results from previous
periods: 21500 |
-78.401.000,00 |
-57.972.000,00 |
-38.577.000,00 |
-13.025.000,00 |
0,00 |
|
|
1. Brought forward: 21510 |
0,00 |
0,00 |
0,00 |
0,00 |
0,00 |
|
|
2. (Negative
results from previous periods): 21520 |
-78.401.000,00 |
-57.972.000,00 |
-38.577.000,00 |
-13.025.000,00 |
0,00 |
|
|
VI. Other shareholders' contributions: 21600 |
0,00 |
0,00 |
0,00 |
0,00 |
0,00 |
|
|
VII. Result of the period:
21700 |
12.322.000,00 |
-20.429.000,00 |
-19.395.000,00 |
-25.552.000,00 |
-13.025.000,00 |
|
|
VIII. (Interim dividend): 21800 |
0,00 |
0,00 |
0,00 |
0,00 |
0,00 |
|
|
IX. Other net worth instruments:
21900 |
0,00 |
0,00 |
0,00 |
0,00 |
0,00 |
|
|
A-2) Adjustments due to changes
in value: 22000 |
-268.000,00 |
-583.000,00 |
-15.000,00 |
-354.000,00 |
-902.000,00 |
|
|
I. Financial assets held for
sale: 22100 |
-2.000,00 |
-5.000,00 |
-3.000,00 |
0,00 |
0,00 |
|
|
II. Hedge operations: 22200 |
-266.000,00 |
-578.000,00 |
-12.000,00 |
-354.000,00 |
-902.000,00 |
|
|
III. Linked non-current assets
and liabilities held for sale : 22300 |
0,00 |
0,00 |
0,00 |
0,00 |
0,00 |
|
|
IV. Exchange rate difference: 22400 |
0,00 |
0,00 |
0,00 |
0,00 |
0,00 |
|
|
V. Other: 22500 |
0,00 |
0,00 |
0,00 |
0,00 |
0,00 |
|
|
A-3) Received subsidies,
donations and legacies: 23000 |
5.180.000,00 |
5.515.000,00 |
5.849.000,00 |
6.300.000,00 |
47.000,00 |
|
|
B)
NON-CURRENT LIABILITIES: 31000 |
39.512.000,00 |
12.181.000,00 |
12.160.000,00 |
15.135.000,00 |
35.086.000,00 |
|
|
I. Long-term provisions: 31100 |
342.000,00 |
0,00 |
0,00 |
0,00 |
0,00 |
|
|
1.
Long-term employee benefits liability: 31110 |
0,00 |
0,00 |
0,00 |
0,00 |
0,00 |
|
|
2. Environmental actions: 31120 |
0,00 |
0,00 |
0,00 |
0,00 |
0,00 |
|
|
3. Restructuring provisions: 31130 |
0,00 |
0,00 |
0,00 |
0,00 |
0,00 |
|
|
4. Other provisions: 31140 |
342.000,00 |
0,00 |
0,00 |
0,00 |
0,00 |
|
|
II Long-term creditors: 31200 |
21.454.000,00 |
5.639.000,00 |
6.512.000,00 |
7.655.000,00 |
34.971.000,00 |
|
|
1. Liabilities and other securities:
31210 |
0,00 |
0,00 |
0,00 |
0,00 |
0,00 |
|
|
2. Amounts
owed to credit institutions: 31220 |
17.752.000,00 |
1.429.000,00 |
2.286.000,00 |
5.048.000,00 |
33.911.000,00 |
|
|
3. Creditors from financial leasing:
31230 |
0,00 |
0,00 |
0,00 |
0,00 |
0,00 |
|
|
4. Derivatives : 31240 |
0,00 |
0,00 |
0,00 |
0,00 |
0,00 |
|
|
5. Other financial liabilities :
31250 |
3.702.000,00 |
4.210.000,00 |
4.226.000,00 |
2.607.000,00 |
1.060.000,00 |
|
|
III. Long-term debts with Group
companies and associates: 31300 |
14.596.000,00 |
3.085.000,00 |
17.000,00 |
223.000,00 |
0,00 |
|
|
IV. Liabilities for deferred
tax: 31400 |
3.120.000,00 |
3.457.000,00 |
5.631.000,00 |
7.257.000,00 |
115.000,00 |
|
|
V. Long-term accruals: 31500 |
0,00 |
0,00 |
0,00 |
0,00 |
0,00 |
|
|
VI. Non-current trade creditors
: 31600 |
0,00 |
0,00 |
0,00 |
0,00 |
0,00 |
|
|
VII. Special long-term debts :
31700 |
0,00 |
0,00 |
0,00 |
0,00 |
0,00 |
|
|
C)
CURRENT LIABILITIES : 32000 |
84.392.000,00 |
107.581.000,00 |
114.424.000,00 |
123.744.000,00 |
84.063.000,00 |
|
|
I. Liabilities linked to
non-current assets held for sale: 32100 |
0,00 |
0,00 |
0,00 |
0,00 |
0,00 |
|
|
II. Short-term provisions: 32200 |
0,00 |
0,00 |
0,00 |
0,00 |
300.000,00 |
|
|
1.
Provisions from greenhouse gas emission allowance: 32210 |
0,00 |
0,00 |
0,00 |
0,00 |
0,00 |
|
|
2. Other provisions: 32220 |
0,00 |
0,00 |
0,00 |
0,00 |
0,00 |
|
|
III. Short-term creditors : 32300 |
26.149.000,00 |
57.503.000,00 |
69.951.000,00 |
80.520.000,00 |
54.182.000,00 |
|
|
1. Liabilities and other securities:
32310 |
0,00 |
0,00 |
0,00 |
0,00 |
0,00 |
|
|
2. Amounts
owed to credit institutions: 32320 |
25.142.000,00 |
56.600.000,00 |
69.405.000,00 |
80.058.000,00 |
53.923.000,00 |
|
|
3. Creditors from financial leasing:
32330 |
0,00 |
0,00 |
0,00 |
0,00 |
0,00 |
|
|
4. Derivatives : 32340 |
0,00 |
0,00 |
0,00 |
0,00 |
0,00 |
|
|
5. Other financial liabilities :
32350 |
1.007.000,00 |
903.000,00 |
546.000,00 |
462.000,00 |
259.000,00 |
|
|
IV. Short-term debts with Group
companies and associates: 32400 |
14.514.000,00 |
11.585.000,00 |
689.000,00 |
1.116.000,00 |
0,00 |
|
|
V. Trade creditors and other
accounts payable: 32500 |
43.371.000,00 |
38.046.000,00 |
43.340.000,00 |
41.632.000,00 |
28.999.000,00 |
|
|
1. Suppliers: 32510 |
15.471.000,00 |
15.627.000,00 |
15.813.000,00 |
14.854.000,00 |
7.357.000,00 |
|
|
a) Long-term debts :
32511 |
0,00 |
0,00 |
0,00 |
0,00 |
0,00 |
|
|
b) Short-term debts :
32512 |
15.471.000,00 |
15.627.000,00 |
15.813.000,00 |
14.854.000,00 |
7.357.000,00 |
|
|
2.
Suppliers, Group companies and associates: 32520 |
10.247.000,00 |
4.297.000,00 |
9.559.000,00 |
3.969.000,00 |
7.274.000,00 |
|
|
3. Other creditors: 32530 |
9.472.000,00 |
10.632.000,00 |
10.207.000,00 |
10.254.000,00 |
8.484.000,00 |
|
|
4. Personnel (remuneration due):
32540 |
3.385.000,00 |
4.057.000,00 |
4.992.000,00 |
3.967.000,00 |
2.455.000,00 |
|
|
5. Liabilities for current tax:
32550 |
2.331.000,00 |
2.151.000,00 |
2.125.000,00 |
2.516.000,00 |
3.429.000,00 |
|
|
6. Other
accounts payable to Public Administrations.: 32560 |
0,00 |
0,00 |
0,00 |
0,00 |
0,00 |
|
|
7. Advances from clients: 32570 |
2.465.000,00 |
1.282.000,00 |
644.000,00 |
6.072.000,00 |
0,00 |
|
|
VI. Short-term accruals: 32600 |
358.000,00 |
447.000,00 |
444.000,00 |
476.000,00 |
582.000,00 |
|
|
VII. Special short-term debts :
32700 |
0,00 |
0,00 |
0,00 |
0,00 |
0,00 |
|
|
TOTAL NET WORTH AND LIABILITIES (A + B + C) :
30000 |
370.630.000,00 |
354.186.000,00 |
382.339.000,00 |
414.141.000,00 |
401.025.000,00 |
|
|
|
ORIGINAL |
ORIGINAL |
ORIGINAL |
ORIGINAL |
ORIGINAL |
|
|
Profit
and Loss |
2013 |
2012 |
2011 |
2010 |
2009 |
|
|
1.
Net turnover: 40100 |
202.536.000,00 |
176.719.000,00 |
182.469.000,00 |
170.780.000,00 |
127.939.000,00 |
|
|
a) Sales: 40110 |
172.089.000,00 |
169.014.000,00 |
176.185.000,00 |
167.425.000,00 |
109.165.000,00 |
|
|
b) Rendering of services: 40120 |
8.123.000,00 |
7.705.000,00 |
6.284.000,00 |
3.355.000,00 |
18.774.000,00 |
|
|
c) Income of financial nature
of holding companies: 40130 |
22.324.000,00 |
0,00 |
0,00 |
0,00 |
0,00 |
|
|
2. Changes in stocks of finished goods and work in
progress: 40200 |
1.241.000,00 |
-1.244.000,00 |
-1.148.000,00 |
9.447.000,00 |
-3.742.000,00 |
|
|
3. Works carried out by the company for its assets:
40300 |
3.078.000,00 |
3.064.000,00 |
3.583.000,00 |
5.344.000,00 |
3.602.000,00 |
|
|
4.
Supplies : 40400 |
-94.046.000,00 |
-93.005.000,00 |
-100.843.000,00 |
-104.934.000,00 |
-75.830.000,00 |
|
|
a) Stock consumption: 40410 |
-13.949.000,00 |
-16.066.000,00 |
-20.224.000,00 |
-26.464.000,00 |
-33.117.000,00 |
|
|
b) Consumption of raw materials
and miscellaneous consumable ones: 40420 |
-79.949.000,00 |
-76.886.000,00 |
-80.445.000,00 |
-78.441.000,00 |
-42.713.000,00 |
|
|
c) Works carried out by other
companies: 40430 |
-148.000,00 |
-53.000,00 |
-174.000,00 |
-29.000,00 |
0,00 |
|
|
d) Impairment of stock, primary
material and other supplies: 40440 |
0,00 |
0,00 |
0,00 |
0,00 |
0,00 |
|
|
5.
Other operating income: 40500 |
6.349.000,00 |
4.733.000,00 |
4.985.000,00 |
18.000,00 |
0,00 |
|
|
a) Auxiliary income and other
from current management: 40510 |
6.316.000,00 |
4.684.000,00 |
4.849.000,00 |
3.000,00 |
0,00 |
|
|
b) Operation subsidies included
in the Period's result: 40520 |
33.000,00 |
49.000,00 |
136.000,00 |
15.000,00 |
0,00 |
|
|
6.
Personnel costs: 40600 |
-52.656.000,00 |
-53.919.000,00 |
-57.751.000,00 |
-56.575.000,00 |
-37.859.000,00 |
|
|
a) Wages, salaries et al.:
40610 |
-39.967.000,00 |
-41.549.000,00 |
-45.816.000,00 |
-44.608.000,00 |
-30.152.000,00 |
|
|
b) Social security costs: 40620 |
-12.689.000,00 |
-12.370.000,00 |
-11.935.000,00 |
-11.967.000,00 |
-7.707.000,00 |
|
|
c) Provisions : 40630 |
0,00 |
0,00 |
0,00 |
0,00 |
0,00 |
|
|
7.
Other operating costs: 40700 |
-41.045.000,00 |
-44.813.000,00 |
-46.978.000,00 |
-47.576.000,00 |
-36.873.000,00 |
|
|
a) External services: 40710 |
-39.230.000,00 |
-43.388.000,00 |
-46.643.000,00 |
-47.025.000,00 |
-36.339.000,00 |
|
|
b) Taxes: 40720 |
-403.000,00 |
-372.000,00 |
-401.000,00 |
-295.000,00 |
-212.000,00 |
|
|
c) Losses, impairments and
variation in provisions from trade operations : 40730 |
-1.330.000,00 |
-1.034.000,00 |
76.000,00 |
-208.000,00 |
-440.000,00 |
|
|
d) Other current management
expenditure : 40740 |
-82.000,00 |
-19.000,00 |
-10.000,00 |
-48.000,00 |
118.000,00 |
|
|
e) Expenses due to greenhouse
gas emissions: 40750 |
0,00 |
0,00 |
0,00 |
0,00 |
0,00 |
|
|
8.
Amortisation of fixed assets: 40800 |
-8.398.000,00 |
-8.792.000,00 |
-9.564.000,00 |
-9.906.000,00 |
-5.657.000,00 |
|
|
9. Allocation of subsidies of non-financial fixed
assets and other: 40900 |
479.000,00 |
489.000,00 |
652.000,00 |
630.000,00 |
16.000,00 |
|
|
10.
Excess provisions : 41000 |
32.000,00 |
48.000,00 |
86.000,00 |
11.000,00 |
45.000,00 |
|
|
11. Impairment and result of transfers of fixed
assets: 41100 |
12.000,00 |
-8.652.000,00 |
-2.712.000,00 |
-1.037.000,00 |
-124.000,00 |
|
|
a) Impairment and losses : 41110 |
0,00 |
-8.800.000,00 |
-3.362.000,00 |
0,00 |
-119.000,00 |
|
|
b) Results for transfers and
other : 41120 |
12.000,00 |
148.000,00 |
650.000,00 |
-1.037.000,00 |
-5.000,00 |
|
|
c) Impairment and profit due to
disposals of assets of holding companies: 41130 |
0,00 |
0,00 |
0,00 |
0,00 |
0,00 |
|
|
12. Negative difference in combined businesses:
41200 |
0,00 |
0,00 |
0,00 |
0,00 |
0,00 |
|
|
13.
Other results : 41300 |
0,00 |
0,00 |
0,00 |
0,00 |
0,00 |
|
|
A.1)
OPERATING INCOME (1 + 2 + 3 + 4 + 5 + 6 + 7 + 8 + 9 + 10 + 11 + 12 + 13) :
49100 |
17.582.000,00 |
-25.372.000,00 |
-27.221.000,00 |
-33.798.000,00 |
-28.483.000,00 |
|
|
14.
Financial income : 41400 |
112.000,00 |
14.294.000,00 |
10.946.000,00 |
2.574.000,00 |
17.598.000,00 |
|
|
a) Of shares in equity
instruments : 41410 |
0,00 |
14.136.000,00 |
10.501.000,00 |
2.239.000,00 |
16.524.000,00 |
|
|
a 1) In
Group companies and associates: 41411 |
0,00 |
14.136.000,00 |
10.501.000,00 |
2.239.000,00 |
16.524.000,00 |
|
|
a 2) In third parties: 41412 |
0,00 |
0,00 |
0,00 |
0,00 |
0,00 |
|
|
b) From negotiable securities
and other financial instruments : 41420 |
112.000,00 |
158.000,00 |
445.000,00 |
335.000,00 |
1.074.000,00 |
|
|
b 1) From
Group companies and associates : 41421 |
0,00 |
0,00 |
0,00 |
0,00 |
0,00 |
|
|
b 2) From third parties : 41422 |
112.000,00 |
158.000,00 |
445.000,00 |
335.000,00 |
1.074.000,00 |
|
|
c) Allocation of financial
subsidies, donations and legacies : 41430 |
0,00 |
0,00 |
0,00 |
0,00 |
0,00 |
|
|
15.
Financial expenditure: 41500 |
-4.086.000,00 |
-4.309.000,00 |
-5.230.000,00 |
-3.940.000,00 |
-3.746.000,00 |
|
|
a) Amounts owed to Group
companies and associates : 41510 |
-1.178.000,00 |
-179.000,00 |
-690.000,00 |
0,00 |
0,00 |
|
|
b) For debts with third parties
: 41520 |
-2.908.000,00 |
-4.130.000,00 |
-4.540.000,00 |
-3.940.000,00 |
-3.746.000,00 |
|
|
c) Stock renewal : 41530 |
0,00 |
0,00 |
0,00 |
0,00 |
0,00 |
|
|
16. Changes in fair value of financial instruments :
41600 |
0,00 |
0,00 |
20.000,00 |
0,00 |
0,00 |
|
|
a) Trading book and other :
41610 |
0,00 |
0,00 |
0,00 |
0,00 |
0,00 |
|
|
b) Allocation of financial assets
held for sale to the result for the period: 41620 |
0,00 |
0,00 |
20.000,00 |
0,00 |
0,00 |
|
|
17.
Exchange rate differences : 41700 |
-781.000,00 |
-199.000,00 |
-1.672.000,00 |
3.355.000,00 |
-3.727.000,00 |
|
|
18. Impairment and result for transfers of financial
instruments: 41800 |
-505.000,00 |
-5.693.000,00 |
4.845.000,00 |
256.000,00 |
-1.166.000,00 |
|
|
a) Impairment and losses : 41810 |
-505.000,00 |
-5.693.000,00 |
4.845.000,00 |
256.000,00 |
-1.166.000,00 |
|
|
b) Results for transfers and
other : 41820 |
0,00 |
0,00 |
0,00 |
0,00 |
0,00 |
|
|
19. Other financial income and expenditure:
42100 |
0,00 |
0,00 |
0,00 |
0,00 |
0,00 |
|
|
a) Incorporation of financial
expenditure to assets: 42110 |
0,00 |
0,00 |
0,00 |
0,00 |
0,00 |
|
|
b) Financial income from
arrangement with creditors: 42120 |
0,00 |
0,00 |
0,00 |
0,00 |
0,00 |
|
|
c) Other income and
expenditure: 42130 |
0,00 |
0,00 |
0,00 |
0,00 |
0,00 |
|
|
A.2)
FINANCIAL REVENUE (14+15+16+17+18+19) : 49200 |
-5.260.000,00 |
4.093.000,00 |
8.909.000,00 |
2.245.000,00 |
8.959.000,00 |
|
|
A.3) NET RESULT BEFORE TAXES (A.1+A.2) : 49300 |
12.322.000,00 |
-21.279.000,00 |
-18.312.000,00 |
-31.553.000,00 |
-19.524.000,00 |
|
|
20.
Income taxes: 41900 |
0,00 |
850.000,00 |
-1.083.000,00 |
6.001.000,00 |
6.499.000,00 |
|
|
A.4) PROFIT AFTER TAXES (A.3+20) : 49400 |
12.322.000,00 |
-20.429.000,00 |
-19.395.000,00 |
-25.552.000,00 |
-13.025.000,00 |
|
|
21. Result of the year coming from interrupted
operations : 42000 |
0,00 |
0,00 |
0,00 |
0,00 |
0,00 |
|
|
A.5) RESULT OF THE PERIOD (A.4+21) : 49500 |
12.322.000,00 |
-20.429.000,00 |
-19.395.000,00 |
-25.552.000,00 |
-13.025.000,00 |
|
> Normal Balance Sheet under the rules of the 1990 General Accounting
Plan (repealed since 1st January of 2008)
Information
corresponding to the fiscal year
2013 2012 2011 2010 2009 has been compiled based on
the equivalence criteria stipulated in Act JUS/206/2009. The methodology
2013 2012 2011 2010 2009 is taken from information
submitted to the TRADE REGISTER.
|
|
EQUIVALENCIA |
EQUIVALENCIA |
EQUIVALENCIA |
EQUIVALENCIA |
EQUIVALENCIA |
|
|
ASSETS |
2013 |
2012 |
2011 |
2010 |
2009 |
|
|
A) SHAREHOLDERS (PARTNERS) BY UNCALLED SUSCRIBED
CAPITAL: |
0,00 |
0,00 |
0,00 |
0,00 |
0,00 |
|
|
B)
FIXED ASSETS: |
250.147.000,00 |
245.145.000,00 |
250.911.000,00 |
261.007.000,00 |
252.912.000,00 |
|
|
I. Formation expenses: |
0,00 |
0,00 |
0,00 |
0,00 |
0,00 |
|
|
II. Intangible fixed assets: |
60.032.000,00 |
59.748.000,00 |
67.505.000,00 |
68.954.000,00 |
6.606.000,00 |
|
|
1. Research and development costs: |
6.461.000,00 |
6.874.000,00 |
7.904.000,00 |
7.874.000,00 |
4.922.000,00 |
|
|
2. Concessions,
patents, licences, trademarks et al.: |
151.000,00 |
140.000,00 |
166.000,00 |
149.000,00 |
150.000,00 |
|
|
3. Goodwill: |
46.200.000,00 |
46.200.000,00 |
55.000.000,00 |
58.362.000,00 |
0,00 |
|
|
4. Key
money paid for premises: |
0,00 |
0,00 |
0,00 |
0,00 |
0,00 |
|
|
5. Software: |
1.645.000,00 |
1.269.000,00 |
1.276.000,00 |
1.501.000,00 |
1.534.000,00 |
|
|
6. Assets under capital leases: |
0,00 |
0,00 |
0,00 |
0,00 |
0,00 |
|
|
7. Payments on account: |
5.575.000,00 |
5.265.000,00 |
3.159.000,00 |
1.068.000,00 |
0,00 |
|
|
8. Provisions: |
0,00 |
0,00 |
0,00 |
0,00 |
0,00 |
|
|
9. Accumulated depreciation: |
0,00 |
0,00 |
0,00 |
0,00 |
0,00 |
|
|
III. Tangible fixed assets: |
47.811.000,00 |
50.789.000,00 |
55.086.000,00 |
60.077.000,00 |
22.379.000,00 |
|
|
1. Land and construction: |
17.366.000,00 |
17.889.000,00 |
18.413.000,00 |
19.497.000,00 |
0,00 |
|
|
2. Technical installations and machinery:
|
16.314.162,00 |
17.922.878,00 |
19.997.102,00 |
22.119.577,00 |
11.841.667,00 |
|
|
3. Other installations,
tools and furniture: |
9.440.290,00 |
10.371.183,00 |
11.571.446,00 |
12.799.629,00 |
6.852.253,00 |
|
|
4.
Payments on account and tangible fixed assets under construction: |
691.000,00 |
212.000,00 |
202.000,00 |
238.000,00 |
782.000,00 |
|
|
5. Other tangible assets: |
3.999.549,00 |
4.393.939,00 |
4.902.452,00 |
5.422.794,00 |
2.903.081,00 |
|
|
6. Provisions: |
0,00 |
0,00 |
0,00 |
0,00 |
0,00 |
|
|
7. Accumulated depreciation: |
0,00 |
0,00 |
0,00 |
0,00 |
0,00 |
|
|
IV. Financial investments: |
142.304.000,00 |
134.608.000,00 |
128.320.000,00 |
131.976.000,00 |
223.066.000,00 |
|
|
1. Equity investments
in group companies: |
140.925.000,00 |
133.098.000,00 |
127.015.000,00 |
87.817.000,00 |
118.144.000,00 |
|
|
2. Receivables from group companies:
|
346.000,00 |
455.000,00 |
292.000,00 |
43.148.000,00 |
103.807.000,00 |
|
|
3. Equity
investment in associated companies: |
0,00 |
0,00 |
0,00 |
0,00 |
0,00 |
|
|
4. Credits to associated companies: |
0,00 |
0,00 |
0,00 |
0,00 |
0,00 |
|
|
5. Long-term securities portfolio: |
0,00 |
0,00 |
0,00 |
0,00 |
0,00 |
|
|
6. Other receivables: |
0,00 |
0,00 |
0,00 |
0,00 |
0,00 |
|
|
7. Long
term guarantees and deposits: |
1.033.000,00 |
1.055.000,00 |
1.013.000,00 |
1.011.000,00 |
1.115.000,00 |
|
|
8. Provisions: |
0,00 |
0,00 |
0,00 |
0,00 |
0,00 |
|
|
9.
Long-term receivables from public bodies: |
0,00 |
0,00 |
0,00 |
0,00 |
0,00 |
|
|
V. Own shares: |
0,00 |
0,00 |
0,00 |
0,00 |
861.000,00 |
|
|
VI. Long-term trade
receivables: |
0,00 |
0,00 |
0,00 |
0,00 |
0,00 |
|
|
C)
Deferred expenses: |
0,00 |
0,00 |
0,00 |
0,00 |
0,00 |
|
|
D)
CURRENT ASSETS: |
120.483.000,00 |
109.041.000,00 |
131.428.000,00 |
153.134.000,00 |
148.974.000,00 |
|
|
I. Called-up share capital (not
paid): |
0,00 |
0,00 |
0,00 |
0,00 |
0,00 |
|
|
II. Stocks: |
26.659.000,00 |
24.610.000,00 |
26.536.000,00 |
32.267.000,00 |
18.778.000,00 |
|
|
1. Goods for resale: |
0,00 |
0,00 |
0,00 |
0,00 |
0,00 |
|
|
2. Raw
materials and other consumables: |
8.082.000,00 |
7.243.000,00 |
8.022.000,00 |
12.466.000,00 |
8.537.000,00 |
|
|
3. Goods
in process and semifinished ones: |
1.320.000,00 |
825.000,00 |
863.000,00 |
1.730.000,00 |
536.000,00 |
|
|
4. Finished products: |
17.157.000,00 |
16.411.000,00 |
17.617.000,00 |
17.898.000,00 |
9.645.000,00 |
|
|
5.
Byproducts, scrap and recovered materials: |
0,00 |
0,00 |
0,00 |
0,00 |
0,00 |
|
|
6. Payments on account: |
100.000,00 |
131.000,00 |
34.000,00 |
173.000,00 |
60.000,00 |
|
|
7. Provisions: |
0,00 |
0,00 |
0,00 |
0,00 |
0,00 |
|
|
III. Debtors: |
88.625.000,00 |
77.894.000,00 |
90.041.000,00 |
97.778.000,00 |
100.829.000,00 |
|
|
1. Trade debtors / accounts receivable:
|
16.889.000,00 |
23.108.000,00 |
26.284.000,00 |
31.071.000,00 |
24.682.000,00 |
|
|
2. Accounts receivable, Group companies:
|
32.227.000,00 |
19.443.000,00 |
24.965.000,00 |
28.726.000,00 |
45.366.000,00 |
|
|
3. Accounts receivable, associated
companies: |
0,00 |
0,00 |
0,00 |
0,00 |
0,00 |
|
|
4. Other debtors: |
25.000,00 |
84.000,00 |
74.000,00 |
177.000,00 |
271.000,00 |
|
|
5. Staff: |
0,00 |
0,00 |
0,00 |
0,00 |
0,00 |
|
|
6. Public bodies: |
39.484.000,00 |
35.259.000,00 |
38.718.000,00 |
37.804.000,00 |
30.510.000,00 |
|
|
7. Provisions: |
0,00 |
0,00 |
0,00 |
0,00 |
0,00 |
|
|
IV. Short-term investments: |
7.000,00 |
2.225.000,00 |
1.129.000,00 |
4.245.000,00 |
13.252.000,00 |
|
|
1. Equity
investments in group companies: |
0,00 |
0,00 |
0,00 |
0,00 |
0,00 |
|
|
2. Receivables from group companies:
|
0,00 |
0,00 |
0,00 |
0,00 |
0,00 |
|
|
3. Equity
investment in associated companies: |
0,00 |
0,00 |
0,00 |
0,00 |
0,00 |
|
|
4. Credits to associated companies: |
0,00 |
0,00 |
0,00 |
0,00 |
0,00 |
|
|
5. Short term securities portfolio: |
0,00 |
0,00 |
0,00 |
0,00 |
0,00 |
|
|
6. Other receivables: |
0,00 |
2.220.000,00 |
1.023.000,00 |
0,00 |
0,00 |
|
|
7. Shor
term guarantees and deposits: |
7.000,00 |
5.000,00 |
106.000,00 |
4.245.000,00 |
13.252.000,00 |
|
|
8. Provisions: |
0,00 |
0,00 |
0,00 |
0,00 |
0,00 |
|
|
V. Short-term treasury shares:
|
0,00 |
0,00 |
0,00 |
0,00 |
0,00 |
|
|
VI. Cash at bank and in hand:
|
4.966.000,00 |
4.197.000,00 |
12.782.000,00 |
18.290.000,00 |
16.101.000,00 |
|
|
VII. Prepayments and accrued
income: |
226.000,00 |
115.000,00 |
940.000,00 |
554.000,00 |
14.000,00 |
|
|
GENERAL
TOTAL (A + B + C + D): |
370.630.000,00 |
354.186.000,00 |
382.339.000,00 |
414.141.000,00 |
401.886.000,00 |
|
MERCANTILE REGISTRY.
|
|
EQUIVALENCIA |
EQUIVALENCIA |
EQUIVALENCIA |
EQUIVALENCIA |
EQUIVALENCIA |
|
|
LIABILITIES |
2013 |
2012 |
2011 |
2010 |
2009 |
|
|
A)
EQUITY: |
243.100.000,00 |
230.563.500,00 |
251.660.700,00 |
270.852.000,00 |
282.704.100,00 |
|
|
I. Subscribed capital: |
36.969.000,00 |
36.969.000,00 |
36.969.000,00 |
36.969.000,00 |
36.969.000,00 |
|
|
II. Share premium: |
184.764.000,00 |
184.764.000,00 |
184.764.000,00 |
184.764.000,00 |
184.764.000,00 |
|
|
III. Revaluation reserves: |
1.621.043,00 |
1.642.799,00 |
1.678.616,00 |
1.710.910,00 |
1.450.247,00 |
|
|
IV. Reserves: |
85.824.957,00 |
85.588.701,00 |
86.221.084,00 |
85.985.090,00 |
72.545.853,00 |
|
|
1. Legal reserve: |
6.321.000,00 |
6.321.000,00 |
6.320.000,00 |
6.320.000,00 |
6.320.000,00 |
|
|
2. Reserves for own shares: |
0,00 |
0,00 |
0,00 |
0,00 |
0,00 |
|
|
3.
Reserves for shares of the controlling company: |
0,00 |
0,00 |
0,00 |
0,00 |
0,00 |
|
|
4. Statutory reserves: |
0,00 |
0,00 |
0,00 |
0,00 |
0,00 |
|
|
5. Miscellaneous reserves: |
79.503.957,00 |
79.267.701,00 |
79.901.084,00 |
79.665.090,00 |
66.225.853,00 |
|
|
Differences due to capital adjustement to euros: |
0,00 |
0,00 |
0,00 |
0,00 |
0,00 |
|
|
V. Profit or loss brought
forward: |
-78.401.000,00 |
-57.972.000,00 |
-38.577.000,00 |
-13.025.000,00 |
0,00 |
|
|
1. Retained earnings: |
0,00 |
0,00 |
0,00 |
0,00 |
0,00 |
|
|
2. Prior year losses: |
-78.401.000,00 |
-57.972.000,00 |
-38.577.000,00 |
-13.025.000,00 |
0,00 |
|
|
3.
Partners' contributions so as to compensate losses: |
0,00 |
0,00 |
0,00 |
0,00 |
0,00 |
|
|
VI. Profit or loss for the
financial year: |
12.322.000,00 |
-20.429.000,00 |
-19.395.000,00 |
-25.552.000,00 |
-13.025.000,00 |
|
|
VII. Interim dividend paid: |
0,00 |
0,00 |
0,00 |
0,00 |
0,00 |
|
|
VIII. Own shares for capital reduction: |
0,00 |
0,00 |
0,00 |
0,00 |
0,00 |
|
|
B)
Deferred income: |
3.626.000,00 |
3.860.500,00 |
4.094.300,00 |
4.410.000,00 |
32.900,00 |
|
|
1. Capital grants: |
3.626.000,00 |
3.860.500,00 |
4.094.300,00 |
4.410.000,00 |
32.900,00 |
|
|
2. Unrealised exchange gains: |
0,00 |
0,00 |
0,00 |
0,00 |
0,00 |
|
|
3. Other deferred income: |
0,00 |
0,00 |
0,00 |
0,00 |
0,00 |
|
|
4. Public
revenues to distribute in several financial years: |
0,00 |
0,00 |
0,00 |
0,00 |
0,00 |
|
|
C) PROVISIONS FOR LIABILITIES AND CHARGES: |
342.000,00 |
0,00 |
0,00 |
0,00 |
0,00 |
|
|
1. Provisions
for pension fund and other similar obligations: |
0,00 |
0,00 |
0,00 |
0,00 |
0,00 |
|
|
2. Provisions for taxes: |
0,00 |
0,00 |
0,00 |
0,00 |
0,00 |
|
|
3. Other provisions: |
342.000,00 |
0,00 |
0,00 |
0,00 |
0,00 |
|
|
4. Reversion fund: |
0,00 |
0,00 |
0,00 |
0,00 |
0,00 |
|
|
D)
LONG TERM LIABILITIES: |
39.170.000,00 |
12.181.000,00 |
12.160.000,00 |
15.135.000,00 |
35.086.000,00 |
|
|
I. Issued debentures and other
marketable securities: |
0,00 |
0,00 |
0,00 |
0,00 |
0,00 |
|
|
1. Non-convertible debentures: |
0,00 |
0,00 |
0,00 |
0,00 |
0,00 |
|
|
2. Convertible debentures: |
0,00 |
0,00 |
0,00 |
0,00 |
0,00 |
|
|
3. Other debt securities: |
0,00 |
0,00 |
0,00 |
0,00 |
0,00 |
|
|
II. Amounts owed to credit
institutions: |
17.752.000,00 |
1.429.000,00 |
2.286.000,00 |
5.048.000,00 |
33.911.000,00 |
|
|
1. Loans and other liabilities: |
17.752.000,00 |
1.429.000,00 |
2.286.000,00 |
5.048.000,00 |
33.911.000,00 |
|
|
2.
Long-term liabilities from capital leases: |
0,00 |
0,00 |
0,00 |
0,00 |
0,00 |
|
|
III. Debts with companies of
the group and affiliated ones: |
14.596.000,00 |
3.085.000,00 |
17.000,00 |
223.000,00 |
0,00 |
|
|
1. Amounts
owed to group companies: |
14.596.000,00 |
3.085.000,00 |
17.000,00 |
223.000,00 |
0,00 |
|
|
2. Amounts
owed to associated companies: |
0,00 |
0,00 |
0,00 |
0,00 |
0,00 |
|
|
IV. Other creditors: |
6.822.000,00 |
7.667.000,00 |
9.857.000,00 |
9.864.000,00 |
1.175.000,00 |
|
|
1. Long-term
bills of exchange payable: |
0,00 |
0,00 |
0,00 |
0,00 |
0,00 |
|
|
2. Other creditors: |
3.702.000,00 |
4.210.000,00 |
4.226.000,00 |
2.607.000,00 |
1.060.000,00 |
|
|
3. Long term
guarantees and deposits received: |
0,00 |
0,00 |
0,00 |
0,00 |
0,00 |
|
|
4. Long
term payables to public bodies: |
3.120.000,00 |
3.457.000,00 |
5.631.000,00 |
7.257.000,00 |
115.000,00 |
|
|
V. Unpaid portion of equity
investment: |
0,00 |
0,00 |
0,00 |
0,00 |
0,00 |
|
|
1. Group companies: |
0,00 |
0,00 |
0,00 |
0,00 |
0,00 |
|
|
2. Associated companies: |
0,00 |
0,00 |
0,00 |
0,00 |
0,00 |
|
|
3. Third parties: |
0,00 |
0,00 |
0,00 |
0,00 |
0,00 |
|
|
VI. Long term trade creditors:
|
0,00 |
0,00 |
0,00 |
0,00 |
0,00 |
|
|
E)
SHORT TERM CREDITORS: |
84.392.000,00 |
107.581.000,00 |
114.424.000,00 |
123.744.000,00 |
83.763.000,00 |
|
|
I. Issued debentures and other
marketable securities: |
0,00 |
0,00 |
0,00 |
0,00 |
0,00 |
|
|
1. Non-convertible debentures: |
0,00 |
0,00 |
0,00 |
0,00 |
0,00 |
|
|
2. Convertible debentures: |
0,00 |
0,00 |
0,00 |
0,00 |
0,00 |
|
|
3. Other debt securities: |
0,00 |
0,00 |
0,00 |
0,00 |
0,00 |
|
|
4. Accrued
interest on debentures and other debt securities: |
0,00 |
0,00 |
0,00 |
0,00 |
0,00 |
|
|
II. Amounts owed to credit
institutions: |
25.142.000,00 |
56.600.000,00 |
69.405.000,00 |
80.058.000,00 |
53.923.000,00 |
|
|
1. Loans and other liabilities: |
25.142.000,00 |
56.600.000,00 |
69.405.000,00 |
80.058.000,00 |
53.923.000,00 |
|
|
2. Accrued
interest on liabilities with credit institutions: |
0,00 |
0,00 |
0,00 |
0,00 |
0,00 |
|
|
3.
Short-term liabilities from capital leases: |
0,00 |
0,00 |
0,00 |
0,00 |
0,00 |
|
|
III. Short-term amounts owed to
group and associated companies: |
24.761.000,00 |
15.882.000,00 |
10.248.000,00 |
5.085.000,00 |
7.274.000,00 |
|
|
1. Amounts
owed to group companies: |
24.761.000,00 |
15.882.000,00 |
10.248.000,00 |
5.085.000,00 |
7.274.000,00 |
|
|
2. Amounts
owed to associated companies: |
0,00 |
0,00 |
0,00 |
0,00 |
0,00 |
|
|
IV. Trade creditors: |
27.408.000,00 |
27.541.000,00 |
26.664.000,00 |
31.180.000,00 |
15.841.000,00 |
|
|
1. Advanced payments from customers:
|
2.465.000,00 |
1.282.000,00 |
644.000,00 |
6.072.000,00 |
0,00 |
|
|
2. Amounts
owed for purchases of goods or services: |
24.943.000,00 |
26.259.000,00 |
26.020.000,00 |
25.108.000,00 |
15.841.000,00 |
|
|
3. Debts
represented by notes payable: |
0,00 |
0,00 |
0,00 |
0,00 |
0,00 |
|
|
V. Other creditors: |
6.723.000,00 |
7.111.000,00 |
7.663.000,00 |
6.945.000,00 |
6.143.000,00 |
|
|
1. Public bodies: |
2.331.000,00 |
2.151.000,00 |
2.125.000,00 |
2.516.000,00 |
3.429.000,00 |
|
|
2. Bills of exchange payable: |
0,00 |
0,00 |
0,00 |
0,00 |
0,00 |
|
|
3. Miscellaneous debts: |
1.007.000,00 |
903.000,00 |
546.000,00 |
462.000,00 |
259.000,00 |
|
|
4. Wages and salaries payable: |
3.385.000,00 |
4.057.000,00 |
4.992.000,00 |
3.967.000,00 |
2.455.000,00 |
|
|
5.
Guarantees and deposits received at short term: |
0,00 |
0,00 |
0,00 |
0,00 |
0,00 |
|
|
VI. Provisions: |
0,00 |
0,00 |
0,00 |
0,00 |
0,00 |
|
|
VII. Prepayments and accrued
income: |
358.000,00 |
447.000,00 |
444.000,00 |
476.000,00 |
582.000,00 |
|
|
F) SHORT-TERM PROVISIONS FOR LIABILITIES AND
CHARGES: |
0,00 |
0,00 |
0,00 |
0,00 |
300.000,00 |
|
|
GENERAL
TOTAL (A + B + C + D + E + F): |
370.630.000,00 |
354.186.000,00 |
382.339.000,00 |
414.141.000,00 |
401.886.000,00 |
|
MERCANTILE REGISTRY.
|
|
EQUIVALENCIA |
EQUIVALENCIA |
EQUIVALENCIA |
EQUIVALENCIA |
EQUIVALENCIA |
|
|
DEBIT |
2013 |
2012 |
2011 |
2010 |
2009 |
|
|
A) CHARGES (A.1 to A.15): |
201.517.000,00 |
219.924.000,00 |
222.786.000,00 |
217.711.000,00 |
162.225.000,00 |
|
|
A.1. Stock
reduction of both manufactured goods and the ones in process: |
0,00 |
1.244.000,00 |
1.148.000,00 |
0,00 |
3.742.000,00 |
|
|
A.2. Supplies: |
94.046.000,00 |
93.005.000,00 |
100.843.000,00 |
104.934.000,00 |
75.830.000,00 |
|
|
a) Stock consumption:
|
13.949.000,00 |
16.066.000,00 |
20.224.000,00 |
26.464.000,00 |
33.117.000,00 |
|
|
b) Consumption of raw materials and miscellaneous consumable
ones: |
79.949.000,00 |
76.886.000,00 |
80.445.000,00 |
78.441.000,00 |
42.713.000,00 |
|
|
c) Miscellaneous
external expenditure: |
148.000,00 |
53.000,00 |
174.000,00 |
29.000,00 |
0,00 |
|
|
A.3. Staff costs: |
52.656.000,00 |
53.919.000,00 |
57.751.000,00 |
56.575.000,00 |
37.859.000,00 |
|
|
a) Wages, salaries et al.: |
39.967.000,00 |
41.549.000,00 |
45.816.000,00 |
44.608.000,00 |
30.152.000,00 |
|
|
b) Social security
costs: |
12.689.000,00 |
12.370.000,00 |
11.935.000,00 |
11.967.000,00 |
7.707.000,00 |
|
|
A.4. Depreciation expense: |
8.398.000,00 |
8.792.000,00 |
9.564.000,00 |
9.906.000,00 |
5.657.000,00 |
|
|
A.5.
Variation of trade provisions and losses of unrecovered receivables: |
1.330.000,00 |
1.034.000,00 |
-76.000,00 |
208.000,00 |
440.000,00 |
|
|
a) Stock provision
variation: |
0,00 |
0,00 |
0,00 |
0,00 |
0,00 |
|
|
b) Variation in provision and bad debt losses: |
1.330.000,00 |
1.034.000,00 |
-76.000,00 |
208.000,00 |
440.000,00 |
|
|
c) Variation of other trade provisions: |
0,00 |
0,00 |
0,00 |
0,00 |
0,00 |
|
|
A.6. Other operating charges: |
39.715.000,00 |
43.779.000,00 |
47.054.000,00 |
47.368.000,00 |
36.433.000,00 |
|
|
a) External services:
|
39.230.000,00 |
43.388.000,00 |
46.643.000,00 |
47.025.000,00 |
36.339.000,00 |
|
|
b) Taxes: |
403.000,00 |
372.000,00 |
401.000,00 |
295.000,00 |
212.000,00 |
|
|
c) Other operating
expenses: |
82.000,00 |
19.000,00 |
10.000,00 |
48.000,00 |
-118.000,00 |
|
|
d) Allocation to revision fund: |
0,00 |
0,00 |
0,00 |
0,00 |
0,00 |
|
|
A.I. OPERATING BENEFITS (B.1+B.2+B.3+B.4-A.1-A.2-A.3-A.4-A.5-A.6):
|
0,00 |
0,00 |
0,00 |
0,00 |
0,00 |
|
|
A.7.
Financial and similar charges: |
4.674.061,00 |
21.185.766,00 |
833.681,00 |
3.707.707,00 |
4.912.000,00 |
|
|
a) Due to liabilities with companies of the group: |
1.178.000,00 |
179.000,00 |
690.000,00 |
0,00 |
0,00 |
|
|
b) Due to liabilities with associated companies: |
0,00 |
0,00 |
0,00 |
0,00 |
0,00 |
|
|
c) Due to other debts.: |
2.908.000,00 |
4.130.000,00 |
4.540.000,00 |
3.940.000,00 |
3.746.000,00 |
|
|
d) Losses from financial investments: |
588.061,00 |
16.876.766,00 |
-4.396.319,00 |
-232.293,00 |
1.166.000,00 |
|
|
A.8.
Changes in financial investment provisions: |
0,00 |
0,00 |
0,00 |
0,00 |
0,00 |
|
|
A.9. Exchange losses: |
781.000,00 |
199.000,00 |
1.672.000,00 |
0,00 |
3.727.000,00 |
|
|
A.II. NET FINANCIAL INCOME (B.5+B.6+B.7+B.8-A.7-A.8-A.9):
|
0,00 |
0,00 |
8.460.319,00 |
2.221.293,00 |
8.959.000,00 |
|
|
A.III. PROFIT FROM ORDINARY
ACTIVITIES (A.I+A.II-B.I-B.II): |
0,00 |
0,00 |
0,00 |
0,00 |
0,00 |
|
|
A.10. Changes in provisions for
intangible, tangible and securities portfolio: |
-83.061,00 |
-2.383.766,00 |
2.913.319,00 |
-23.707,00 |
119.000,00 |
|
|
A.11. Losses from tangible and intangible
fixed assets and securities portfolio: |
0,00 |
0,00 |
0,00 |
1.037.000,00 |
5.000,00 |
|
|
A.12. Losses from transactions with own
shares and debentures: |
0,00 |
0,00 |
0,00 |
0,00 |
0,00 |
|
|
A.13. Extraordinary expenses: |
0,00 |
0,00 |
0,00 |
0,00 |
0,00 |
|
|
A.14. Expenses and losses of former
financial years: |
0,00 |
0,00 |
0,00 |
0,00 |
0,00 |
|
|
A.IV. EXTRAORDINARY PROFIT
(B.9+B.10+B.11+B.12+B.13-A.10-A.11-A.12-A.13-A.14): |
574.061,00 |
3.020.766,00 |
0,00 |
0,00 |
0,00 |
|
|
A.V. PROFIT BEFORE TAXES
(A.III+A.IV-B.III-B.IV): |
0,00 |
0,00 |
0,00 |
0,00 |
0,00 |
|
|
A.15. Corporation tax: |
0,00 |
-850.000,00 |
1.083.000,00 |
-6.001.000,00 |
-6.499.000,00 |
|
|
A.16. Miscellaneous taxes: |
0,00 |
0,00 |
0,00 |
0,00 |
0,00 |
|
|
A.VI. FINANCIAL YEAR RESULTS
(PROFIT) (A.V-A.15-A.16): |
0,00 |
0,00 |
0,00 |
0,00 |
0,00 |
|
MERCANTILE REGISTRY.
|
|
EQUIVALENCIA |
EQUIVALENCIA |
EQUIVALENCIA |
EQUIVALENCIA |
EQUIVALENCIA |
|
|
CREDIT |
2013 |
2012 |
2011 |
2010 |
2009 |
|
|
B) INCOME ( B.1 to B.13): |
191.515.000,00 |
199.495.000,00 |
203.391.000,00 |
192.159.000,00 |
149.200.000,00 |
|
|
B.1. Net total sales: |
180.212.000,00 |
176.719.000,00 |
182.469.000,00 |
170.780.000,00 |
127.939.000,00 |
|
|
a) Sales: |
186.595.432,00 |
183.261.221,00 |
191.036.708,00 |
181.538.275,00 |
118.367.184,00 |
|
|
b) Rendering of
services: |
8.123.000,00 |
7.705.000,00 |
6.284.000,00 |
3.355.000,00 |
18.774.000,00 |
|
|
Returns and Rappel on sales: |
-14.506.432,00 |
-14.247.221,00 |
-14.851.708,00 |
-14.113.275,00 |
-9.202.184,00 |
|
|
B.2. Stock
increase of manufactured goods and products in process: |
1.241.000,00 |
0,00 |
0,00 |
9.447.000,00 |
0,00 |
|
|
B.3. Works
performed by the company for fixed assets: |
3.078.000,00 |
3.064.000,00 |
3.583.000,00 |
5.344.000,00 |
3.602.000,00 |
|
|
B.4. Miscellaneous operating income:
|
6.381.000,00 |
4.781.000,00 |
5.071.000,00 |
29.000,00 |
45.000,00 |
|
|
a) Auxiliary income and other from current management: |
6.316.000,00 |
4.684.000,00 |
4.849.000,00 |
3.000,00 |
0,00 |
|
|
b) Grants: |
33.000,00 |
49.000,00 |
136.000,00 |
15.000,00 |
0,00 |
|
|
c) Liabilities and charges provisions surplus: |
32.000,00 |
48.000,00 |
86.000,00 |
11.000,00 |
45.000,00 |
|
|
B.I. PÉRDIDAS DE EXPLOTACIÓN
(A.1+A.2+A.3+A.4+A.5-A.6-B.1-B.2-B.3-B.4): |
5.233.000,00 |
17.209.000,00 |
25.161.000,00 |
33.391.000,00 |
28.375.000,00 |
|
|
B.5.
Income from equity investment: |
0,00 |
14.136.000,00 |
10.501.000,00 |
2.239.000,00 |
16.524.000,00 |
|
|
a) In companies of the group: |
0,00 |
14.136.000,00 |
10.501.000,00 |
2.239.000,00 |
16.524.000,00 |
|
|
b) In associated
companies: |
0,00 |
0,00 |
0,00 |
0,00 |
0,00 |
|
|
c) Third parties:
|
0,00 |
0,00 |
0,00 |
0,00 |
0,00 |
|
|
B.6. Income
from other marketable securities and long-term receivables: |
75.525,00 |
106.544,00 |
300.077,00 |
225.900,00 |
724.230,00 |
|
|
a) From companies of the group: |
0,00 |
0,00 |
0,00 |
0,00 |
0,00 |
|
|
b) From associated
companies: |
0,00 |
0,00 |
0,00 |
0,00 |
0,00 |
|
|
c) From companies out of the group: |
75.525,00 |
106.544,00 |
300.077,00 |
225.900,00 |
724.230,00 |
|
|
B.7. Miscellaneous
interests or similar income: |
36.475,00 |
51.456,00 |
164.923,00 |
109.100,00 |
349.770,00 |
|
|
a) From companies of the group: |
0,00 |
0,00 |
0,00 |
0,00 |
0,00 |
|
|
b) From associated companies:
|
0,00 |
0,00 |
0,00 |
0,00 |
0,00 |
|
|
c) Miscellaneous
interests: |
36.475,00 |
51.456,00 |
144.923,00 |
109.100,00 |
349.770,00 |
|
|
d) Profit on financial investment: |
0,00 |
0,00 |
20.000,00 |
0,00 |
0,00 |
|
|
B.8. Exchange positive differences: |
0,00 |
0,00 |
0,00 |
3.355.000,00 |
0,00 |
|
|
B.II. NEGATIVE FINANCIAL
RESULTS (A.7+A.8+A.9-B.5-B.6-B.7-B.8): |
5.343.061,00 |
7.090.766,00 |
0,00 |
0,00 |
0,00 |
|
|
B.III. LOSSES ON ORDINARY
ACTIVITIES ( B.I + B.II - A.I - A.II ): |
10.576.061,00 |
24.299.766,00 |
16.700.681,00 |
31.169.707,00 |
19.416.000,00 |
|
|
B.9.Profit
on disposal of both tangible and intangible fixed assets and securities
portfolio: |
12.000,00 |
148.000,00 |
650.000,00 |
0,00 |
0,00 |
|
|
B.10. Profit on transactions with own
shares and debentures: |
0,00 |
0,00 |
0,00 |
0,00 |
0,00 |
|
|
B.11. Capital grants transferred to profit
and loss: |
479.000,00 |
489.000,00 |
652.000,00 |
630.000,00 |
16.000,00 |
|
|
B.12. Extraordinary income: |
0,00 |
0,00 |
0,00 |
0,00 |
0,00 |
|
|
B.13. Income and profit of former
financial years: |
0,00 |
0,00 |
0,00 |
0,00 |
0,00 |
|
|
B.IV. NEGATIVE EXTRAORDINARY
RESULTS (A.10+A.11+A.12+A.13+A.14-B.9-B.10-B.11-B.12-B.13): |
0,00 |
0,00 |
1.611.319,00 |
383.293,00 |
108.000,00 |
|
|
B.V. LOSSES BEFORE TAXES
(B.III+B.IV-A.III-A.IV): |
10.002.000,00 |
21.279.000,00 |
18.312.000,00 |
31.553.000,00 |
19.524.000,00 |
|
|
B.VI. RESULT OF THE PERIOD
(LOSSES) (B.V+A.15+A.16): |
10.002.000,00 |
20.429.000,00 |
19.395.000,00 |
25.552.000,00 |
13.025.000,00 |
|
MERCANTILE REGISTRY.
CASHFLOW
STATEMENT
Model: Normal
> Source of information: Data contained in this section is taken from
the information declared in the Annual Accounts submitted to the Trade Register.
|
~'This company is not active, since it has been more
than 6 years without entering any registration in the Companies House~' |
2013 |
2012 |
2011 |
2010 |
2009 |
|
|
1. Fiscal year result before taxes.: 61100 |
12.322.000,00 |
-21.279.000,00 |
-18.312.000,00 |
-31.553.000,00 |
-19.524.000,00 |
|
|
2.
Results adjustments.: 61200 |
-7.517.000,00 |
13.873.000,00 |
3.080.000,00 |
8.091.000,00 |
1.864.000,00 |
|
|
a) Fixed Assets Amortization (+).: 61201 |
8.398.000,00 |
8.792.000,00 |
9.564.000,00 |
9.906.000,00 |
5.657.000,00 |
|
|
b) Obsolescence Allowances (+/-). : 61202 |
505.000,00 |
14.493.000,00 |
-1.426.000,00 |
-8.000,00 |
1.361.000,00 |
|
|
c) Variation in Provision (+/-). : 61203 |
310.000,00 |
-48.000,00 |
86.000,00 |
0,00 |
0,00 |
|
|
d) Allocation of grants (-).: 61204 |
-479.000,00 |
-489.000,00 |
-652.000,00 |
-441.000,00 |
-16.000,00 |
|
|
e) Results on disposal of fixed
assets (+/-). : 61205 |
-12.000,00 |
-148.000,00 |
-650.000,00 |
1.037.000,00 |
124.000,00 |
|
|
g) Financial income (-).: 61207 |
-22.436.000,00 |
-14.269.000,00 |
-10.750.000,00 |
-2.574.000,00 |
-14.448.000,00 |
|
|
h) Financial Expenses (+). : 61208 |
4.086.000,00 |
4.309.000,00 |
5.236.000,00 |
3.940.000,00 |
3.746.000,00 |
|
|
i) Exchange differences (+/-). : 61209 |
781.000,00 |
199.000,00 |
1.672.000,00 |
-3.355.000,00 |
3.727.000,00 |
|
|
k) Other income and expense
(-/+). : 61211 |
1.330.000,00 |
1.034.000,00 |
0,00 |
-414.000,00 |
1.713.000,00 |
|
|
3. Changes in current capital equity.: 61300 |
-7.141.000,00 |
6.950.000,00 |
11.584.000,00 |
23.902.000,00 |
30.371.000,00 |
|
|
a) Stock (+/-).: 61301 |
-2.049.000,00 |
1.926.000,00 |
5.731.000,00 |
-1.258.000,00 |
8.297.000,00 |
|
|
d) Debtors and other accounts
receivable (+/-). : 61302 |
-7.895.000,00 |
10.628.000,00 |
5.759.000,00 |
21.699.000,00 |
33.268.000,00 |
|
|
c) Other current assets (+/-). : 61303 |
-111.000,00 |
133.000,00 |
-386.000,00 |
1.458.000,00 |
-1.155.000,00 |
|
|
d) Creditors and other accounts
payable (+/-). : 61304 |
4.053.000,00 |
-5.243.000,00 |
1.589.000,00 |
2.003.000,00 |
-4.695.000,00 |
|
|
f) Other non-current assets and
liabilities (+/-).: 61306 |
-1.139.000,00 |
-494.000,00 |
-1.109.000,00 |
0,00 |
-5.344.000,00 |
|
|
4. Other cash flows for operating activities.:
61400 |
13.379.000,00 |
9.242.000,00 |
5.884.000,00 |
152.000,00 |
9.645.000,00 |
|
|
a) Interest payments (-). : 61401 |
-3.998.000,00 |
-3.830.000,00 |
-4.509.000,00 |
-3.940.000,00 |
-3.746.000,00 |
|
|
b) Dividend payment collection (+). : 61402 |
19.404.000,00 |
12.914.000,00 |
9.282.000,00 |
1.399.000,00 |
13.374.000,00 |
|
|
c) Interest collection (+). : 61403 |
112.000,00 |
158.000,00 |
1.111.000,00 |
1.175.000,00 |
1.074.000,00 |
|
|
d) Income tax payment
collection (payments) (+/-).: 61404 |
-2.139.000,00 |
0,00 |
0,00 |
1.518.000,00 |
-1.057.000,00 |
|
|
5.
Operating activity cash flows (1 + 2 + 3 + 4) : 61500 |
11.043.000,00 |
8.786.000,00 |
2.236.000,00 |
592.000,00 |
22.356.000,00 |
|
|
6.
Payments for investment (-).: 62100 |
-9.255.000,00 |
-17.904.000,00 |
-13.244.000,00 |
-15.396.000,00 |
-24.051.000,00 |
|
|
a) Companies of the group and affiliates.
: 62101 |
-3.192.000,00 |
-11.939.000,00 |
0,00 |
0,00 |
0,00 |
|
|
b) Intangible fixed assets. : 62102 |
-4.547.000,00 |
-4.463.000,00 |
-5.346.000,00 |
-6.556.000,00 |
-2.954.000,00 |
|
|
c) Fixed assets. : 62103 |
-1.516.000,00 |
-1.502.000,00 |
-2.248.000,00 |
-4.594.000,00 |
-3.690.000,00 |
|
|
e) Other financial assets. : 62105 |
0,00 |
0,00 |
-5.650.000,00 |
-4.246.000,00 |
-17.407.000,00 |
|
|
7.
Divestment payment collection (+). : 62200 |
503.000,00 |
676.000,00 |
19.321.000,00 |
17.388.000,00 |
17.772.000,00 |
|
|
c) Fixed assets. : 62203 |
371.000,00 |
575.000,00 |
1.752.000,00 |
1.907.000,00 |
1.369.000,00 |
|
|
e) Other financial assets. : 62205 |
0,00 |
0,00 |
13.430.000,00 |
4.302.000,00 |
0,00 |
|
|
g) Business Unit : 62207 |
0,00 |
0,00 |
0,00 |
2.209.000,00 |
0,00 |
|
|
h) Other assets. : 62208 |
132.000,00 |
101.000,00 |
4.139.000,00 |
8.970.000,00 |
16.403.000,00 |
|
|
8. Investment activity cash flows (6 + 7) minus
Amortization: 62300 |
-8.752.000,00 |
-17.228.000,00 |
6.077.000,00 |
1.992.000,00 |
-6.279.000,00 |
|
|
9. Payment collection and payments for equity
instruments. : 63100 |
0,00 |
10.000,00 |
5.000,00 |
4.765.000,00 |
-16.000,00 |
|
|
a) Issuance of equity
instruments (+). : 63101 |
0,00 |
0,00 |
0,00 |
40.114.000,00 |
0,00 |
|
|
c) Acquisition of own equity
instruments (-). : 63103 |
0,00 |
0,00 |
0,00 |
-38.784.000,00 |
-16.000,00 |
|
|
d) Disposal of own equity
instruments (+). : 63104 |
0,00 |
0,00 |
0,00 |
223.000,00 |
0,00 |
|
|
e) Grants, donations and
bequests received (+). : 63105 |
0,00 |
10.000,00 |
5.000,00 |
3.212.000,00 |
0,00 |
|
|
10. Payment collection and payments for financial
liabilities instruments.: 63200 |
-741.000,00 |
46.000,00 |
-12.154.000,00 |
-7.902.000,00 |
-22.749.000,00 |
|
|
a) Issuance : 63201 |
22.006.000,00 |
63.181.000,00 |
17.645.000,00 |
84.487.000,00 |
0,00 |
|
|
2. Debts incurred with credit
institutions (+). : 63203 |
1.227.000,00 |
48.510.000,00 |
17.645.000,00 |
84.487.000,00 |
0,00 |
|
|
3. Debts incurred with companies
of the group and affiliates (+).: 63204 |
20.779.000,00 |
14.671.000,00 |
0,00 |
0,00 |
0,00 |
|
|
b) Repayment and amortization
of : 63207 |
-22.747.000,00 |
-63.135.000,00 |
-29.799.000,00 |
-92.389.000,00 |
-22.749.000,00 |
|
|
2. Debts incurred with credit
institutions (-).: 63209 |
-16.320.000,00 |
-62.429.000,00 |
-29.593.000,00 |
-92.389.000,00 |
-22.749.000,00 |
|
|
3. Debts incurred with
companies of the group and affiliates (-). : 63210 |
-6.427.000,00 |
-706.000,00 |
-206.000,00 |
0,00 |
0,00 |
|
|
11. Payments from dividends and remunerations from
other assets instruments. : 63300 |
0,00 |
0,00 |
0,00 |
0,00 |
-18.070.000,00 |
|
|
a) Dividends (-).: 63301 |
0,00 |
0,00 |
0,00 |
0,00 |
-18.070.000,00 |
|
|
12. Cash flows for financing activities (9+10+11).:
63400 |
-741.000,00 |
56.000,00 |
-12.149.000,00 |
-3.137.000,00 |
-40.835.000,00 |
|
|
D) EFFECT OF EXCHANGE RATE CHANGES: 64000 |
-781.000,00 |
-199.000,00 |
-1.672.000,00 |
2.742.000,00 |
-3.727.000,00 |
|
|
E) NET INCREASE/DECREASE OF CASH OR EQUIVALENT
ASSETS (+/-5+/-8+/12+/-D) : 65000 |
769.000,00 |
-8.585.000,00 |
-5.508.000,00 |
2.189.000,00 |
-28.485.000,00 |
|
|
Cash or equivalent assets as of
beginning of the fiscal year.: 65100 |
4.197.000,00 |
12.782.000,00 |
18.290.000,00 |
16.101.000,00 |
44.586.000,00 |
|
|
Cash or equivalent assets as of
end of the fiscal year.: 65200 |
4.966.000,00 |
4.197.000,00 |
12.782.000,00 |
18.290.000,00 |
16.101.000,00 |
|
FINANCIAL
DIAGNOSIS
>
Economic-Financial Comparative Analysis
Data used in the following ratios and indicators is taken from the
Annual Accounts submitted by the company to the TRADE REGISTER.
> Comparison
within the Sector
|
Cash
Flow |
2013 |
2012 |
Variación
2013 - 2012 |
|
|||
|
|
Empresa |
Sector |
Empresa |
Sector |
Empresa |
Sector |
|
|
Cash
Flow over Sales: |
0,00
% |
-0,09
% |
-0,05
% |
0,01
% |
107,82
% |
-1.294,48
% |
|
|
EBITDA
over Sales: |
12,57
% |
10,42
% |
-4,79
% |
9,24
% |
362,40
% |
12,75
% |
|
|
Cash
Flow Yield: |
0,00
% |
-0,04
% |
-0,02
% |
0,00
% |
108,56
% |
|
|
|
Profitability |
2013 |
2012 |
Variación
2013 - 2012 |
|
|||
|
|
Empresa |
Sector |
Empresa |
Sector |
Empresa |
Sector |
|
|
Operating
economic profitability: |
7,70
% |
6,43
% |
-11,67
% |
5,24
% |
165,97
% |
22,68
% |
|
|
Total
economic profitability: |
4,43
% |
3,49
% |
-4,79
% |
2,51
% |
192,40
% |
38,84
% |
|
|
Financial
profitability: |
5,10
% |
4,31
% |
-8,90
% |
1,36
% |
157,24
% |
216,08
% |
|
|
Margin:
|
8,29
% |
5,86
% |
-13,75
% |
4,85
% |
160,32
% |
20,79
% |
|
|
Mark-up:
|
5,81
% |
3,88
% |
-11,53
% |
1,63
% |
150,41
% |
137,92
% |
|
|
Solvency |
2013 |
2012 |
Variación
2013 - 2012 |
|
|||
|
|
Empresa |
Sector |
Empresa |
Sector |
Empresa |
Sector |
|
|
Liquidity:
|
0,06 |
0,14 |
0,04 |
0,12 |
50,84 |
22,30 |
|
|
Acid
Test: |
0,69 |
0,86 |
0,46 |
0,85 |
48,46 |
0,86 |
|
|
Working
Capital / Investment: |
0,00 |
0,02 |
-0,09 |
0,03 |
101,96 |
-19,85 |
|
|
Solvency:
|
1,43 |
1,17 |
1,01 |
1,17 |
40,85 |
-0,42 |
|
|
Indebtedness |
2013 |
2012 |
Variación
2013 - 2012 |
|
|||
|
|
Empresa |
Sector |
Empresa |
Sector |
Empresa |
Sector |
|
|
Indebtedness
level: |
0,50 |
1,51 |
0,51 |
1,64 |
-1,97 |
-7,64 |
|
|
Borrowing
Composition: |
0,46 |
1,04 |
0,11 |
1,03 |
309,93 |
0,61 |
|
|
Repayment
Ability: |
160,68 |
-13,45 |
-13,95 |
165,21 |
1.251,81 |
-108,14 |
|
|
Warranty:
|
3,00 |
1,67 |
2,96 |
1,62 |
1,42 |
3,19 |
|
|
Generated
resources / Total creditors: |
0,17 |
0,08 |
-0,05 |
0,07 |
446,10 |
18,30 |
|
|
Efficiency |
2013 |
2012 |
Variación
2013 - 2012 |
|
|||
|
|
Empresa |
Sector |
Empresa |
Sector |
Empresa |
Sector |
|
|
Productivity:
|
1,48 |
1,84 |
0,84 |
1,73 |
75,97 |
6,46 |
|
|
Turnover
of Collection Rights : |
3,98 |
5,06 |
4,24 |
4,82 |
-6,00 |
5,13 |
|
|
Turnover
of Payment Entitlements: |
3,14 |
3,61 |
3,59 |
3,52 |
-12,43 |
2,49 |
|
|
Stock
rotation: |
7,31 |
7,66 |
8,20 |
6,59 |
-10,83 |
16,31 |
|
|
Assets
turnover: |
0,93 |
1,10 |
0,85 |
1,08 |
9,36 |
1,56 |
|
|
Borrowing
Cost: |
3,31 |
2,84 |
3,60 |
2,95 |
-8,09 |
-3,51 |
|
> Trend of indicators
under the General Accounting Plan of 2007 (2013, 2012, 2011, 2010, 2009)
|
Cash
Flow |
2013 |
2012 |
2011 |
2010 |
2009 |
|
|
Cash
Flow over Sales: |
0,00
% |
-0,05
% |
-0,03
% |
0,01
% |
-0,22
% |
|
|
EBITDA
over Sales: |
12,57
% |
-4,79
% |
-8,59
% |
-13,76
% |
-17,79
% |
|
|
Cash
Flow Yield: |
0,00
% |
-0,02
% |
-0,01
% |
0,01
% |
-0,07
% |
|
|
Profitability |
2013 |
2012 |
2011 |
2010 |
2009 |
|
|
Operating
economic profitability: |
7,70
% |
-11,67
% |
-10,76
% |
-12,16
% |
-17,29
% |
|
|
Total
economic profitability: |
4,43
% |
-4,79
% |
-3,42
% |
-6,67
% |
-3,93
% |
|
|
Financial
profitability: |
5,10
% |
-8,90
% |
-7,76
% |
-9,49
% |
-4,61
% |
|
|
Margin:
|
8,29
% |
-13,75
% |
-14,25
% |
-19,19
% |
-21,65
% |
|
|
Mark-up:
|
5,81
% |
-11,53
% |
-9,59
% |
-17,91
% |
-14,84
% |
|
|
Solvency |
2013 |
2012 |
2011 |
2010 |
2009 |
|
|
Liquidity:
|
0,06 |
0,04 |
0,11 |
0,15 |
0,19 |
|
|
Acid
Test: |
0,69 |
0,46 |
0,60 |
0,68 |
1,26 |
|
|
Working
Capital / Investment: |
0,00 |
-0,09 |
-0,05 |
-0,02 |
0,10 |
|
|
Solvency:
|
1,43 |
1,01 |
1,15 |
1,24 |
1,78 |
|
|
Indebtedness |
2013 |
2012 |
2011 |
2010 |
2009 |
|
|
Indebtedness
level: |
0,50 |
0,51 |
0,49 |
0,50 |
0,42 |
|
|
Borrowing
Composition: |
0,46 |
0,11 |
0,11 |
0,12 |
0,42 |
|
|
Repayment
Ability: |
160,68 |
-13,95 |
-22,98 |
63,44 |
-4,17 |
|
|
Warranty:
|
3,00 |
2,96 |
3,02 |
2,98 |
3,37 |
|
|
Generated
resources / Total creditors: |
0,17 |
-0,05 |
-0,12 |
-0,11 |
-0,05 |
|
|
Efficiency |
2013 |
2012 |
2011 |
2010 |
2009 |
|
|
Productivity:
|
1,48 |
0,84 |
0,73 |
0,58 |
0,40 |
|
|
Turnover
of Collection Rights : |
3,98 |
4,24 |
3,48 |
2,88 |
1,73 |
|
|
Turnover
of Payment Entitlements: |
3,14 |
3,59 |
3,38 |
3,89 |
3,76 |
|
|
Stock
rotation: |
7,31 |
8,20 |
8,15 |
6,49 |
8,52 |
|
|
Assets
turnover: |
0,93 |
0,85 |
0,76 |
0,63 |
0,80 |
|
|
Borrowing
Cost: |
3,31 |
3,60 |
4,13 |
2,84 |
3,15 |
|
COMPARATIVE
SECTORIAL BALANCE
Sector-based
Comparison under the rules of the New General Accounting Plan.
|
~'This company is not active, since it has been more
than 6 years without entering any registration in the Companies House~' |
Variación
- |
|
|
|
Empresa |
Sector |
|
~'This company is not active, since it has been more
than 6 years without entering any registration in the Companies House~' |
Variación
- |
|
|
|
Empresa |
Sector |
|
~'This company is not active, since it has been more
than 6 years without entering any registration in the Companies House~' |
Variación
- |
|
|
|
Empresa |
Sector |
News
|
Alimarket |
17/10/2014 |
|
Mecalux crece ligeramente gracias al
continente americano |
|
|
Companies related |
|
|
|
|
|
Expansión.com |
24/09/2014 |
|
Mecalux crece en Cornellà con una
nave de 6.800 metros cuadrados |
|
|
Companies related |
|
|
|
|
Public
Tenders and Works Won
|
|
|
Organisation
that calls the tender: |
|
CENTRO
INTERMODAL DE LOGISTICA SA CILSA |
|
Objective of Tender: |
|
CONTRATACION
DE LOS TRABAJOS DE SUMINISTRO, INSTALACION Y MONTAJE DE ESTANTERIAS PARA ALMACENAMIENTO
DE PALETS EN LA NAVE A 8 3 2 DE LA ZONA DE ACTIVIDADES LOGISTICAS DEL PORT DE
BARCELONA |
|
Date Awarded: |
|
25/04/2014 |
|
Cost: |
|
134.743,18
EURO. |
|
|
|
Organisation
that calls the tender: |
|
AYUNTAMIENTO
DE ARANDA DE DUERO |
|
Objective of Tender: |
|
SUMINISTRO
E INSTALACION DE ESTANTERIAS PARA LA NAVE SITA EN LA CALLE TOLEDO DE ARANDA
DE DUERO |
|
Date Awarded: |
|
18/04/2013 |
|
Cost: |
|
19.808,91
EURO. |
|
|
|
Organisation
that calls the tender: |
|
SERVICIO
CATALAN DE LA SALUD |
|
Objective of Tender: |
|
EQUIPAMIENTO
DE MOBILIARIO Y MATERIAL DIVERSO PARA EL NUEVO HOSPITAL DE LA CERDANYA, EN
PUIGCERDA C COODIGO CPV 331920000 |
|
Date Awarded: |
|
30/10/2012 |
|
Cost: |
|
17.096,09
EURO. |
|
|
|
Organisation
that calls the tender: |
|
SERVICIO
CATALAN DE LA SALUD |
|
Objective of Tender: |
|
EQUIPAMIENTO
DE MOBILIARIO I MATERIAL DIVERSO PARA HOSPITALES, CENTROS DE ATENCION
PRIMARIA Y OTROS CENTROS ASISTENCIALES DEPENDIENTES DEL CATSALUT C COODIGO
CPV 331920000 |
|
Date Awarded: |
|
15/05/2012 |
|
Cost: |
|
23.459,58
EURO. |
|
|
|
Organisation
that calls the tender: |
|
MUTUA
UNIVERSAL MUGENAT MUTUA DE ACCIDENTES DE TRABAJO Y ENFERMEDADES PROFESIONALES
DE LA SEGURIDAD SOCIAL N 10 |
|
Objective of Tender: |
|
SUMINISTRO
E INSTALACION DE LOS SISTEMAS DE ALMACENAJE EN EL NUEVO ARCHIVO DE MUTUA
UNIVERSAL |
|
Date Awarded: |
|
16/01/2012 |
|
Cost: |
|
521.229,60
EURO. |
|
|
|
Organisation
that calls the tender: |
|
SERVICIO
CATALAN DE LA SALUD |
|
Objective of Tender: |
|
EQUIPAMIENTO,
A CARGO DEL ACUERDO MARCO DE EQUIPAMIENTO DE MOBILIARIO DE OFICINA CON
DESTINACION A LOS DEPARTAMENTOS DE LA GENERALITAT DE CATALUNYA Y ENTIDADES
ADHERIDAS, APROBADO POR LA COMISION CENTRAL DE SUMINISTROS DE LA GENERALITAT
DE CATALUNYA EXP 2008 6 , DE MOBILIARIO Y MATERIAL DIVERSO PARA HOSPITALES,
CENTROS DE ATENCION PRIMARIA, CONSULTORIOS LOCALES Y OTROS CENTROS
ASISTENCIALES DEPENDIENTES DEL CATSALUT |
|
Date Awarded: |
|
19/08/2011 |
|
Cost: |
|
37.408,00
EURO. |
|
Organisation
that calls the tender: |
|
DEPARTAMENTO
DE JUSTICIA DE LA COMUNIDAD AUTONOMA DE CATALUÑA |
|
Objective of Tender: |
|
SUMINISTRO
Y MONTAJE DE ESTANTERIAS EN EL CENTRO PENITENCIARIO PUIG DE LES BASSES |
|
Date Awarded: |
|
17/12/2010 |
|
Cost: |
|
Importe
compartido entre distintos Contratistas |
|
Organisation
that calls the tender: |
|
DEPARTAMENTO
DE INTERIOR RELACIONES INSTITUCIONALES Y PARTICIPACION DE LA COMUNIDAD
AUTONOMA DE CATALUÑA |
|
Objective of Tender: |
|
SUMINISTRO
DE MOBILIARIO PARA EQUIPAR LOS PARQUES DE BOMBEROS DE GAVA, SANT ANTONI DE
VILAMAJOR, MOLLERUSSA Y CERDANYOLA DEL VALLES, DIVIDIDO EN 4 LOTES |
|
Date Awarded: |
|
11/03/2010 |
|
Cost: |
|
Lote
4: Importe neto 2.342 euros. IVA (16%) 374,72 euros. Importe total 2.716,72
euros |
|
Organisation
that calls the tender: |
|
AYUNTAMIENTO
DE REUS |
|
Objective of Tender: |
|
SUBMINISTRAMENT
DE COMPACTES MOBILS PER AL NOU ARXIU COMARCAL DEL BAIX CAMP |
|
Date Awarded: |
|
13/10/2009 |
|
Cost: |
|
194.880,00
EURO. |
|
Organisation
that calls the tender: |
|
UNIVERSIDAD
DE LLEIDA |
|
Objective of Tender: |
|
Suministro
y montaje de estanterías metálicas para el equipamiento GEPA. |
|
Date Awarded: |
|
06/06/2008 |
|
Cost: |
|
290.000,00
EURO. |
|
Organisation
that calls the tender: |
|
DEPARTAMENTO
DE INTERIOR RELACIONES INSTITUCIONALES Y PARTICIPACION DE LA COMUNIDAD
AUTONOMA DE CATALUÑA |
|
Objective of Tender: |
|
SUMINISTRO
DE DIVERSO MOBILIARIO PARA LAS SEDES DE LOS SERVICIOS TERRITORIALES DEL
DEPARTAMENTO A LA CATALUÑA CENTRAL, AL ALTO PIRINEO Y ARAN, A LAS TIERRAS DEL
EBRO, A LERIDA Y A TARRAGONA, DIVIDIDO EN 13 LOTES |
|
Date Awarded: |
|
31/03/2008 |
|
Cost: |
|
Lote
13: 4.092,00 IVA incluido. |
|
Organisation
that calls the tender: |
|
DEPARTAMENTO
DE EDUCACION CULTURA Y DEPORTE DE LA COMUNIDAD AUTONOMA DE ARAGON |
|
Objective of Tender: |
|
suministro
e instalación de estanterías para el Museo de Huesca |
|
Date Awarded: |
|
05/10/2007 |
|
Cost: |
|
61.500,00
EURO. |
|
Organisation
that calls the tender: |
|
COORDINACIO
LOGISTICA SANITARIA AIE |
|
Objective of Tender: |
|
subministrament
de prestatgeries amb destí al magatzem de l Agrupació d Interès Econòmic
Coordinació Logística Sanitària |
|
Date Awarded: |
|
08/06/2006 |
|
Cost: |
|
200.000,00
EURO. |
|
Organisation
that calls the tender: |
|
INSTITUTO
CATALAN DE LA SALUD ICS |
|
Objective of Tender: |
|
SUMINISTRO
DE MOBILIARIO PARA EL HOSPITAL UNIVERSITARIO ARNAU DE VILANOVA DE LLEIDA |
|
Date Awarded: |
|
26/11/2002 |
|
Cost: |
|
6.915,92
EURO. |
|
Organisation
that calls the tender: |
|
AYUNTAMIENTO
DE BARBASTRO |
|
Objective of Tender: |
|
ADQUISICION
DE ESTANTERIAS PARA LAS NAVES DE SERVICIOS |
|
Date Awarded: |
|
17/07/2002 |
|
Cost: |
|
20.451,00
EURO. |
Detail of Subsidies appearing in Balances
Memories
|
Entity |
ORGANISMO
NO ESPECIFICADO |
|
Status |
CONCEDIDA |
|
Amount
Granted |
1.055.000,00 |
|
Notes |
importe
corresponde al traspasado a resultados |
|
Entity |
INSTITUTO
DE DESARROLLO ECONOMICO DEL PRINCIPADO DE ASTURIAS |
|
Status |
CONCEDIDA |
|
Amount
Granted |
218.000,00 |
|
Notes |
importe
corresponde al traspasado a resultados |
|
Entity |
ORGANISMO
NO ESPECIFICADO |
|
Status |
CONCEDIDA |
|
Amount
Granted |
106.000,00 |
|
Notes |
importe
corresponde al traspasado a resultados |
|
Entity |
MINISTERIO
DE INDUSTRIA Y ENERGIA |
|
Status |
CONCEDIDA |
|
Amount
Granted |
54.000,00 |
|
Notes |
importe
corresponde al traspasado a resultados |
|
Entity |
INSTITUTO
DE DESARROLLO ECONOMICO DEL PRINCIPADO DE ASTURIAS (IDEPA) |
|
Status |
CONCEDIDA |
|
Amount
Granted |
2.571.000,00 |
|
Notes |
El
importe es el saldo a fines del ejercicio 2010. |
|
Entity |
INSTITUTO
DE DESARROLLO ECONOMICO DEL PRINCIPADO DE ASTURIAS (IDEPA) |
|
Status |
CONCEDIDA |
|
Amount
Granted |
2.414.000,00 |
|
Notes |
El
importe reflejado corresponde al saldo pendiente de imputación al cierre del
ejercicio. |
|
Entity |
ORGANISMO
NO ESPECIFICADO |
|
Status |
CONCEDIDA |
|
Amount
Granted |
1.197.000,00 |
|
Notes |
El
importe es el saldo a fines del ejercicio 2010. |
|
Entity |
MINISTERIO
DE INDUSTRIA Y ENERGIA (MINER) |
|
Status |
CONCEDIDA |
|
Amount
Granted |
635.000,00 |
|
Notes |
El
importe es el saldo a fines del ejercicio 2010. |
|
Entity |
MINISTERIO
DE INDUSTRIA Y ENERGIA (MINER) |
|
Status |
CONCEDIDA |
|
Amount
Granted |
597.000,00 |
|
Notes |
El
importe reflejado corresponde al saldo pendiente de imputación al cierre del
ejercicio. |
|
Entity |
MINISTERIO
DE INDUSTRIA Y ENERGIA (MINER) |
|
Status |
CONCEDIDA |
|
Amount
Granted |
289.000,00 |
|
Notes |
El
importe es el saldo a fines del ejercicio 2010. |
|
Entity |
MINISTERIO
DE INDUSTRIA Y ENERGIA (MINER) |
|
Status |
CONCEDIDA |
|
Amount
Granted |
270.000,00 |
|
Notes |
El
importe reflejado corresponde al saldo pendiente de imputación al cierre del
ejercicio. |
|
Entity |
MINISTERIO
DE ECONOMIA Y HACIENDA |
|
Status |
CONCEDIDA |
|
Amount
Granted |
216.000,00 |
|
Notes |
El
importe es el saldo a fines del ejercicio 2010. |
|
Entity |
MINISTERIO
DE ECONOMIA Y HACIENDA |
|
Status |
CONCEDIDA |
|
Amount
Granted |
208.000,00 |
|
Notes |
El
importe reflejado corresponde al saldo pendiente de imputación al cierre del ejercicio. |
|
Entity |
ORGANISMO
NO ESPECIFICADO |
|
Status |
CONCEDIDA |
|
Amount
Granted |
200.000,00 |
|
Notes |
El
importe es el saldo a fines del ejercicio 2010. |
|
Entity |
ORGANISMO
NO ESPECIFICADO |
|
Status |
CONCEDIDA |
|
Amount
Granted |
191.000,00 |
|
Notes |
El
importe reflejado corresponde al saldo pendiente de imputación al cierre del
ejercicio. |
|
Entity |
L.I.R |
|
Status |
CONCEDIDA |
|
Amount
Granted |
189.000,00 |
|
Notes |
El
importe es el saldo a fines del ejercicio 2010. |
|
Entity |
MINISTERIO
DE INDUSTRIA Y ENERGIA (MINER) |
|
Status |
CONCEDIDA |
|
Amount
Granted |
177.000,00 |
|
Notes |
El
importe es el saldo a fines del ejercicio 2010. |
|
Entity |
L.I.R |
|
Status |
CONCEDIDA |
|
Amount
Granted |
176.000,00 |
|
Notes |
El
importe reflejado corresponde al saldo pendiente de imputación al cierre del
ejercicio. |
|
Entity |
MINISTERIO
DE INDUSTRIA Y ENERGIA (MINER) |
|
Status |
CONCEDIDA |
|
Amount
Granted |
171.000,00 |
|
Notes |
El
importe reflejado corresponde al saldo pendiente de imputación al cierre del
ejercicio. |
|
Entity |
MINISTERIO
DE INDUSTRIA Y ENERGIA (MINER) |
|
Status |
CONCEDIDA |
|
Amount
Granted |
166.000,00 |
|
Notes |
El
importe es el saldo a fines del ejercicio 2010. |
|
Entity |
MINISTERIO
DE INDUSTRIA Y ENERGIA (MINER) |
|
Status |
CONCEDIDA |
|
Amount
Granted |
158.000,00 |
|
Notes |
El
importe reflejado corresponde al saldo pendiente de imputación al cierre del
ejercicio. |
|
Entity |
ORGANISMO
NO ESPECIFICADO |
|
Status |
CONCEDIDA |
|
Amount
Granted |
149.000,00 |
|
Notes |
El
importe es el saldo a fines del ejercicio 2010. |
|
Entity |
ORGANISMO
NO ESPECIFICADO |
|
Status |
CONCEDIDA |
|
Amount
Granted |
143.000,00 |
|
Notes |
El
importe reflejado corresponde al saldo pendiente de imputación al cierre del
ejercicio. |
|
Entity |
AGENCIA
DE DESARROLLO ECONOMICO |
|
Status |
CONCEDIDA |
|
Amount
Granted |
135.000,00 |
|
Notes |
El
importe es el saldo a fines del ejercicio 2010. |
|
Entity |
AGENCIA
DE DESARROLLO ECONOMICO |
|
Status |
CONCEDIDA |
|
Amount
Granted |
109.000,00 |
|
Notes |
El
importe reflejado corresponde al saldo pendiente de imputación al cierre del
ejercicio. |
|
Entity |
INSTITUTO
DE FOMENTO REGIONAL (IFR) |
|
Status |
CONCEDIDA |
|
Amount
Granted |
75.000,00 |
|
Notes |
El
importe es el saldo a fines del ejercicio 2010. |
|
Entity |
MINISTERIO
DE INDUSTRIA Y ENERGIA (MINER) |
|
Status |
CONCEDIDA |
|
Amount
Granted |
73.000,00 |
|
Notes |
El
importe reflejado corresponde al saldo imputado a resultados en este ejercicio. |
|
Entity |
INSTITUTO
DE FOMENTO REGIONAL (IFR) |
|
Status |
CONCEDIDA |
|
Amount
Granted |
72.000,00 |
|
Notes |
El
importe reflejado corresponde al saldo pendiente de imputación al cierre del
ejercicio. |
|
Entity |
ORGANISMO
NO ESPECIFICADO |
|
Status |
CONCEDIDA |
|
Amount
Granted |
59.000,00 |
|
Notes |
El
importe es el saldo a fines del ejercicio 2010. |
|
Entity |
ORGANISMO
NO ESPECIFICADO |
|
Status |
CONCEDIDA |
|
Amount
Granted |
58.000,00 |
|
Notes |
El
importe es el saldo a fines del ejercicio 2010. |
|
Entity |
MINISTERIO
DE INDUSTRIA Y ENERGIA (MINER) |
|
Status |
CONCEDIDA |
|
Amount
Granted |
51.000,00 |
|
Notes |
El
importe es el saldo a fines del ejercicio 2010. |
|
Entity |
ORGANISMO
NO ESPECIFICADO |
|
Status |
CONCEDIDA |
|
Amount
Granted |
51.000,00 |
|
Notes |
El
importe reflejado corresponde al saldo pendiente de imputación al cierre del
ejercicio. |
|
Entity |
ORGANISMO
NO ESPECIFICADO |
|
Status |
CONCEDIDA |
|
Amount
Granted |
50.000,00 |
|
Notes |
El
importe es el saldo a fines del ejercicio 2010. |
|
Entity |
ORGANISMO
NO ESPECIFICADO |
|
Status |
CONCEDIDA |
|
Amount
Granted |
48.000,00 |
|
Notes |
El
importe reflejado corresponde al saldo pendiente de imputación al cierre del
ejercicio. |
|
Entity |
MINISTERIO
DE INDUSTRIA Y ENERGIA (MINER) |
|
Status |
CONCEDIDA |
|
Amount
Granted |
46.000,00 |
|
Notes |
El
importe es el saldo a fines del ejercicio 2010. |
|
Entity |
MINISTERIO
DE INDUSTRIA Y ENERGIA (MINER) |
|
Status |
CONCEDIDA |
|
Amount
Granted |
44.000,00 |
|
Notes |
El
importe reflejado corresponde al saldo pendiente de imputación al cierre del ejercicio. |
|
Entity |
ORGANISMO
NO ESPECIFICADO |
|
Status |
CONCEDIDA |
|
Amount
Granted |
44.000,00 |
|
Notes |
El
importe reflejado corresponde al saldo pendiente de imputación al cierre del
ejercicio. |
|
Entity |
INSTITUTO
DE CREDITO OFICIAL (ICO) |
|
Status |
CONCEDIDA |
|
Amount
Granted |
31.000,00 |
|
Notes |
El
importe es el saldo a fines del ejercicio 2010. |
|
Entity |
INSTITUTO
DE CREDITO OFICIAL (ICO) |
|
Status |
CONCEDIDA |
|
Amount
Granted |
21.000,00 |
|
Notes |
El
importe reflejado corresponde al saldo pendiente de imputación al cierre del
ejercicio. |
|
Entity |
ORGANISMO
NO ESPECIFICADO |
|
Status |
CONCEDIDA |
|
Amount
Granted |
5.000,00 |
|
Notes |
El
importe es el saldo a fines del ejercicio 2010. |
|
Entity |
ORGANISMO
NO ESPECIFICADO |
|
Status |
CONCEDIDA |
|
Amount
Granted |
4.000,00 |
|
Notes |
El
importe reflejado corresponde al saldo pendiente de imputación al cierre del
ejercicio. |
|
Entity |
ORGANISMO
NO ESPECIFICADO |
|
Status |
CONCEDIDA |
|
Amount
Granted |
4.000,00 |
|
Notes |
El
importe reflejado corresponde al saldo pendiente de imputación al cierre del
ejercicio. |
|
Entity |
CONSORCIO
DE PROMOCION COMERCIAL DE CATALUÑA (COPCA) |
|
Status |
CONCEDIDA |
|
Amount
Granted |
1.000,00 |
|
Notes |
El
importe es el saldo a fines del ejercicio 2010. |
|
Entity |
CONSORCIO
DE PROMOCION COMERCIAL DE CATALUÑA (COPCA) |
|
Status |
CONCEDIDA |
|
Amount
Granted |
1.000,00 |
|
Notes |
El
importe reflejado corresponde al saldo imputado a resultados en este
ejercicio. |
|
Entity |
ORGANISMO
NO ESPECIFICADO |
|
Status |
CONCEDIDA |
|
Amount
Granted |
77.000,00 |
|
Notes |
Subvenciones
oficiales destinadas a proyectos medioambientales. |
Research
Summary
|
The company was established in
1.985, although it continues invidual business started in 1.966 by Mr. José
Luis Carrillo. Engaged in the manufacturing and marketing of integrated storage.
It operates both nationally and internationally. It is one of the most
important companies in the sector worldwide. There is no evidence of any
incidents. In the light of the foregoing, we consider the company apt to be
related to risk operations in accordance with its size, although and due to
its high debt, we recommend to track closely its business evolution. |
Sources
|
Registry of Commerce's Official Gazette. Own and
external data bases Company References |
FOREIGN EXCHANGE RATES
|
Currency |
Unit
|
Indian Rupees |
|
US Dollar |
1 |
Rs.61.52 |
|
|
1 |
Rs.97.39 |
|
Euro |
1 |
Rs.76.16 |
INFORMATION DETAILS
|
Analysis Done by
: |
SUB |
|
|
|
|
Report Prepared
by : |
NIT |
RATING EXPLANATIONS
|
RATING |
STATUS |
PROPOSED CREDIT LINE |
|
|
|
>86 |
Aaa |
Possesses an extremely sound financial base with the strongest
capability for timely payment of interest and principal sums |
Unlimited |
|
|
71-85 |
Aa |
Possesses adequate working capital. No caution needed for credit
transaction. It has above average (strong) capability for payment of interest
and principal sums |
Large |
|
|
56-70 |
A |
Financial & operational base are regarded healthy. General unfavourable
factors will not cause fatal effect. Satisfactory capability for payment of
interest and principal sums |
Fairly Large |
|
|
41-55 |
Ba |
Overall operation is considered normal. Capable to meet normal
commitments. |
Satisfactory |
|
|
26-40 |
B |
Capability to overcome financial difficulties seems comparatively
below average. |
Small |
|
|
11-25 |
Ca |
Adverse factors are apparent. Repayment of interest and principal sums
in default or expected to be in default upon maturity |
Limited with full
security |
|
|
<10 |
C |
Absolute credit risk exists. Caution needed to be exercised |
Credit not
recommended |
|
|
-- |
NB |
New Business |
-- |
|
This score serves as a reference to assess SC’s
credit risk and to set the amount of credit to be extended. It is calculated
from a composite of weighted scores obtained from each of the major sections of
this report. The assessed factors and their relative weights (as indicated
through %) are as follows:
Financial
condition (40%) Ownership
background (20%) Payment
record (10%)
Credit history
(10%) Market trend (10%) Operational size
(10%)
This report is issued at your request without any
risk and responsibility on the part of MIRA INFORM PRIVATE LIMITED (MIPL) or
its officials.