MIRA INFORM REPORT
|
Report Date : |
12.11.2014 |
IDENTIFICATION DETAILS
|
Name : |
GUFIC BIOSCIENCES LIMITED (w.e.f.20.07.2000) |
|
|
|
|
Formerly Known
As : |
CENTRAL FINANCE LIMITED |
|
|
|
|
Registered
Office : |
37, First Floor, Kamala Bhavan ll, s. Nityananad Road, Andheri (East),
Mumbai – 400 069, Maharashtra |
|
|
|
|
Country : |
|
|
|
|
|
Financials (as
on) : |
31.03.2014 |
|
|
|
|
Date of
Incorporation : |
23.07.1984 |
|
|
|
|
Com. Reg. No.: |
11-033519 |
|
|
|
|
Capital
Investment / Paid-up Capital : |
Rs. 77.350 Millions |
|
|
|
|
CIN No.: [Company Identification
No.] |
L65990MH1984PLC033519 |
|
|
|
|
IEC No.: |
Not Divulged |
|
|
|
|
TAN No.: [Tax Deduction &
Collection Account No.] |
MUMG06173G |
|
|
|
|
PAN No.: [Permanent Account No.] |
Not Divulged |
|
|
|
|
Legal Form : |
A Public Limited Liability Company. The Company’s Shares are Listed on
the Stock Exchanges. |
|
|
|
|
Line of Business
: |
Manufacturer of Bulk Drugs, Pharmaceutical and Herbal Products. |
|
|
|
|
No. of Employees
: |
Information declined by the management. |
RATING & COMMENTS
|
MIRA’s Rating : |
Ba (42) |
|
RATING |
STATUS |
PROPOSED CREDIT LINE |
|
|
41-55 |
Ba |
Overall operation is considered normal. Capable to meet normal
commitments. |
Satisfactory |
|
Maximum Credit Limit : |
USD 740000 |
|
|
|
|
Status : |
Satisfactory |
|
|
|
|
Payment Behaviour : |
Slow but correct |
|
|
|
|
Litigation : |
Clear |
|
|
|
|
Comments : |
Subject is an established company having satisfactory track record. General financial position of the company is normal and acceptable for
business dealings. Trade relations are reported as fair. Business is active. Payments
terms are reported to be slow but correct. The company can be considered for business dealings at usual trade
terms and conditions. |
NOTES :
Any query related to this report can be made
on e-mail : infodept@mirainform.com
while quoting report number, name and date.
ECGC Country Risk Classification List – June 1, 2014
|
Country Name |
Previous Rating (31.03.2014) |
Current Rating (01.06.2014) |
|
India |
A1 |
A1 |
|
Risk Category |
ECGC
Classification |
|
Insignificant |
A1 |
|
Low |
A2 |
|
Moderate |
B1 |
|
High |
B2 |
|
Very High |
C1 |
|
Restricted |
C2 |
|
Off-credit |
D |
INDIAN ECONOMIC OVERVIEW
N E W S
Verdict Implications
: Apex court order may alter coal import dynamics. Traders go slow on talks over
coal supply contracts, uncertainty over cancellation of blocks weigh on stocks.
Recent arrest of the
Chennai head of the Registrar of Companies, the ministry of corporate affairs arm
that ensures that companies file all the information required by the Companies
Act is the latest manifestation of a messy fight between a father and his
adopted son for the control of Rs 40000 mn business empire. The Central Bureau
of Investigation arrested Manumeethi Cholan after he accepted Rs 10 lakhs as
bribe from M A M Ramaswamy, a CBI official said.
Central Bureau of
Investigation books Electrotherm for cheating Central Bank of Rs 4360 mn.
Infosys maintains
revenue guidance. COO Rao says attrition still an area of concern and it would
take a few more quarters to bring down levels to 13-15 %.
DHL to invest
Euro 100 mn in India over next 2 years. The firm has chosen India to pilot its
e-commerce business model for the Asia-Pacific region.
Blackstone may buy
stake in BlueRidge SEZ in line with the fund’s real estate strategy in India.
Kingfisher Airlines
Ltd grounded in October 2012 under the weight of heavy debt and accumulated
losses, recently approached the Delhi high court for relief in two separate
cases. The airline challenged a notice by Punjab & National Bank alleging
that It had wilfully defaulted on Rs 7700 mn of loans and sought more time to
comply with the requirements under the listing agreements with the Stock
Exchanges.
OnMobile likely to
sack another 300 employees. The lay-offs follow a spate of senior-level exits
over the past two years, starting with of its founder. The overall lay-offs
could number around 600 and are driven by the need to cut costs, says a former
employee.
EXTERNAL AGENCY RATING
|
Rating Agency Name |
ICRA |
|
Rating |
Term Loans (BB+) |
|
Rating Explanation |
Moderate risk of default |
|
Date |
March 2014 |
RBI DEFAULTERS’ LIST STATUS
Subject’s name is not enlisted as a defaulter in
the publicly available RBI Defaulters’ list.
EPF (Employee Provident Fund) DEFAULTERS’ LIST STATUS
Subject’s name is not enlisted as a defaulter
in the publicly available EPF (Employee Provident Fund) Defaulters’ list as of
31-03-2014.
INFORMATION DENIED
Management Non co-operative (91-22-67261000)
LOCATIONS
|
Registered Office : |
37, First Floor, Kamala Bhavan ll, s. Nityananad Road, Andheri (East),
Mumbai – 400 069, Maharashtra, India |
|
Tel. No.: |
Not Available |
|
Fax No.: |
Not Available |
|
E-Mail : |
|
|
Website : |
|
|
|
|
|
Corporate Office : |
2ND Floor, 'Dorr Oliver' House, B. D. Sawant Marg, Chakala, Andheri (East), Mumbai – 400099, Maharashtra, India. |
|
Tel. No.: |
91-22-67261000 |
|
Fax No.: |
91-22-67261067 /68 |
|
|
|
|
Factory : |
National Highway No. 8, Near Grid, Kabilpore Navsari - 396 424, Gujarat, India |
|
Tel. No.: |
91-2637-239946 / 329424 |
DIRECTORS
AS ON 31.03.2014
|
Name : |
Mr. Jayesh P. Choksi |
|
Designation : |
Chairman and Managing Director |
|
|
|
|
Name : |
Mr. Pranav J. Choksi |
|
Designation : |
Executive Director |
|
|
|
|
Name : |
Dr. M.G. Dhapalapur |
|
Designation : |
Executive Director |
|
|
|
|
Name : |
Dr. Sharat S. Gandhi |
|
Designation : |
Non-executive Independent Director |
|
|
|
|
Name : |
Mr. Ashok M. Tarale |
|
Designation : |
Non-executive Independent Director |
|
|
|
|
Name : |
Mr. Pankaj J. Gandhi |
|
Designation : |
Executive Wholetime Director |
|
|
|
|
Name : |
Mr. Jagdish D. Shah |
|
Designation : |
Non-executive Independent Director |
|
|
|
|
Name : |
Mr. Khantilal N. Sanghavi |
|
Designation : |
Non-executive Independent Director |
KEY EXECUTIVES
|
Name : |
Mr. Santoshkumar J. Sharma |
|
Designation : |
Company Secretary and Compliance Officer |
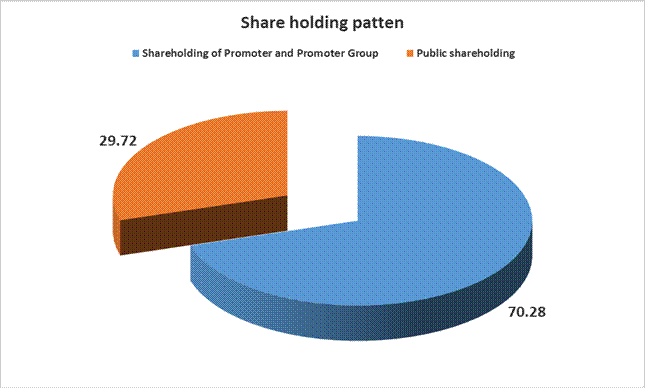
MAJOR SHAREHOLDERS / SHAREHOLDING PATTERN
As on 30.09.2014
|
Category
of Shareholder |
Total No.
of Shares |
Total
Shareholding as a % of Total No. of Shares |
|
|
|
As a % of (A+B) |
|
(A) Shareholding of Promoter
and Promoter Group |
|
|
|
|
|
|
|
|
28273358 |
36.71 |
|
|
25854287 |
33.57 |
|
|
54127645 |
70.28 |
|
|
|
|
|
Total shareholding of Promoter
and Promoter Group (A) |
54127645 |
70.28 |
|
(B) Public Shareholding |
|
|
|
|
|
|
|
|
240 |
0.00 |
|
|
1199517 |
1.56 |
|
|
1199757 |
1.56 |
|
|
|
|
|
|
8749378 |
11.36 |
|
|
|
|
|
|
10896529 |
14.15 |
|
|
1310716 |
1.70 |
|
|
734057 |
0.95 |
|
|
274039 |
0.36 |
|
|
235095 |
0.31 |
|
|
186944 |
0.24 |
|
|
37979 |
0.05 |
|
|
21690680 |
28.16 |
|
Total Public shareholding (B) |
22890437 |
29.72 |
|
Total (A)+(B) |
77018082 |
100.00 |
|
(C) Shares held by Custodians and
against which Depository Receipts have been issued |
0 |
0.00 |
|
|
0 |
0.00 |
|
|
0 |
0.00 |
|
|
0 |
0.00 |
|
Total (A)+(B)+(C) |
77018082 |
0.00 |
BUSINESS DETAILS
|
Line of Business : |
Manufacturer of Bulk Drugs, Pharmaceutical and Herbal Products. |
||||||||
|
|
|
||||||||
|
Products : |
|
||||||||
|
|
|
||||||||
|
Brand Names : |
Not Divulged |
||||||||
|
|
|
||||||||
|
Agencies Held : |
Not Divulged |
||||||||
|
|
|
||||||||
|
Exports : |
Not Divulged |
||||||||
|
Products : |
|
||||||||
|
|
|
||||||||
|
Imports : |
Not Divulged |
||||||||
|
|
|
||||||||
|
Terms : |
|
||||||||
|
Selling : |
Not Divulged |
||||||||
|
|
|
||||||||
|
Purchasing : |
Not Divulged |
GENERAL INFORMATION
|
Suppliers : |
Not Divulged |
||||||||||||||||||||||||||||||||||||||||||||||||
|
|
|
||||||||||||||||||||||||||||||||||||||||||||||||
|
Customers : |
Not Divulged |
||||||||||||||||||||||||||||||||||||||||||||||||
|
|
|
||||||||||||||||||||||||||||||||||||||||||||||||
|
No. of Employees : |
Information declined by the management. |
||||||||||||||||||||||||||||||||||||||||||||||||
|
|
|
||||||||||||||||||||||||||||||||||||||||||||||||
|
Bankers : |
|
||||||||||||||||||||||||||||||||||||||||||||||||
|
|
|
||||||||||||||||||||||||||||||||||||||||||||||||
|
Facilities : |
SHORT TERM
BORROWINGS Details of
Security: For Rupee Loan Hypothecation of stocks and book debts. The facilities granted to the company are further secured by Equitable / Legal mortgage of land and factory building of Gufic Private Limited - company in which directors are interested, situated at Navsari, against the credit facilities sanctioned to the company. The loans are secuered by personal guarantee of Managing Director and Executive Director and the loan are secured by a corporate guarantee of Gufic Private Limited. They carry interest @ 14.25%. |
|
|
|
|
Banking
Relations : |
-- |
|
|
|
|
Auditors : |
|
|
Name : |
S H R and Company Chartered Accountants |
|
|
|
|
Associates/Subsidiaries : |
Not Available |
CAPITAL STRUCTURE
As on 31.03.2014
Authorised Capital :
|
No. of Shares |
Type |
Value |
Amount |
|
|
|
|
|
|
100000000 |
Equity Shares |
Re.1/- each |
Rs.100.000 Millions |
|
|
|
|
|
Issued, Subscribed & Paid-up Capital :
|
No. of Shares |
Type |
Value |
Amount |
|
|
|
|
|
|
77350000 |
Equity Shares |
Re.1/- each |
Rs. 77.350 Millions |
|
|
|
|
|
Reconciliation of the
number of shares and amount outstanding at the Beginning and at the end of the
reporting period:
|
Equity Shares |
31st
March 2014 |
|
|
|
No of Shares |
Rs. in Million |
|
Shares outstanding at the Beginning of the year |
77350000 |
77.350 |
|
Changes during the year |
-- |
-- |
|
Shares outstanding at the end of the year |
77350000 |
77.350 |
TERMS / RIGHTS
ATTACHED TO SHARES:
The Company has only one class of equity shares having a par value of Rs. 1 per shares. Each holder of equity share is entitled to one vote per share. The dividend proposed by the Board of Directors is subject to the approval of the shareholders in the ensuing Annual General Meeting except in case of interim dividend. In the event of liquidation of the company, the holders of equity shares will be entitled to receive remaining assets of the company, after distribution of all preferential amounts. The distribution will be in proportion to the number of equity shares held by the shareholder.
DETAILS OF SHARES
HELD BY EACH SHAREHOLDER HOLDING MORE THAN 5% SHARES:
|
Name of Shareholders |
31.03.2014 |
|
|
|
No of Shares |
% |
|
Zircon Finance and Leasing Private Limited |
20523330 |
26.53% |
|
Jayesh Pannalal Choksi |
18010259 |
23.28% |
|
Sambhav Properties Private Limited |
7741550 |
10.01% |
|
Pranav Jayesh Choksi |
6975826 |
9.02% |
|
Gufic Private Limited |
5330957 |
6.89% |
FINANCIAL DATA
[all figures are
in Rupees Millions]
ABRIDGED BALANCE
SHEET
|
SOURCES OF FUNDS |
31.03.2014 |
31.03.2013 |
31.03.2012 |
|
|
|
|
|
|
I.
EQUITY AND LIABILITIES |
|
|
|
|
(1)Shareholders' Funds |
|
|
|
|
(a) Share Capital |
77.350 |
77.350 |
77.350 |
|
(b) Reserves &
Surplus |
184.737 |
146.589 |
117.792 |
|
(c) Money received
against share warrants |
0.000 |
0.000 |
0.000 |
|
|
|
|
|
|
(2) Share Application
money pending allotment |
0.000 |
0.000 |
0.000 |
|
Total Shareholders’ Funds
(1) + (2) |
262.087 |
223.939 |
195.142 |
|
|
|
|
|
|
(3) Non-Current
Liabilities |
|
|
|
|
(a) long-term borrowings |
148.880 |
184.395 |
43.180 |
|
(b) Deferred tax
liabilities (Net) |
30.169 |
29.469 |
24.150 |
|
(c) Other long term
liabilities |
53.688 |
9.550 |
10.150 |
|
(d) long-term provisions |
13.529 |
11.868 |
9.973 |
|
Total Non-current
Liabilities (3) |
246.266 |
235.282 |
87.453 |
|
|
|
|
|
|
(4) Current Liabilities |
|
|
|
|
(a) Short term borrowings |
147.664 |
137.368 |
153.197 |
|
(b) Trade payables |
317.963 |
201.395 |
222.156 |
|
(c) Other current
liabilities |
112.769 |
77.425 |
64.228 |
|
(d) Short-term provisions |
24.707 |
20.355 |
19.102 |
|
Total Current Liabilities
(4) |
603.103 |
436.543 |
458.683 |
|
|
|
|
|
|
TOTAL |
1111.456 |
895.764 |
741.278 |
|
|
|
|
|
|
II.
ASSETS |
|
|
|
|
(1) Non-current assets |
|
|
|
|
(a) Fixed Assets |
|
|
|
|
(i) Tangible assets |
301.861 |
267.767 |
172.696 |
|
(ii) Intangible Assets |
0.425 |
0.531 |
4.409 |
|
(iii) Capital work-in-progress |
0.000 |
29.766 |
10.654 |
|
(iv) Intangible assets
under development |
0.000 |
0.000 |
0.000 |
|
(b) Non-current
Investments |
0.093 |
0.093 |
0.092 |
|
(c) Deferred tax assets
(net) |
0.000 |
0.000 |
0.000 |
|
(d) Long-term Loan and Advances |
83.365 |
76.247 |
54.886 |
|
(e) Other Non-current
assets |
32.669 |
19.152 |
0.518 |
|
Total Non-Current Assets |
418.413 |
393.556 |
243.255 |
|
|
|
|
|
|
(2) Current assets |
|
|
|
|
(a) Current investments |
0.000 |
0.000 |
0.000 |
|
(b) Inventories |
261.154 |
199.959 |
169.094 |
|
(c) Trade receivables |
282.071 |
200.148 |
225.715 |
|
(d) Cash and cash
equivalents |
25.414 |
12.782 |
9.627 |
|
(e) Short-term loans and
advances |
124.404 |
89.319 |
86.086 |
|
(f) Other current assets |
0.000 |
0.000 |
7.501 |
|
Total Current Assets |
693.043 |
502.208 |
498.023 |
|
|
|
|
|
|
TOTAL |
1111.456 |
895.764 |
741.278 |
PROFIT & LOSS
ACCOUNT
|
|
PARTICULARS |
31.03.2014 |
31.03.2013 |
31.03.2012 |
|
|
SALES |
|
|
|
|
|
Income |
1230.112 |
1001.441 |
835.651 |
|
|
Other Income |
6.253 |
3.860 |
3.677 |
|
|
TOTAL (A) |
1236.365 |
1005.301 |
839.328 |
|
|
|
|
|
|
|
Less |
EXPENSES |
|
|
|
|
|
Cost of Materials
Consumed |
519.433 |
328.768 |
258.885 |
|
|
Purchases of
Stock-in-Trade |
137.703 |
192.199 |
195.339 |
|
|
Changes in inventories of
finished goods, work-in-progress and Stock-in-Trade |
4.086 |
(10.775) |
(4.622) |
|
|
Employees benefits
expense |
119.434 |
54.485 |
46.028 |
|
|
Other expenses |
329.141 |
329.291 |
268.878 |
|
|
TOTAL (B) |
1109.797 |
893.968 |
764.508 |
|
|
|
|
|
|
|
Less |
PROFIT/ (LOSS) BEFORE INTEREST, TAX, DEPRECIATION AND
AMORTISATION (C) |
126.568 |
111.333 |
74.820 |
|
|
|
|
|
|
|
Less |
FINANCIAL EXPENSES (D) |
39.157 |
36.907 |
26.307 |
|
|
|
|
|
|
|
|
PROFIT / (LOSS) BEFORE
TAX, DEPRECIATION AND AMORTISATION (C-D) (E) |
87.411 |
74.426 |
48.513 |
|
|
|
|
|
|
|
Less/ Add |
DEPRECIATION/
AMORTISATION (F) |
24.677 |
21.795 |
18.812 |
|
|
|
|
|
|
|
|
PROFIT/ (LOSS) BEFORE TAX (E-F) (G) |
62.734 |
52.631 |
29.701 |
|
|
|
|
|
|
|
Less |
TAX (H) |
20.091 |
19.339 |
14.430 |
|
|
|
|
|
|
|
|
PROFIT/ (LOSS) AFTER TAX
(G-H) (I) |
42.643 |
33.292 |
15.271 |
|
|
|
|
|
|
|
Add |
PREVIOUS YEARS’ BALANCE
BROUGHT FORWARD (J) |
131.868 |
103.071 |
92.295 |
|
|
|
|
|
|
|
Less |
APPROPRIATIONS |
|
|
|
|
|
Transfer to General
Reserve |
0.000 |
0.000 |
0.000 |
|
|
Dividend |
3.868 |
3.868 |
3.868 |
|
|
Tax on Dividend |
0.627 |
0.627 |
0.627 |
|
|
Total (K) |
4.495 |
4.495 |
4.495 |
|
|
|
|
|
|
|
|
Balance Carried to the
B/S (I+J-K) |
170.016 |
131.868 |
103.071 |
|
|
|
|
|
|
|
|
EARNINGS IN FOREIGN CURRENCY |
|
|
|
|
|
F.O.B. Value of Exports |
92.288 |
116.946 |
87.138 |
|
|
TOTAL EARNINGS |
92.288 |
116.946 |
87.138 |
|
|
|
|
|
|
|
|
IMPORTS |
|
|
|
|
|
Raw Materials / Merchant
Goods |
179.032 |
67.944 |
29.309 |
|
|
Finished Goods |
5.300 |
0.000 |
0.000 |
|
|
Capital Goods |
0.000 |
36.230 |
0.000 |
|
|
TOTAL IMPORTS |
184.332 |
104.174 |
29.309 |
|
|
|
|
|
|
|
|
Earnings / (Loss) Per
Share (Rs.) |
0.55 |
0.43 |
0.20 |
KEY RATIOS
|
PARTICULARS |
|
31.03.2014 |
31.03.2013 |
31.03.2012 |
|
|
|
|
|
|
|
Net Profit Margin PAT / Sales |
(%) |
3.47 |
3.32 |
1.83 |
|
|
|
|
|
|
|
Operating Profit Margin (PBDIT/Sales) |
(%) |
10.29 |
11.12 |
8.95 |
|
|
|
|
|
|
|
Return on Total Assets (PBT/Total Assets} |
(%) |
5.64 |
6.08 |
4.07 |
|
|
|
|
|
|
|
Return on Investment (ROI) (PBT/Networth) |
|
0.24 |
0.24 |
0.15 |
|
|
|
|
|
|
|
Debt Equity Ratio (Total Debt /Networth) |
|
1.13 |
1.44 |
1.01 |
|
|
|
|
|
|
|
Current Ratio (Current Asset/Current Liability) |
|
1.15 |
1.15 |
1.09 |
FINANCIAL ANALYSIS
[all figures are
in Rupees Millions]
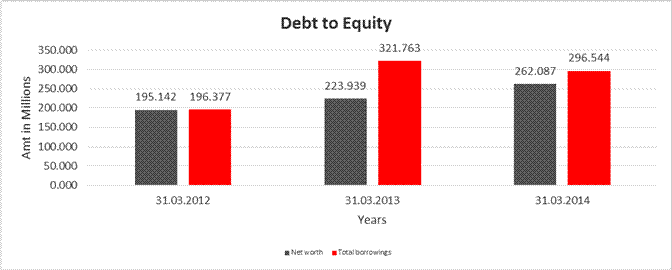
DEBT EQUITY RATIO
|
Particular |
31.03.2012 |
31.03.2013 |
31.03.2014 |
|
|
(Rs. In Millions) |
(Rs. In Millions) |
(Rs. In Millions) |
|
Share Capital |
77.350 |
77.350 |
77.350 |
|
Reserves & Surplus |
117.792 |
146.589 |
184.737 |
|
Net worth |
195.142 |
223.939 |
262.087 |
|
|
|
|
|
|
long-term borrowings |
43.180 |
184.395 |
148.880 |
|
Short term borrowings |
153.197 |
137.368 |
147.664 |
|
Total borrowings |
196.377 |
321.763 |
296.544 |
|
Debt/Equity ratio |
1.006 |
1.437 |
1.131 |
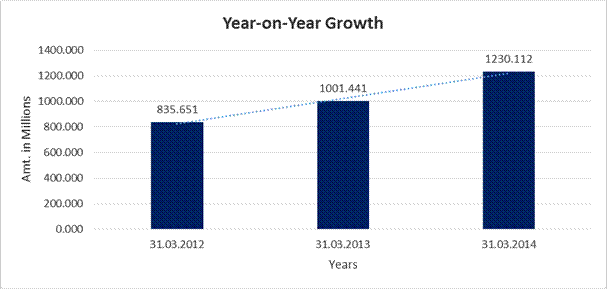
YEAR-ON-YEAR GROWTH
|
Year on Year Growth |
31.03.2012 |
31.03.2013 |
31.03.2014 |
|
|
(Rs. In Millions) |
(Rs. In Millions) |
(Rs. In Millions) |
|
Sales |
835.651 |
1001.441 |
1230.112 |
|
|
|
19.840 |
22.834 |
NET PROFIT MARGIN
|
Net Profit Margin |
31.03.2012 |
31.03.2013 |
31.03.2014 |
|
|
(Rs. In Millions) |
(Rs. In Millions) |
(Rs. In Millions) |
|
Sales |
835.651 |
1001.441 |
1230.112 |
|
Profit |
15.271 |
33.292 |
42.643 |
|
|
1.83% |
3.32% |
3.47% |
LOCAL AGENCY FURTHER INFORMATION
|
Sr. No. |
Check
List by Info Agents |
Available in Report (Yes / No) |
|
1] |
Year
of Establishment |
Yes |
|
2] |
Locality
of the firm |
Yes |
|
3] |
Constitutions
of the firm |
Yes |
|
4] |
Premises
details |
No |
|
5] |
Type
of Business |
Yes |
|
6] |
Line
of Business |
Yes |
|
7] |
Promoter's
background |
No |
|
8] |
No.
of employees |
No |
|
9] |
Name
of person contacted |
No |
|
10] |
Designation
of contact person |
No |
|
11] |
Turnover
of firm for last three years |
Yes |
|
12] |
Profitability
for last three years |
Yes |
|
13] |
Reasons
for variation <> 20% |
------------------------ |
|
14] |
Estimation
for coming financial year |
No |
|
15] |
Capital
in the business |
Yes |
|
16] |
Details
of sister concerns |
No |
|
17] |
Major
suppliers |
No |
|
18] |
Major
customers |
No |
|
19] |
Payments
terms |
No |
|
20] |
Export
/ Import details (if applicable) |
No |
|
21] |
Market
information |
---------------------- |
|
22] |
Litigations
that the firm / promoter involved in |
---------------------- |
|
23] |
Banking
Details |
Yes |
|
24] |
Banking
facility details |
Yes |
|
25] |
Conduct
of the banking account |
---------------------- |
|
26] |
Buyer
visit details |
----------------------- |
|
27] |
Financials,
if provided |
Yes |
|
28] |
Incorporation
details, if applicable |
Yes |
|
29] |
Last
accounts filed at ROC |
Yes |
|
30] |
Major
Shareholders, if available |
Yes |
|
31] |
Date
of Birth of Proprietor/Partner/Director, if available |
No |
|
32] |
PAN
of Proprietor/Partner/Director, if available |
No |
|
33] |
Voter
ID No of Proprietor/Partner/Director, if available |
No |
|
34] |
External
Agency Rating, if available |
Yes |
FINANCIAL HIGHLIGHTS:
During the year the sales increased to Rs. 1236.365 Millions in comparison to previous year's Rs. 1001.441 Millions an increased of 22.83%. PBIDT increased by 13.68% and PBT increased by 19.19% PAT increased by 28.08%.
LISTING DETAILS:
|
|
BSE : 509079 NSE : GUFICBIO ISIN : INE742B01025 |
|
Stock Exchange Place : |
|
MANAGEMENT DISCUSSION
& ANALYSIS REPORT
Gobal Pharma Industry
– an overview
The Global Pharma scenario remains dynamic and challenging. They are witnessing various new developments that make one believe that the ensuing years for pharma companies will be challenging.
The pharmaceutical industry is facing the 'Innovation Challenge' characterized by the drastic decrease in productivity in its R and D and marketing of new molecules. The decrease in innovation capacity of Big Pharmaceutical companies threatens their short and long term economic performance. Another important trend that is being witnessed is the regulatory environment in developed and developing countries. While developed countries are constantly raising the bar, the developing countries are rapidly changing guidelines to bring them on par with the developed countries' regulatory framework. The increased scrutiny from regulators will continue to enforce renewed commitment to quality from the industry.
Further, the disease burden shift towards chronic diseases is rapidly happening. The patients are becoming increasingly empowered and going ahead, will be responsible for an increased portion of healthcare costs due to ever increasing pressure on governments. The value of patent expiries will increase, but the composition of value will shift from small molecule to biologics.
Total global spending on medicines will exceed one trillion US dollars for the first time in 2014 and forecast to reach almost US$1.2 trillion in 2017 up from US$ 956 billion in 2011.The market is forecasted to grow at a compounded annual growth rate (CAGR) of 3-6% over 2013-17. Of this increase, over 70% is expected to come from Pharmerging1 markets, which are expected to grow at 12-15%, while the rest of the growth is expected from the Developed3 markets, which could grow at 1-4% per annum. Sales in the largest pharmaceutical market, i.e., the United States of America (USA), is expected to be US$ 350-380 billion by 2017, with growth in the range of 1 4% per annum. Sales in Japan, the second largest pharmaceutical market is expected to be in the range of US$ 105-110 billion by 2017, reflecting a CAGR of 2-5% during the period 2013-17. The top 5 European markets are expected to grow at a CAGR of 0-3% for the period 2013-17, as compared to 2% CAGR for 2008-12, to achieve sales in the range of US$ 145-160 billion. Pharmerging market sales, with their higher rate of growth, are expected to match or slightly exceed those in the USA pharmaceutical market by 2017, in value terms.
The Indian pharmaceutical industry revenue is expected to expand at a CAGR of 17% during 2008-16 and reach US$ 36 billion. The generics market is expected to grow to US$ 26 billion by 2016.
India's pharmaceutical industry accounts for about 1.4% of the global pharmaceutical industry in value terms and 10% in volume terms. Around 25.5% of the Indian pharmaceutical exports in FY13 were to the USA, making it the single largest destination. Indian exports to the USA have also grown at the highest CAGR of 30% over FY09-FY13 (Source: CMIE). Exports to Africa have increased at a CAGR of 21% during the same period, contributed mainly by export of anti-malarial and anti-retroviral drugs. With a more modest growth rate of 12%, exports to European countries from India have been on the decline. While the pharmaceuticals industry has contributed to the growth of exports in the past, the focus in the future may be on the faster growth Pharmerging markets compared to the developed markets where prices may be greater under threat and the competition may be higher.
VIEW INDEX OF
CHARGES
|
S. No. |
Charge ID |
Date of Charge Creation/Modification |
Charge amount secured |
Charge Holder |
Address |
Service Request Number (SRN) |
|
1 |
10516590 |
12/08/2014 |
10,000,000.00 |
The Saraswat Cooperative Bank Ltd |
SME Vile Parle
Branch, Bholanath Co-op Hsg Soc, Subhash Road, Vile Parle East, Mumbai,
Maharashtra |
C18027672 |
|
2 |
10433270 |
14/06/2013 |
15,000,000.00 |
The Saraswat Cooperative Bank Ltd |
SME Vile Parle Branch,
Bholanath Co-op Hsg Soc, Subhash Road, Vile Parle East, Mumbai,
Maharashtra |
B78060076 |
|
3 |
10398265 |
05/01/2013 |
4,500,000.00 |
The Saraswat Cooperative Bank Ltd |
SME Vile Parle Branch,
Bholanath Co-op Hsg Soc, Subhash Road, Vile Parle East, Mumbai,
Maharashtra |
B66272576 |
|
4 |
10397211 |
20/08/2014 * |
120,000,000.00 |
The Saraswat Cooperative Bank Ltd |
SME Vile Parle Branch,
Bholanath Co-op Hsg Soc, Subhash Road, Vile Parle East, Mumbai,
Maharashtra |
C19255330 |
|
5 |
10398262 |
21/08/2014 * |
54,500,000.00 |
The Saraswat Cooperative Bank Ltd |
SME Vile Parle Branch,
Bholanath Co-op Hsg Soc, Subhash Road, Vile Parle East, Mumbai,
Maharashtra |
C19586841 |
|
6 |
10397209 |
14/08/2014 * |
152,500,000.00 |
The Saraswat Cooperative Bank Ltd |
SME Vile Parle Branch,
Bholanath Co-op Hsg Soc, Subhash Road, Vile Parle East, Mumbai,
Maharashtra |
C18027979 |
|
7 |
10397210 |
21/12/2012 |
85,000,000.00 |
The Saraswat Cooperative Bank Ltd |
SME Vile Parle Branch,
Bholanath Co-op Hsg Soc, Subhash Road, Vile Parle East, Mumbai,
Maharashtra |
B65966905 |
|
8 |
10363676 |
21/06/2012 |
25,800,000.00 |
INTEC CAPITAL LIMITED |
701,MANJUSHA, 57
NEHRU PLACE, NEW DELHI, Delhi - |
B42886622 |
|
9 |
90216128 |
02/02/1985 |
2,000,000.00 |
THE MEMON CO-OP.; BANK LTD. |
MOHAMEDALI ROAD, BOMBAY, Maharashtra - 400003, INDIA |
- |
* Date of charge modification
UNSECURED LOANS
|
PARTICULAR |
31.03.2014 (Rs.
in Millions) |
31.03.2013 (Rs.
in Millions) |
|
LONG TERM
BORROWINGS |
|
|
|
From Directors and Related Parties |
47.144 |
47.152 |
|
Total |
47.144 |
47.152 |
UNAUDITED
FINANCIAL RESULTS FOR THE QUARTER AND 30.06.2014
|
Particulars |
Year ended |
|
30.06.2014 |
|
|
Unaudited |
|
|
Income from Operations |
|
|
(a) Net sates/income from operations (Net of excise duty) |
390.805 |
|
(b) Other Operating Income |
0.206 |
|
Total income from operations (net) |
391.011 |
|
Expenses |
|
|
(a) Cost of materials consumed |
164.695 |
|
(b) Purchases of stock-in trade |
55.344 |
|
(c) Changes in inventories of finished goods. work-in-progress and stock in trade |
(0.165) |
|
(d) Employee benefits expense |
36.753 |
|
(e) Depreciation and Anmortisation Expenses |
9.924 |
|
(f) Other Expenses |
94.989 |
|
Total expenses |
361.540 |
|
Profit/ (Loss) from operations before other Income, finance costs and
exceptional Items |
29.470 |
|
Other Income |
2.924 |
|
Profit/ (Loss) from operations before other income, finance costs and
exceptional items |
32.395 |
|
Finance Costs |
10.585 |
|
Profit/ (Loss) from ordinary activities after finance cost but before
exceptional items |
21.810 |
|
Exceptional items |
0.000 |
|
Profit/ (Loss) from ordinary activities before tax |
21.810 |
|
Tax expenses |
|
|
Current Tax |
7.500 |
|
Deferred tax |
2.373 |
|
Short/(Excess) Tax Provisions of Earlier Years |
0.000 |
|
Net Profit / (Loss) from ordinary activities after tax |
11.937 |
|
Extraordinary item (net of tax expense) |
0.000 |
|
Net Profit / (Loss) for the period |
11.937 |
|
Paid up equity share capital (Face Value of Rs1/-each) |
77.350 |
|
|
|
|
E.P.S |
0.15 |
|
|
|
|
Public Shareholding |
|
|
- Number of shares of Rs. 1/- each |
23222355 |
|
- Percentage of shareholding |
30.02% |
|
|
|
|
Promoters and Promoter group shareholding |
|
|
a) Pledged / Encumbered |
|
|
- Number of shares of Rs. 1/- each |
0 |
|
- Percentage of shares (as a % of the total shareholding of Promoter & Promoter group) |
0.00% |
|
- Percentage of shares (as a % of the total Share Capital of the Company) |
0.00% |
|
|
|
|
b) Non Encumbered |
|
|
- Number of shares Rs. 1/- each |
54127645 |
|
- Percentage of shares (as a % of the total shareholding of Promoter & Promoter group) |
100.00% |
|
- Percentage of shares (as a % of the total Share Capital of the Company) |
69.98% |
Segment wise Revenue
Results and Capital Employed under clause 41 of the Listing Agreement
|
Particulars |
Quarter Ended |
|
30.06.2014 |
|
|
Unaudited |
|
|
SEGMENT REVENUE |
|
|
Sales and Service |
|
|
Pharma |
355.496 |
|
Consumer |
35.309 |
|
Total |
390.805 |
|
Unallocabel Income |
3.130 |
|
Total Segment
Revenue |
393.935 |
|
|
|
|
SEGMENT RESULT |
|
|
Pharma |
69.320 |
|
Consumer |
3.730 |
|
TOTAL |
73.050 |
|
Less : Unallocated over heads |
30.732 |
|
Finance Charges |
10.585 |
|
Depreciation |
9.924 |
|
Tax Provision |
9.873 |
|
Net Profit after
Tax |
11.937 |
Note:
The above interim financial results have been review/ed by the Audit Committee of the Board and approved by the Board of Directors in their meetings held on August 14, 2014. The same has been subjected to limited review by the Statutory Auditors.
For the preparation of these financial results, the company has followed the
same accounting policies and generally accepted practices adopted for the
preparation of audited financial statements for the year ended March 31, 2014,
except for accounting of depreciation on fixed assets.
As per the requirement of the Companies Act, 2013 (Act), the company has
reassessed the remaining useful life of the fixed assets taking into
consideration the useful life prescribed in Schedule II of the Act. This has
resulted in an additional charge of depreciation of Rs. 1.162 Millions for the
quarter ended June 30, 2014. Further, the written down value of the assets of
Rs. 28.828 Millions as on April 01, 2014 (net of deferred tax of Rs. 13.845
Millions) whose residual life is exhausted has been adjusted against the
opening balance of Reserves and Surplus.
Corresponding previous period figures have been regrouped / rearranged wherever
necessary to make them comparable with current period figures.
The figures of the last quarter of financial year 2013-2014 are the balancing
figures between audited figures in respect of the full financial year upto
March 31, 2014 and the unaudited published year - to - date figures upto
December 31, 2013 which were subject to limited review.
FIXED ASSETS
- Factory Building not owned the company
- Plant and equipment
- Furniture and Fixture
- Vehicle
- Office Equipment
- Electrical Installation
- Computer
- Computer Software
CMT REPORT (Corruption, Money Laundering & Terrorism]
The Public Notice information has been collected from various sources
including but not limited to: The Courts,
1] INFORMATION ON
DESIGNATED PARTY
No exist designating subject or any of its beneficial owners, controlling
shareholders or senior officers as terrorist or terrorist organization or whom
notice had been received that all financial transactions involving their assets
have been blocked or convicted, found guilty or against whom a judgement or
order had been entered in a proceedings for violating money-laundering,
anti-corruption or bribery or international economic or anti-terrorism sanction
laws or whose assets were seized, blocked, frozen or ordered forfeited for
violation of money laundering or international anti-terrorism laws.
2] Court Declaration :
No exist to suggest that subject is or was
the subject of any formal or informal allegations, prosecutions or other
official proceeding for making any prohibited payments or other improper payments
to government officials for engaging in prohibited transactions or with
designated parties.
3] Asset Declaration :
No records exist to suggest that the property or assets of the subject
are derived from criminal conduct or a prohibited transaction.
4] Record on Financial
Crime :
Charges or conviction
registered against subject: None
5] Records on Violation of
Anti-Corruption Laws :
Charges or
investigation registered against subject: None
6] Records on Int’l
Anti-Money Laundering Laws/Standards :
Charges or
investigation registered against subject: None
7] Criminal Records
No
available information exist that suggest that subject or any of its principals
have been formally charged or convicted by a competent governmental authority
for any financial crime or under any formal investigation by a competent
government authority for any violation of anti-corruption laws or international
anti-money laundering laws or standard.
8] Affiliation with
Government :
No record
exists to suggest that any director or indirect owners, controlling
shareholders, director, officer or employee of the company is a government
official or a family member or close business associate of a Government
official.
9] Compensation Package :
Our market
survey revealed that the amount of compensation sought by the subject is fair
and reasonable and comparable to compensation paid to others for similar
services.
10] Press Report :
No press reports / filings exists on
the subject.
CORPORATE GOVERNANCE
MIRA INFORM as part of its Due Diligence do provide comments on
Corporate Governance to identify management and governance. These factors often
have been predictive and in some cases have created vulnerabilities to credit
deterioration.
Our Governance Assessment focuses principally on the interactions
between a company’s management, its Board of Directors, Shareholders and other
financial stakeholders.
CONTRAVENTION
Subject is not known to have contravened any existing local laws,
regulations or policies that prohibit, restrict or otherwise affect the terms
and conditions that could be included in the agreement with the subject.
FOREIGN EXCHANGE RATES
|
Currency |
Unit
|
Indian Rupees |
|
US Dollar |
1 |
Rs. 61.55 |
|
|
1 |
Rs. 97.52 |
|
Euro |
1 |
Rs. 76.48 |
INFORMATION DETAILS
|
Information
Gathered by : |
NYA |
|
|
|
|
Analysis Done by
: |
DIV |
|
|
|
|
Report Prepared
by : |
TRU |
SCORE & RATING EXPLANATIONS
|
SCORE FACTORS |
RANGE |
POINTS |
|
HISTORY |
1~10 |
5 |
|
PAID-UP CAPITAL |
1~10 |
5 |
|
OPERATING SCALE |
1~10 |
4 |
|
FINANCIAL CONDITION |
|
|
|
--BUSINESS SCALE |
1~10 |
5 |
|
--PROFITABILIRY |
1~10 |
4 |
|
--LIQUIDITY |
1~10 |
5 |
|
--LEVERAGE |
1~10 |
5 |
|
--RESERVES |
1~10 |
5 |
|
--CREDIT LINES |
1~10 |
4 |
|
--MARGINS |
-5~5 |
-- |
|
DEMERIT POINTS |
|
|
|
--BANK CHARGES |
YES/NO |
YES |
|
--LITIGATION |
YES/NO |
NO |
|
--OTHER ADVERSE INFORMATION |
YES/NO |
NO |
|
MERIT POINTS |
|
|
|
--SOLE DISTRIBUTORSHIP |
YES/NO |
NO |
|
--EXPORT ACTIVITIES |
YES/NO |
NO |
|
--AFFILIATION |
YES/NO |
NO |
|
--LISTED |
YES/NO |
YES |
|
--OTHER MERIT FACTORS |
YES/NO |
YES |
|
DEFAULTER |
|
|
|
--RBI |
YES/NO |
NO |
|
--EPF |
YES/NO |
NO |
|
TOTAL |
|
42 |
This score serves as a reference to assess
SC’s credit risk and to set the amount of credit to be extended. It is
calculated from a composite of weighted scores obtained from each of the major
sections of this report. The assessed factors and their relative weights (as
indicated through %) are as follows:
Financial
condition (40%) Ownership
background (20%) Payment
record (10%)
Credit history
(10%) Market trend (10%) Operational size
(10%)
RATING EXPLANATIONS
|
RATING |
STATUS |
PROPOSED CREDIT LINE |
|
|
>86 |
Aaa |
Possesses an extremely sound financial base with the strongest
capability for timely payment of interest and principal sums |
Unlimited |
|
71-85 |
Aa |
Possesses adequate working capital. No caution needed for credit transaction.
It has above average (strong) capability for payment of interest and
principal sums |
Large |
|
56-70 |
A |
Financial & operational base are regarded healthy. General
unfavourable factors will not cause fatal effect. Satisfactory capability for
payment of interest and principal sums |
Fairly Large |
|
41-55 |
Ba |
Overall operation is considered normal. Capable to meet normal
commitments. |
Satisfactory |
|
26-40 |
B |
Capability to overcome financial difficulties seems comparatively below
average. |
Small |
|
11-25 |
Ca |
Adverse factors are apparent. Repayment of interest and principal sums
in default or expected to be in default upon maturity |
Limited with
full security |
|
<10 |
C |
Absolute credit risk exists. Caution needed to be exercised |
Credit not
recommended |
|
-- |
NB |
New Business |
-- |
This report is issued at your request without any
risk and responsibility on the part of MIRA INFORM PRIVATE LIMITED (MIPL)
or its officials.