MIRA
INFORM REPORT
|
Report Date : |
24.11.2014 |
IDENTIFICATION DETAILS
|
Name : |
CAIRN INDIA LIMITED |
|
|
|
|
Formerly Known
As : |
CAIRN ENERGY INDIA PTY LIMITED |
|
|
|
|
Registered
Office : |
101, West View, Veer Savarkar Marg, Prabhadevi, Mumbai - 400025, |
|
|
|
|
Country : |
|
|
|
|
|
Financials (as
on) : |
31.03.2014 |
|
|
|
|
Date of
Incorporation : |
21.08.2006 |
|
|
|
|
Com. Reg. No.: |
11-163934 |
|
|
|
|
Capital Investment
/ Paid-up Capital : |
Rs.19076.300 Millions |
|
|
|
|
CIN No.: [Company Identification
No.] |
L11101MH2006PLC163934 |
|
|
|
|
IEC No.: |
Not Divulged |
|
|
|
|
TAN No.: [Tax Deduction &
Collection Account No.] |
CHEC01025D MUMC1453E |
|
|
|
|
PAN No.: [Permanent Account No.] |
AAACC3097L AACCC8799D |
|
|
|
|
Legal Form : |
A Public Limited Liability Company. The Company’s Shares are Listed on
the Stock Exchanges. |
|
|
|
|
Line of Business
: |
Subject is engaged in the business of surveying, prospecting,
drilling, exploring, acquiring, developing, producing, maintaining, refining,
storing, trading, supplying, transporting, marketing, distributing,
importing, exporting and generally dealing in minerals, oils, petroleum, gas
and related by-products and other activities incidental to the above. |
|
|
|
|
No. of Employees
: |
1643 (Approximately) |
RATING & COMMENTS
|
MIRA’s Rating : |
Aa (80) |
|
RATING |
STATUS |
PROPOSED CREDIT LINE |
|
|
71-85 |
Aa |
Possesses adequate working capital. No caution needed for credit
transaction. It has above average (strong) capability for payment of interest
and principal sums |
Large |
|
Status : |
Good |
|
|
|
|
Payment Behaviour : |
Regular |
|
|
|
|
Litigation : |
Clear |
|
|
|
|
Comments : |
Subject is a well-established company having fine track record. The rating reflects company’s strong financial risk profile marked by
strong liquidity position and decent profitability levels of the company. Trade relations are reported as fair. Business is active. Payments are
reported to be regular and as per commitment. The company can be considered good for normal business dealings at
usual trade terms and conditions. |
NOTES :
Any query related to this report can be made
on e-mail : infodept@mirainform.com
while quoting report number, name and date.
INDIAN ECONOMIC OVERVIEW
N E W S
Verdict Implications
: Apex court order may alter coal import dynamics. Traders go slow on talks
over coal supply contracts, uncertainty over cancellation of blocks weigh on
stocks.
Recent arrest of the
Chennai head of the Registrar of Companies, the ministry of corporate affairs
arm that ensures that companies file all the information required by the
Companies Act is the latest manifestation of a messy fight between a father and
his adopted son for the control of Rs 40000 mn business empire. The Central
Bureau of Investigation arrested Manumeethi Cholan after he accepted Rs 10
lakhs as bribe from M A M Ramaswamy, a CBI official said.
Central Bureau of
Investigation books Electrotherm for cheating Central Bank of Rs 4360 mn.
Infosys maintains revenue
guidance. COO Rao says attrition still an area of concern and it would take a
few more quarters to bring down levels to 13-15 %.
DHL to invest
Euro 100 mn in India over next 2 years. The firm has chosen India to pilot its
e-commerce business model for the Asia-Pacific region.
Blackstone may buy
stake in BlueRidge SEZ in line with the fund’s real estate strategy in India.
Kingfisher Airlines
Ltd grounded in October 2012 under the weight of heavy debt and accumulated
losses, recently approached the Delhi high court for relief in two separate
cases. The airline challenged a notice by Punjab & National Bank alleging
that It had wilfully defaulted on Rs 7700 mn of loans and sought more time to
comply with the requirements under the listing agreements with the Stock
Exchanges.
OnMobile likely to
sack another 300 employees. The lay-offs follow a spate of senior-level exits
over the past two years, starting with of its founder. The overall lay-offs
could number around 600 and are driven by the need to cut costs, says a former
employee.
EXTERNAL AGENCY RATING
|
Rating Agency Name |
ICRA |
|
Rating |
Issuer Rating = AAA |
|
Rating Explanation |
Highest degree of safety and carry lowest
credit risk |
|
Date |
March 2014 |
RBI DEFAULTERS’ LIST STATUS
Subject’s name is not enlisted as a defaulter
in the publicly available RBI Defaulters’ list.
EPF (Employee Provident Fund) DEFAULTERS’ LIST STATUS
Subject’s name is not enlisted as a defaulter in
the publicly available EPF (Employee Provident Fund) Defaulters’ list as of
31-03-2014.
INFORMATION DENIED
Management Non Cooperative (91-124-4141360)
LOCATIONS
|
Registered Office : |
101, West View, Veer
Savarkar Marg, Prabhadevi, Mumbai-400 025, Maharashtra, India |
|
Tel. No.: |
91-22-24376136/ 24338306/ 93/ 23696248/40902613 |
|
Fax No.: |
91-22-24311160 |
|
E-Mail : |
|
|
Website : |
|
|
|
|
|
Corporate Office : |
3rd and 4th Floor,
Vipul Plaza, Suncity, Sector 54, Gurgaon-122 002, Haryana, India |
|
|
|
|
Principal Business Office : |
3rd and 4th
Floor, Orchid Plaza, Suncity Sector 54, Gurgaon – 122002, Haryana, India |
|
Tel. No.: |
91-124-4141360 / 2703456 |
|
Fax No.: |
91-124-2889320 / 2889320 |
|
|
|
|
Head Office : |
Cairn Energy Plc., 50, Lothian Road, Edinburgh, EH3 9BY, Scotland,U. K. |
|
Tel. No.: |
91-131- 2475 3000 |
|
Fax No.: |
91-131- 2475 3030 |
|
E-Mail : |
|
|
Website : |
|
|
|
|
|
Branch Office 1 : |
3, Rajdoot Marg, Chanakyapuri, New Delhi – 110021, India |
|
Tel. No.: |
91-11-24670207 |
|
Fax No.: |
91-11-24673595 |
|
|
|
|
Branch Office 2 : |
12, Bhanwani House,Old Residency Road, Jodhpur - 342011, Rajasthan, India |
|
|
|
|
Oil and Gas Fields : |
Located at:
|
DIRECTORS
As on 31.03.2014
|
Name : |
Mr. Navin Agarwal |
|
Designation : |
Chairman and Non-Executive Director |
|
|
|
|
|
|
|
Name : |
Mr. Tarun Jain |
|
Designation : |
Non-Executive Director |
|
|
|
|
|
|
|
Name : |
Ms. Priya Agarwal |
|
Designation : |
Non-Executive Director |
|
|
|
|
|
|
|
Name : |
Mr. Aman Mehta |
|
Designation : |
Non-Executive Independent Director |
|
|
|
|
Name : |
Mr. Naresh Chandra |
|
Designation : |
Non-Executive Independent Director |
|
|
|
|
|
|
|
Name : |
Dr. Omkar Goswami |
|
Designation : |
Non-Executive Independent Director |
|
|
|
|
|
|
|
|
|
|
Name : |
Edward T Story |
|
Designation : |
Non-Executive Independent Director |
|
|
|
|
Name : |
Mr. P. Elango |
|
Designation : |
Interim Chief Executive Officer and Whole Tome Director |
KEY EXECUTIVES
|
Audit Committee: |
Mr. Aman Mehta
(Chairman) Mr. Naresh
Chandra Dr. Omkar
Goswami Edward T Story Mr. Tarun Jain |
|
|
|
|
Remuneration Committee : |
Mr. Naresh
Chandra (Chairman) Mr. Aman Mehta Dr. Omkar
Goswami Mr. Navin
Agarwal Mr. Tarun Jain |
|
|
|
|
Nomination Committee : |
Mr. Navin
Agarwal (Chairman) Mr. Tarun Jain Edward T Story |
|
|
|
|
Shareholders’\Investors’ Grievance
Committee : |
Dr. Omkar Goswami (Chairman) Edward T Story Mr. Tarun Jain |
|
|
|
|
Name : |
Ms. Neerja Sharma |
|
Designation : |
Director Risk Assurance and Company Secretary |
SHAREHOLDING PATTERN
As on 30.09.2014
|
Category of
Shareholder |
Total No. of Shares |
% of Total No.
of Shares |
|
(A) Shareholding of Promoter and Promoter Group |
|
|
|
|
|
|
|
|
383840413 |
20.47 |
|
|
383840413 |
20.47 |
|
|
|
|
|
|
738873586 |
39.41 |
|
|
738873586 |
39.41 |
|
Total shareholding of Promoter and Promoter Group (A) |
1122713999 |
59.89 |
|
(B) Public Shareholding |
|
|
|
|
|
|
|
|
10554428 |
0.56 |
|
|
170119019 |
9.07 |
|
|
174532 |
0.01 |
|
|
3239396 |
0.17 |
|
|
315450360 |
16.83 |
|
|
499537735 |
26.65 |
|
|
|
|
|
|
16157496 |
0.86 |
|
|
|
|
|
|
43574123 |
2.32 |
|
|
4689550 |
0.25 |
|
|
188080167 |
10.03 |
|
|
1660844 |
0.09 |
|
|
1537190 |
0.08 |
|
|
756369 |
0.04 |
|
|
184125764 |
9.82 |
|
|
252501336 |
13.47 |
|
Total Public shareholding (B) |
752039071 |
40.11 |
|
Total (A)+(B) |
1874753070 |
100.00 |
|
(C) Shares held by Custodians and against which Depository Receipts
have been issued |
0 |
14.78 |
|
|
0 |
0.00 |
|
|
0 |
0.00 |
|
|
0 |
20.25 |
|
Total (A)+(B)+(C) |
1874753070 |
0.00 |

BUSINESS DETAILS
|
Line of Business : |
Subject is engaged in the business of surveying, prospecting,
drilling, exploring, acquiring, developing, producing, maintaining, refining,
storing, trading, supplying, transporting, marketing, distributing,
importing, exporting and generally dealing in minerals, oils, petroleum, gas
and related by-products and other activities incidental to the above. |
||||||
|
|
|
||||||
|
Products : |
|
||||||
|
|
|
||||||
|
Brand Names : |
Not Divulged |
||||||
|
|
|
||||||
|
Agencies Held : |
Not Divulged |
||||||
|
|
|
||||||
|
Exports : |
Not Divulged |
||||||
|
|
|
||||||
|
Imports : |
Not Divulged |
GENERAL INFORMATION
|
Suppliers : |
Not Divulged |
|
|
|
|
Customers : |
Not Divulged |
|
|
|
|
No. of Employees : |
1643 (Approximately) |
|
|
|
|
Bankers : |
·
State Bank of India ·
Deutsche Bank ·
Citibank ·
JP Morgan Chase Bank N.A. ·
HDFC Bank ·
ICICI Bank |
|
Auditors : |
|
|
Name : |
S.R. Batliboi
and Company Chartered Accountants |
|
Address : |
Golf View, Corporate
Tower B, Sector 42, Sector Road, Gurgaon-122 002, Haryana, India |
|
Tel. No.: |
91-124-4644000 |
|
Fax No.: |
91-124-4644050 |
|
|
|
|
Holding / Ultimate
holding company : |
¨ Vedanta Resources Plc. ¨ Vedanta Resources Holdings Limited ¨ Volcan Investments Limited ¨ Sesa Sterlite Limited (formerly Sesa Goa Limited) * * With effect from 26 August 2013 Sesa Sterlite Limited became the Company’s holding company. Prior to that date, it was a fellow subsidiary and also had Significant influence over the Company. |
|
|
|
|
Subsidiary companies : |
·
Cairn Energy Australia Private Limited ·
Cairn Energy India Private Limited ·
CEH Australia Private Limited** ·
Cairn Energy Asia Private Limited ** ·
Sydney Oil Company Private Limited ** ·
Cairn Energy Investments Australia Private
Limited ** ·
Wessington Investments Private Limited ** ·
CEH Australia Limited ·
Cairn India Holdings Limited ·
CIG Mauritius Holding Private Limited ·
CIG Mauritius Private Limited ·
Cairn Energy Holdings Limited ·
Cairn Energy Discovery Limited ·
Cairn Exploration
Limited ·
Cairn Exploration
Limited ·
Cairn Petroleum India Limited ** ·
Cairn Energy Gujarat Block 1 Limited ·
Cairn Exploration
Limited ** ·
Cairn Exploration Limited ·
Cairn Lanka Private Limited ·
Cairn Energy Group Holdings BV ** ·
Cairn Energy India West BV ·
Cairn Energy India West Holding BV ** ·
Cairn Energy Gujarat Holding BV ** ·
Cairn Energy India Holdings BV ** ·
Cairn Energy Netherlands Holdings BV ·
Cairn Energy Gujarat BV ·
Cairn Energy Cambay BV ·
Cairn Energy Cambay Holding BV ** ·
31. Cairn South Africa Proprietary Limited |
|
|
|
|
Fellow subsidiaries
: |
¨ Twin Star Mauritius Holdings Limited ** ¨ Sterlite Industries (India) Limited (merged into Sesa Sterlite Limited on 17, August 2013 ¨ Sesa Resources Limited ** Also has Significant influence over the Company. |
CAPITAL STRUCTURE
As on 31.03.2014
Authorised Capital :
|
No. of Shares |
Type |
Value |
Amount |
|
|
|
|
|
|
2250000000 |
Equity Shares |
Rs.10/- each |
Rs.22500.00 Millions |
|
|
|
|
|
Issued, Subscribed & Paid-up Capital :
|
No. of Shares |
Type |
Value |
Amount |
|
|
|
|
|
|
1907600000 |
Equity Shares |
Rs.10/- each |
Rs.19076.300 Millions |
|
|
|
|
|
a.
Reconciliation of the shares outstanding at the
beginning and at the end of the reporting period
|
|
31ST
march 2014 |
|
|
No. lacs |
Rupees in lacs |
|
|
At the beginning
of the period |
19,102 |
191,024 |
|
Issued during
the period – ESOP |
7 |
66 |
|
Shares
extinguished pursuant to buy back (refer note 40) |
(33) |
(327) |
|
Outstanding at the end of the period |
19,076 |
190,763 |
b.
Terms/ rights attached to equity shares
The Company has only
one class of equity shares having par value of Rs. 10 per share. Each holder of
equity shares is entitled to one vote per share. The dividend, if any, proposed
by the Board of Directors will be subject to the approval of the shareholders
in the ensuing Annual General Meeting.
In the event of
liquidation of the Company, the holders of equity shares will be entitled to
receive assets of the Company remaining after settlement of all liabilities.
The distribution will be in proportion to the number of equity shares held by
the shareholders.
c.
Shares held by holding/ ultimate holding company
and/ or their subsidiaries/ associates
|
|
31ST
march 2014 |
|
Sesa Sterlite Limited (formerly Sesa Goa Limited), the holding company
3,511 lacs (31 March 2013: 3,511 lacs) equity shares of Rs. 10 each fully
paid |
35,114 |
|
Twin Star Mauritius Holdings Limited, subsidiary of Sesa Sterlite
Limited 7,389 lacs (31 March 2013: 7,389 lacs) equity shares of Rs. 10 each
fully paid |
73,887 |
|
Sesa Resources Limited, subsidiary of Sesa Sterlite Limited 327 lacs (31
March 2013: 327 lacs) equity shares of Rs. 10 each fully paid |
3,270 |
Note: On 26 August
2013, Sesa Sterlite Limited acquired Twin Star Mauritius Holdings Limited and became
the Company’s holding company. However, as in the previous year, all the above
entities and the Company continue to be the subsidiaries of Vedanta Resources
Plc.
d.
Aggregate no. of shares issued for consideration
other than cash during the period of five years immediately preceding the
reporting date:
The Company has
issued total 142 lacs equity shares (31 March 2013: 180 lacs equity shares)
during the period of five years immediately preceding the reporting date on
exercise of options granted under the employee stock option plan (ESOP scheme)
wherein part consideration was received in form of employee services. No other
equity shares have been issued for consideration other than cash during the
period five years immediately preceding the end of current period.
e.
Aggregate number and class of shares bought back
during the period of five years immediately preceding the reporting
date:
The Company bought
back 33 lacs equity shares (31 March 2013: Nil) during the period of five years
immediately preceding the reporting date. Also refer note 40 below.
f.
Details of shareholders holding more than 5% shares
in the Company
|
|
31ST
march 2014 |
|
|
No. lacs |
%holding in the
class |
|
|
Equity shares of
Rs. 10 each fully paid |
|
|
|
Twin Star
Mauritius Holdings Limited |
7,389 |
38.73% |
|
Sesa Sterlite
Limited (formerly Sesa Goa Limited) |
3,511 |
18.41% |
|
Cairn UK
Holdings Limited |
1,841 |
9.65% |
|
Life Insurance
Corporation of India |
1,704 |
8.93% |
As per of the Company,
including its register of shareholders/ members, the above shareholding
represents legal ownerships of shares.
FINANCIAL DATA
[all figures are
in Rupees Millions]
ABRIDGED BALANCE
SHEET
|
SOURCES OF FUNDS |
31.03.2014 |
31.03.2013 |
31.03.2012 |
|
I.
EQUITY
AND LIABILITIES |
|
|
|
|
(1)Shareholders'
Funds |
|
|
|
|
(a) Share Capital |
19076.300 |
19102.400 |
19074.000 |
|
(b) Reserves & Surplus |
368705.300 |
321071.200 |
300122.200 |
|
(c) Money
received against share warrants |
0.000 |
0.000 |
0.000 |
|
|
|
|
|
|
(2)
Share Application money pending allotment |
0.000 |
0.000 |
0.000 |
|
Total
Shareholders’ Funds (1) + (2) |
387781.600 |
340173.600 |
319196.200 |
|
|
|
|
|
|
(3) Non-Current Liabilities |
|
|
|
|
(a) long-term borrowings |
0.000 |
0.000 |
0.000 |
|
(b) Deferred tax liabilities (Net) |
4229.400 |
2508.300 |
0.000 |
|
(c) Other long term liabilities |
0.000 |
0.000 |
0.000 |
|
(d) long-term provisions |
16946.500 |
13197.000 |
12.400 |
|
Total Non-current Liabilities (3) |
21175.900 |
15705.300 |
12.400 |
|
|
|
|
|
|
(4) Current Liabilities |
|
|
|
|
(a) Short term borrowings |
0.000 |
0.000 |
0.000 |
|
(b) Trade payables |
5016.900 |
4355.700 |
132.100 |
|
(c) Other current liabilities |
12017.300 |
5265.100 |
13309.900 |
|
(d) Short-term provisions |
16062.600 |
16916.200 |
6.000 |
|
Total Current Liabilities (4) |
33096.800 |
26537.000 |
13448.000 |
|
|
|
|
|
|
TOTAL |
442054.300 |
382415.900 |
332656.600 |
|
|
|
|
|
|
II.
ASSETS |
|
|
|
|
(1) Non-current assets |
|
|
|
|
(a) Fixed Assets |
|
|
|
|
(i) Tangible assets |
49668.300 |
47760.200 |
25.700 |
|
(ii) Intangible Assets |
391.800 |
359.600 |
0.000 |
|
(iii) Capital
work-in-progress |
17691.000 |
15217.300 |
540.300 |
|
(iv)
Intangible assets under development |
10222.600 |
3795.100 |
0.000 |
|
(b) Non-current Investments |
160382.500 |
160382.500 |
308534.600 |
|
(c) Deferred tax assets (net) |
0.000 |
0.000 |
0.000 |
|
(d) Long-term Loan and Advances |
37380.300 |
23932.100 |
1.600 |
|
(e) Other Non-current assets |
3473.500 |
2235.600 |
35.400 |
|
Total Non-Current Assets |
279210.000 |
253682.400 |
309137.600 |
|
|
|
|
|
|
(2) Current assets |
|
|
|
|
(a) Current investments |
135361.700 |
103720.200 |
18213.400 |
|
(b) Inventories |
1632.600 |
1070.400 |
0.000 |
|
(c) Trade receivables |
14993.000 |
11695.400 |
4.700 |
|
(d) Cash and cash
equivalents |
1708.500 |
1510.500 |
4600.000 |
|
(e) Short-term loans and
advances |
8492.100 |
8862.600 |
588.600 |
|
(f) Other current assets |
656.400 |
1874.400 |
112.300 |
|
Total Current Assets |
162844.300 |
128733.500 |
23519.000 |
|
|
|
|
|
|
TOTAL |
442054.300 |
382415.900 |
332656.600 |
PROFIT & LOSS
ACCOUNT
|
|
PARTICULARS |
31.03.2014 |
31.03.2013 |
31.03.2012 |
|
|
|
SALES |
|
|
|
|
|
|
|
Revenue from operations |
99275.300 |
92009.800 |
88.000 |
|
|
|
Other Income |
19016.400 |
8996.700 |
2401.300 |
|
|
|
TOTAL |
118291.700 |
101006.500 |
2489.300 |
|
|
|
|
|
|
|
|
Less |
EXPENSES |
|
|
|
|
|
|
|
Cess on crude oil |
14595.700 |
14157.500 |
0.000 |
|
|
|
Share of expenses from producing oil and gas blocks |
6584.100 |
4855.900 |
0.000 |
|
|
|
Change in inventories of finished goods |
(98.700) |
(140.600) |
0.000 |
|
|
|
Employees benefits expense |
2728.100 |
960.400 |
153.800 |
|
|
|
Other expenses |
3031.000 |
2757.400 |
566.900 |
|
|
|
Exploration costs written off |
1814.900 |
682.800 |
178.800 |
|
|
|
TOTAL |
28655.100 |
23273.400 |
899.500 |
|
|
|
|
|
|
|
|
|
PROFIT/
(LOSS) BEFORE INTEREST, TAX,
DEPRECIATION AND AMORTISATION |
89636.600 |
77733.100 |
1589.800 |
|
|
|
|
|
|
|
|
|
Less |
FINANCIAL
EXPENSES |
64.500 |
664.100 |
1114.500 |
|
|
|
|
|
|
|
|
|
|
PROFIT
/ (LOSS) BEFORE TAX, DEPRECIATION AND AMORTISATION |
89572.100 |
77069.000 |
475.300 |
|
|
|
|
|
|
|
|
|
Less/ Add |
DEPRECIATION/
AMORTISATION |
11817.600 |
9618.000 |
0.300 |
|
|
|
|
|
|
|
|
|
|
PROFIT/
(LOSS) BEFORE TAX |
77754.500 |
67451.000 |
475.000 |
|
|
|
|
|
|
|
|
|
Less |
TAX |
3211.200 |
2644.500 |
35.400 |
|
|
|
|
|
|
|
|
|
|
Profit
for the year before impact of scheme of arrangement relating to earlier
periods |
74543.300 |
64806.500 |
439.600 |
|
|
|
|
|
|
|
|
|
Add |
Impact of scheme of
arrangement relating to earlier periods |
0.000 |
82661.200 |
0.000 |
|
|
|
|
|
|
|
|
|
|
PROFIT/
(LOSS) AFTER TAX |
74543.300 |
147467.700 |
439.600 |
|
|
|
|
|
|
|
|
|
Add |
PREVIOUS
YEARS’ BALANCE BROUGHT FORWARD |
89530.800 |
(3354.300) |
(3354.300) |
|
|
|
|
|
|
|
|
|
Less |
APPROPRIATIONS |
|
|
|
|
|
|
|
Proposed final equity dividend [amount per share Rs.6.50] |
12399.600 |
12416.500 |
0.000 |
|
|
|
Tax on proposed equity dividend |
2203.300 |
2014.300 |
0.000 |
|
|
|
Interim equity dividend [amount per share Rs.5 |
11463.900 |
9548.800 |
0.000 |
|
|
|
Tax on interim dividend |
1948.200 |
1549.100 |
0.000 |
|
|
|
Transfer from/(to) debenture redemption reserve |
0.000 |
(439.600) |
439.600 |
|
|
|
Transfer to general reserve |
7454.300 |
29493.500 |
0.000 |
|
|
BALANCE CARRIED
TO THE B/S |
128604.800 |
89530.800 |
(3354.300) |
|
|
|
|
|
|
|
|
|
|
EARNINGS IN
FOREIGN CURRENCY |
|
|
|
|
|
|
|
Revenue from operations |
99275.300 |
92009.800 |
88.000 |
|
|
|
Interest income on bank deposits |
0.000 |
605.100 |
0.000 |
|
|
TOTAL EARNINGS |
99275.300 |
92614.900 |
88.000 |
|
|
|
|
|
|
|
|
|
|
IMPORTS |
|
|
|
|
|
|
|
Stores & Spares |
830.400 |
454.200 |
50.600 |
|
|
TOTAL IMPORTS |
830.400 |
454.200 |
50.600 |
|
|
|
|
|
|
|
|
|
|
Earnings /
(Loss) Per Share (Rs.) |
|
|
|
|
|
|
Basic |
39.03 |
33.95 |
0.23 |
|
|
|
Diluted |
38.95 |
33.90 |
0.23 |
|
KEY RATIOS
|
PARTICULARS |
|
31.03.2014 |
31.03.2013 |
31.03.2011 |
|
Net Profit Margin (PAT/Sales) |
(%) |
63.02 |
146.00 |
17.66 |
|
|
|
|
|
|
|
Operating Profit Margin (PBDIT / Sales) |
(%) |
90.29 |
84.48 |
1806.59 |
|
|
|
|
|
|
|
Return on Total Assets (PBT/Total Assets} |
(%) |
30.64 |
33.22 |
2.01 |
|
|
|
|
|
|
|
Return on Investment (ROI) (PBT/Networth) |
|
0.20 |
0.20 |
0.00 |
|
|
|
|
|
|
|
Current Ratio (Current Asset/Current Liability) |
|
4.92 |
4.85 |
1.75 |
FINANCIAL ANALYSIS
[all figures are in
Rupees Millions]
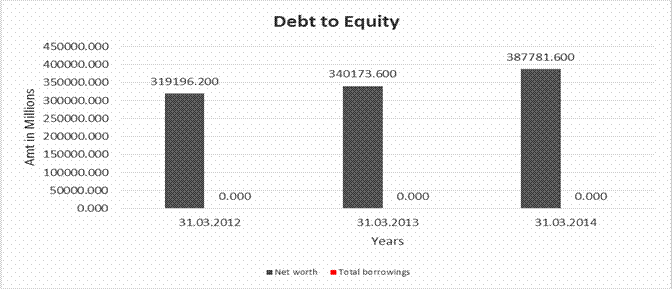
DEBT EQUITY RATIO
|
Particular |
31.03.2012 |
31.03.2013 |
31.03.2014 |
|
|
(Rs.
In Millions) |
(Rs.
In Millions) |
(Rs.
In Millions) |
|
Share Capital |
19074.000 |
19102.400 |
19076.300 |
|
Reserves & Surplus |
300122.200 |
321071.200 |
368705.300 |
|
Net
worth |
319196.200 |
340173.600 |
387781.600 |
|
|
|
|
|
|
long-term borrowings |
0.000 |
0.000 |
0.000 |
|
Short term borrowings |
0.000 |
0.000 |
0.000 |
|
Total
borrowings |
0.000 |
0.000 |
0.000 |
|
Debt/Equity
ratio |
0.000 |
0.000 |
0.000 |
YEAR-ON-YEAR GROWTH
|
Year
on Year Growth |
31.03.2012 |
31.03.2013 |
31.03.2014 |
|
|
(Rs.
In Millions) |
(Rs.
In Millions) |
(Rs.
In Millions) |
|
Sales |
88.000 |
92009.800 |
99275.300 |
|
|
|
104,456.591 |
7.896 |

NET PROFIT MARGIN
|
Net
Profit Margin |
31.03.2012 |
31.03.2013 |
31.03.2014 |
|
|
(Rs.
In Millions) |
(Rs.
In Millions) |
(Rs.
In Millions) |
|
Sales |
88.000 |
92009.800 |
99275.300 |
|
Profit |
439.600 |
147467.700 |
74543.300 |
|
|
499.55% |
160.27% |
75.09% |

LOCAL AGENCY FURTHER INFORMATION
Current Maturity
of Long Term Debt = Not Available
|
Sr. No. |
Check List by Info Agents |
Available in
Report (Yes / No) |
|
1] |
Year of Establishment |
Yes |
|
2] |
Locality of the firm |
Yes |
|
3] |
Constitutions of the firm |
Yes |
|
4] |
Premises details |
No |
|
5] |
Type of Business |
Yes |
|
6] |
Line of Business |
Yes |
|
7] |
Promoter's background |
No |
|
8] |
No. of employees |
Yes |
|
9] |
Name of person contacted |
No |
|
10] |
Designation of contact
person |
No |
|
11] |
Turnover of firm for last
three years |
Yes |
|
12] |
Profitability for last
three years |
Yes |
|
13] |
Reasons for variation
<> 20% |
----- |
|
14] |
Estimation for coming financial
year |
No |
|
15] |
Capital in the business |
Yes |
|
16] |
Details of sister
concerns |
Yes |
|
17] |
Major suppliers |
No |
|
18] |
Major customers |
No |
|
19] |
Payments terms |
No |
|
20] |
Export / Import details
(if applicable) |
No |
|
21] |
Market information |
----- |
|
22] |
Litigations that the firm
/ promoter involved in |
----- |
|
23] |
Banking Details |
Yes |
|
24] |
Banking facility details |
No |
|
25] |
Conduct of the banking
account |
----- |
|
26] |
Buyer visit details |
----- |
|
27] |
Financials, if provided |
Yes |
|
28] |
Incorporation details, if
applicable |
Yes |
|
29] |
Last accounts filed at
ROC |
Yes |
|
30] |
Major Shareholders, if
available |
Yes |
|
31] |
Date of Birth of
Proprietor/Partner/Director, if available |
No |
|
32] |
PAN of
Proprietor/Partner/Director, if available |
No |
|
33] |
Voter ID No of
Proprietor/Partner/Director, if available |
No |
|
34] |
External Agency Rating,
if available |
Yes |
INDEX OF CHARGES: NO CHARGES
EXIST FOR THE COMPANY
NATURE OF OPERATIONS
1. NATURE OF
OPERATIONS
Cairn
India Limited (‘the Company’) was incorporated in India on August 21, 2006. The
equity shares of the Company are listed in India on the Bombay stock exchange
and the National stock exchange.
The
Company is primarily engaged in the business of surveying, prospecting,
drilling, exploring, acquiring, developing, producing, maintaining, refining,
storing, trading, supplying, transporting, marketing, distributing, importing,
exporting and generally dealing in minerals, oils, petroleum, gas and related
by-products and other activities incidental to the above. As part of its
business activities, the Company also holds interests in its subsidiary
companies which have been granted rights to explore and develop oil exploration
blocks.
The
Company along with its subsidiaries, participates in various Oil and Gas
blocks/fields, which are in the nature of jointly controlled assets, granted by
the Government of India/Sri Lanka/South Africa through Production Sharing
Contract (‘PSC’)/ Production Resources Agreement (‘PRA’) entered into between
these entities and Government of India/Sri Lanka/South Africa and other venture
partners.
COMPANY’S
PERFORMANCE
During the year, Cairn
India delivered highest revenue of INR 187617.000 millions. This was driven by
robust production growth of 6% year on year, with gross operated average
production at 218,651 barrels of oil equivalent for the fiscal. During the
year, the Rajasthan block achieved a landmark oil production of 200 million
barrels and a 200,000 boepd production milestone in March 2014 by combining a
world class asset with proven technical expertise and disciplined approach to
execution. The production increase has helped to reduce the India’s crude oil
import dependence and strengthen the energy security of the country. Currently,
Cairn contributes about 30% to India’s domestic crude oil production as per
MoPNG’s March 2014 statistics. The Company continues to be one of the low cost
producers in the world resulting in EBITDA margin of 74% and strong cash flow
from operations of INR 110927.600 millions for the year.
Since resumption
of exploration in 2013, Cairn India has established over 1 billion boe in-place
resources by delivering a rapid exploration and appraisal drilling program. The
Company continues to focus on exploration in prolific Rajasthan block, execute
multiple projects including one of the world’s largest polymer flood EOR
programme at Mangala for future growth.
AWARDS AND
RECOGNITIONS
During the year,
the Company earned a number of awards and honours from different bodies and
trade organisation, the summary of which is as under:
Ø FICCI Corporate
Social Responsibility Award – 2013 under ‘Category: Private Sector Companies
with INR 3,001 crore per annum and above turnover’.
Ø With a three-year
CAGR of 121%, Cairn India Ltd was named as the world’s fastest growing energy
company, for the second year in a row, in the Platts Top 250 Global Energy
Company Rankings 2013.
Ø Government of
Gujarat awarded the certificate of recognition in honour of Project Shrishti
(Green initiative by plantation, gardening and park for public) at Nalsarovar
Bird Sanctuary, Ramsar Site in the year 2013.
Ø Cairn India was
conferred the ET Now Talent Leadership Conference and Awards 2013 under two
categories for the most ‘Innovative HR practices’ and for ‘Best Talent
Management Strategy’.
Ø Cairn India’s
Mangala Oil and Gas Field unit won the Second prize in the large scale
manufacturer category at the 3rd FICCI Safety Systems Excellence Awards for
Manufacturing, 2013.
STATEMENT OF
STANDALONE UNAUDITED RESULTS FOR THE QUARTER AND SIX MONTHS ENDED 30 SEPTEMBER
2014
|
Sr. No |
Particulars |
Standalone |
||
|
Quarter Ended |
||||
|
30.09.2014 |
30.06.2014 |
|||
|
Unaudited |
Unaudited |
|||
|
1 |
Income From
Operations |
|
|
|
|
|
a. Net Sales/ Income from Operations (Net of Excise Duty) |
21194.300 |
23754.100 |
|
|
|
b. Other Operating Income |
-- |
-- |
|
|
|
Total Income from Operations
(Net) |
21194.300 |
23754.100 |
|
|
2 |
Expenditure |
|
|
|
|
|
a. Share of expenses in producing oil and gas blocks |
2546.900 |
1851.400 |
|
|
|
b.Changes in inventory of finished Goods, work- in-progress and Stock-in-trade |
(182.400) |
(11.900) |
|
|
|
c. Employees Benefit Expenses |
67.200 |
400.400 |
|
|
|
d. Depreciation and Amortisation Expenses |
3677.600 |
3703.300 |
|
|
|
e. Other expenses |
931.600 |
718.200 |
|
|
|
f.Cess |
3305.800 |
3669.800 |
|
|
|
g.Exploration costs written off |
636.000 |
1887.300 |
|
|
|
Total Expenses |
10982.700 |
12218.500 |
|
|
3 |
Profit from
Operations before Other Income, Interest and Exceptional Items |
10211.600 |
11535.600 |
|
|
4 |
Other Income |
2552.800 |
3551.400 |
|
|
|
Foreign exchange fluctuation gain/(loss)-net |
311.100 |
342.700 |
|
|
5 |
Profit from
ordinary activities before finance cost & exceptional items |
13075.500 |
15429.700 |
|
|
6 |
Finance Costs |
18.600 |
11.300 |
|
|
7 |
Profit from ordinary
activities after finance costs & exceptional items |
13056.900 |
15418.400 |
|
|
8 |
Exceptional items |
-- |
8193.100 |
|
|
9 |
Profit from
ordinary activities before tax |
|
|
|
|
10 |
Tax Expense |
|
|
|
|
|
a) Current tax |
2642.200 |
3147.900 |
|
|
|
b) MAT credit entitlement |
(2537.300) |
(3147.900) |
|
|
|
c) Deferred tax charge |
1301.900 |
787.200 |
|
|
11 |
Net Profit from
ordinary activity after tax |
11650.100 |
6438.100 |
|
|
12 |
Extraordinary Items |
-- |
-- |
|
|
13 |
Net Profit After
Tax |
11650.100 |
6438.100 |
|
|
14 |
Paid-up equity share capital (face value of Rs.10 per share) |
1874.75 |
1874.20 |
|
|
15 |
Reserves excluding Revaluation Reserve as per balance sheet of previous accounting Year |
-- |
-- |
|
|
16 |
Earning Per Share (of Rs.10 each) (not annualized) |
|
|
|
|
|
Basic EPS |
6.22 |
3.41 |
|
|
|
Diluted EPS |
6.19 |
3.40 |
|
|
A |
PARTICULARS OF
SHAREHOLDING |
|
|
|
|
17 |
Public Shareholding |
|
|
|
|
|
- No. of shares |
752039.071 |
751482.582 |
|
|
|
- Percentage of shareholding |
40.11% |
40.10% |
|
|
18 |
Promoter &
Promoter Group Shareholding |
|
|
|
|
|
a)
Pledged/Encumbered |
|
|
|
|
|
- No. of shares |
738873.586 |
738873.586 |
|
|
|
- Percentage of shareholding (as a % of the total shareholding of promoter and promoter group) |
65.81% |
65.81% |
|
|
|
- Percentage of shareholding (as a % of the total share capital of the company) |
39.41% |
39.42% |
|
|
|
b) Non-encumbered |
|
|
|
|
|
- No. of shares |
383840.413 |
383840.413 |
|
|
|
- Percentage of shareholding (as a % of the total shareholding of promoter and promoter group) |
34.19% |
34.19% |
|
|
|
- Percentage of shareholding (as a % of the total share capital of the company) |
20.47% |
20.48% |
|
Twin Star Energy Holdings Limited holds 100%
in Twin Star Mauritius Holding Limited which in turn holds 738873.586 number of
shares in Cairn India Limited has pledged its entire holding TSMHL.
|
|
Particulars |
Quarter ended 30.09.2014 |
|
B |
Investor Complaints |
|
|
|
Pending at the beginning of the quarter |
-- |
|
|
Received during the quarter |
253 |
|
|
Disposed off during the quarter |
252 |
|
|
Remaining unresolved at the end of the quarter |
1* |
STANDALONE
STATEMENT OF ASSETS AND LIABILITIES
|
Particulars |
As at 30.09.2014 (Unaudited) |
As at 31.03.2014 (Unaudited) |
|
|
A |
EQUITY AND LIABILITIES |
|
|
|
1 |
Shareholders' Funds |
|
|
|
|
(a) Share Capital |
18747.500 |
19076.300 |
|
|
(b) Reserves & Surplus |
365462.200 |
368705.300 |
|
|
Total
Shareholders’ Funds |
384209.700 |
387781.600 |
|
|
|
|
|
|
2 |
Non-Current
Liabilities |
|
|
|
|
(a) long-term borrowings |
|
|
|
|
(b) Deferred tax liabilities (Net) |
4047.700 |
4229.400 |
|
|
(c) Other long term liabilities |
|
|
|
|
(d) long-term provisions |
18398.600 |
16946.500 |
|
|
Sub Total Non-current Liabilities |
22446.300 |
21175.900 |
|
|
|
|
|
|
3 |
Current Liabilities |
|
|
|
|
(a) Short term borrowings |
|
|
|
|
(b) Trade payables |
5557.100 |
5016.900 |
|
|
(c) Other current
liabilities |
26470.300 |
12031.700 |
|
|
(d) Short-term provisions |
2384.700 |
16062.600 |
|
|
Sub
Total Current Liabilities |
34412.100 |
33111.200 |
|
|
|
|
|
|
|
TOTAL |
441077.200 |
442068.700 |
|
|
|
|
|
|
A |
ASSETS |
|
|
|
1 |
Non-current assets |
|
|
|
|
(a) Fixed Assets |
77711.600 |
77973.700 |
|
|
(b) Non-current Investments |
160394.600 |
160382.500 |
|
|
(c) Long-term Loan and Advances |
41493.000 |
37380.300 |
|
|
(d) Other Non-current assets |
4350.200 |
3473.500 |
|
|
Sub Total Non-Current Assets |
283949.400 |
279210.000 |
|
|
|
|
|
|
2 |
Current assets |
|
|
|
|
(a) Current investments |
113546.000 |
135361.700 |
|
|
(b) Inventories |
1925.000 |
1632.600 |
|
|
(c) Trade receivables |
12175.600 |
14993.000 |
|
|
(d) Cash and cash
equivalents |
6096.900 |
1722.900 |
|
|
(e) Short-term loans
and advances |
22284.000 |
8492.100 |
|
|
(f) Other current
assets |
1100.300 |
656.400 |
|
|
Sub Total Current
Assets |
157127.800 |
162858.700 |
|
|
|
|
|
|
|
TOTAL-ASSETS |
441077.200 |
442068.700 |
PRESS RELEASE
Cairn
Polymer flooding, also known as chemical flooding or chemical EOR, is one of the preferred EOR
technologies used for improving oil recovery - particularly in older and
declining oil wells/oil reservoirs. In polymer flooding, polymer (or polymers)
is used to make the water injected into the injection well oil reservoirs more
viscous or thick like a gel. This greatly enhances oil production, and is
particularly beneficial in heavy oil recovery.
“Cairn India had recognised the potential for chemical EOR at an early stage of
development in its Mangala, Bhagyam and Aishwariya (MBA) fields. The reservoir
quality, oil properties and ambient temperature make these fields ideal for the
application of chemical flooding EOR methods such as polymer or alkaline
surfactant polymer (ASP) flooding. The chemical EOR programme has a potential
to enhance recoveries from the Mangala, Bhagyam and Aishwariya fields by around
300 mmbbls,” the release added.
The Mangala ASP pilot programme, the next phase of EOR has also yielded
excellent results so far, suggesting better mobilisation of oil post polymer
flooding.
Sudhir Mathur CFO, Cairn India, said, “Injecting the polymer at our world class
polymer flood EOR project, ahead of schedule is a testament to our execution
skills and team work. This will enable us to further unlock the potential of
the prolific Rajasthan block and help contribute significantly towards the
nation’s energy security.”
CAIRN INDIA TO SPEND $1BN ON BUYBACK: REPORT
Cairn India , oil and gas unit of London-listed Vedanta Resources, is set
to spend about USD 1 billion to buy back shares, Bloomberg reported on Sunday
citing two people familiar with the matter.
The share purchase will include
buying back Cairn Energy Plc's 10.3 percent stake in the company, Bloomberg
said citing one of the sources.
Mining conglomerate Vedanta, controlled by billionaire Anil Agarwal,
acquired a majority stake in Cairn India for almost USD 9 billion in 2011.
Since then, Cairn India played a pivotal role in boosting revenue and
production even as Vedanta's mining business in India faced regulatory hurdles
and mining restrictions.
The plan may help Sesa Sterlite and Agarwal's other subsidiaries
increase ownership in Cairn India to more than 65 percent from 59 percent, the
source told Bloomberg.
Cairn India's board is expected to meet on November 26 to consider a
buyback.
Vedanta and Cairn Energy could not immediately be reached for a comment
outside regular business hours.
Earlier this month, Vedanta said Cairn India was on track to hit its
2014 production target, previously put at 225,000 barrels of oil equivalent per
day.
Buoyed
by discoveries of huge quantities of oil and gas, Cairn India has urged the
Director General of Hydrocarbons to declare one of the wells in its onshore
KG-ONN-2003/1 block at Nagayalanka on East coast as 'Commercial Discovery',
sources close to the development said. Once the DGH approval comes, the JV will
invest USD 700-750 million over 3-5 years on the Block. The investment includes
creation of necessary infrastructure and production, sources said.
Also read: Oil and gas
Pillars of the energy sector
The Cairn-ONGC JV recently wrote a letter to DGH saying that 'Field
Development Plan' will also be submitted soon in this regard.
"As per the Declaration of
Commerciality (DoC) documents submitted to the DGH, the Cairn-ONGC JV has
in-place oil resources of about 320 million barrels, of which about 40 million
barrels can be recovered (from the Block). It has also found small amounts of
gas with recoverable reserves of around 70 billion cubic feet (bcf) of
gas," sources told PTI.
"The investment (USD 700-750
million) will spread across 3-5 years. It will be spent on creating of
necessary infrastructure, production facilities and transportation,"
sources said.
Cairn had earlier confirmed that
in its onshore KG-ONN-2003/1 block, post three successful fracs, the
productivity of one of the appraisal wells, Nagayalanka-1z-ST has increased
three-fold and that has significantly improved the commerciality of the
discovery.
It may be recollected that the well was spudded (the process of
beginning to drill a well) in the previous quarter to evaluate the size and
commerciality of the discovery Nagayalanka-SE-1 within which two well appraisal
programme had been approved by the JV partner.
The second appraisal well
Nagayalanka-NW-A is planned to be drilled towards the North West to evaluate
the reservoir extent, sources added.
Industry experts feel that since the Block is an onshore find, the investments
will be lower in comparison to off-shore ones which make the threshold for
commerciality lower.
Exploration activities have been
conducted on the KG-ONN-2003/1 Block as per the Production Sharing Contract in
February 2007, including 2D and 3D seismic acquisition, processing,
re-processing, interpretation and drilling which to the present date has
resulted in the Nagayalanka-1z and Nagayalanka-SE-1 discovery.
During Phase-I of the PSC Exploration Period, five exploration wells
were drilled and the Nagayalanka-1z well resulted in the Raghavapuram
discovery.
In Phase-II of the PSC
Exploration Period, the Nagayalanka-SE-1 exploration well was drilled and
resulted in a discovery of hydrocarbons in the Golapalli.
CAIRN INDIA: the odd man out
Carin India Limited announced three new oil discoveries in its Rajasthan
block on Wednesday. Of course, new discoveries are positive but the exact
benefits of the development will be known at a later stage. The Cairn India
stock went up by 1.4% on Wednesday on a day when the benchmark Sensex inched up
0.52%.
It’s quite possible that
investors were pleased with the interim dividend of Rs.5 per share
announcement, which was pretty much on expected lines, given the concerns on
cash utilization for this company. Investors would do well to recall the Street
was extremely disappointed when the company told analysts in the June quarter
earnings call about lending $1.25 billion to a subsidiary of Sesa Sterlite Ltd.
But other than that, there is another worry for Cairn India. At a time
when lower crude oil prices have offered a solid reason for Indian oil stocks
to be in fashion, Cairn India is the odd man out. The company’s price
realizations typically follow the trend in the crude price movement. That means
lower crude prices is equal to lower price realizations for Cairn India and
vice versa.
Analysts maintain that the company could very well report a sequential
decline in its realizations in the September quarter. The company’s
realizations are at a discount to Brent crude. Cairn India’s average price
realization for the June quarter stood at $97 per barrel of oil equivalent.
That’s an important factor for investors to keep a tab on in the days to come.
A weak outlook for crude oil prices hardly offers much comfort.
And then, there are concerns on production ramp-up. “After March-14 exit
of 200,000 barrels per day (bpd), Rajasthan (block) production is down to
~183000 bpd and hence long-term guidance 7-10% CAGR now looks challenging,”
pointed out Motilal Oswal Securities Ltd in its June quarter results review.
Not surprisingly, Cairn India’s shareholders are unhappy. So far this
fiscal year, while the S&P BSE Oil and Gas index has increased by 16%, the
Cairn India stock has declined 2.5%.
FIXED ASSETS
·
Freehold Land
·
Buildings
·
Office Equipment’s
·
Furniture and Fittings
·
Vehicles
·
Computer Software
CMT REPORT (Corruption, Money Laundering & Terrorism]
The Public Notice information has been collected from various sources
including but not limited to: The Courts,
1] INFORMATION ON
DESIGNATED PARTY
No exist designating subject or any of its beneficial owners,
controlling shareholders or senior officers as terrorist or terrorist organization
or whom notice had been received that all financial transactions involving
their assets have been blocked or convicted, found guilty or against whom a
judgement or order had been entered in a proceedings for violating
money-laundering, anti-corruption or bribery or international economic or
anti-terrorism sanction laws or whose assets were seized, blocked, frozen or
ordered forfeited for violation of money laundering or international
anti-terrorism laws.
2] Court Declaration :
No records exist to suggest that subject is
or was the subject of any formal or informal allegations, prosecutions or other
official proceeding for making any prohibited payments or other improper
payments to government officials for engaging in prohibited transactions or
with designated parties.
3] Asset Declaration :
No records exist to suggest that the property or assets of the subject
are derived from criminal conduct or a prohibited transaction.
4] Record on Financial
Crime :
Charges or conviction
registered against subject: None
5] Records on Violation of
Anti-Corruption Laws :
Charges or
investigation registered against subject: None
6] Records on Int’l
Anti-Money Laundering Laws/Standards :
Charges or
investigation registered against subject: None
7] Criminal Records
No
available information exist that suggest that subject or any of its principals
have been formally charged or convicted by a competent governmental authority
for any financial crime or under any formal investigation by a competent government
authority for any violation of anti-corruption laws or international anti-money
laundering laws or standard.
8] Affiliation with
Government :
No record
exists to suggest that any director or indirect owners, controlling
shareholders, director, officer or employee of the company is a government
official or a family member or close business associate of a Government
official.
9] Compensation Package :
Our market
survey revealed that the amount of compensation sought by the subject is fair
and reasonable and comparable to compensation paid to others for similar
services.
10] Press Report :
No press reports / filings exists on
the subject.
CORPORATE GOVERNANCE
MIRA INFORM as part of its Due Diligence do provide comments on
Corporate Governance to identify management and governance. These factors often
have been predictive and in some cases have created vulnerabilities to credit
deterioration.
Our Governance Assessment focuses principally on the interactions between
a company’s management, its Board of Directors, Shareholders and other
financial stakeholders.
CONTRAVENTION
Subject is not known to have contravened any existing local laws,
regulations or policies that prohibit, restrict or otherwise affect the terms
and conditions that could be included in the agreement with the subject.
FOREIGN EXCHANGE RATES
|
Currency |
Unit
|
Indian Rupees |
|
US Dollar |
1 |
Rs.61.85 |
|
|
1 |
Rs.97.01 |
|
Euro |
1 |
Rs.77.62 |
INFORMATION DETAILS
|
Information
Gathered by : |
HTL |
|
|
|
|
Analysis Done by
: |
SUB |
|
|
|
|
Report Prepared
by : |
ART |
SCORE & RATING EXPLANATIONS
|
SCORE FACTORS |
RANGE |
POINTS |
|
HISTORY |
1~10 |
9 |
|
PAID-UP CAPITAL |
1~10 |
8 |
|
OPERATING SCALE |
1~10 |
9 |
|
FINANCIAL
CONDITION |
|
|
|
--BUSINESS SCALE |
1~10 |
9 |
|
--PROFITABILIRY |
1~10 |
9 |
|
--LIQUIDITY |
1~10 |
9 |
|
--LEVERAGE |
1~10 |
9 |
|
--RESERVES |
1~10 |
9 |
|
--CREDIT LINES |
1~10 |
9 |
|
--MARGINS |
-5~5 |
-- |
|
DEMERIT POINTS |
|
|
|
--BANK CHARGES |
YES/NO |
NO |
|
--LITIGATION |
YES/NO |
NO |
|
--OTHER ADVERSE INFORMATION |
YES/NO |
NO |
|
MERIT POINTS |
|
|
|
--SOLE DISTRIBUTORSHIP |
YES/NO |
NO |
|
--EXPORT ACTIVITIES |
YES/NO |
NO |
|
--AFFILIATION |
YES/NO |
YES |
|
--LISTED |
YES/NO |
YES |
|
--OTHER MERIT FACTORS |
YES/NO |
YES |
|
DEFAULTER
|
|
|
|
--RBI |
YES/NO |
NO |
|
--EPF |
YES/NO |
NO |
|
TOTAL |
|
80 |
This score serves as a reference to assess SC’s credit risk and
to set the amount of credit to be extended. It is calculated from a composite
of weighted scores obtained from each of the major sections of this report. The
assessed factors and their relative weights (as indicated through %) are as
follows:
Financial
condition (40%) Ownership
background (20%) Payment
record (10%)
Credit history
(10%) Market trend
(10%) Operational
size (10%)
RATING EXPLANATIONS
|
RATING |
STATUS |
PROPOSED CREDIT LINE |
|
|
>86 |
Aaa |
Possesses an extremely sound financial base with the strongest
capability for timely payment of interest and principal sums |
Unlimited |
|
71-85 |
Aa |
Possesses adequate working capital. No caution needed for credit
transaction. It has above average (strong) capability for payment of interest
and principal sums |
Large |
|
56-70 |
A |
Financial & operational base are regarded healthy. General
unfavourable factors will not cause fatal effect. Satisfactory capability for
payment of interest and principal sums |
Fairly Large |
|
41-55 |
Ba |
Overall operation is considered normal. Capable to meet normal
commitments. |
Satisfactory |
|
26-40 |
B |
Capability to overcome financial difficulties seems comparatively below
average. |
Small |
|
11-25 |
Ca |
Adverse factors are apparent. Repayment of interest and principal sums
in default or expected to be in default upon maturity |
Limited with
full security |
|
<10 |
C |
Absolute credit risk exists. Caution needed to be exercised |
Credit not
recommended |
|
-- |
NB |
New Business |
-- |
This report is issued at your request without any
risk and responsibility on the part of MIRA INFORM PRIVATE LIMITED (MIPL)
or its officials.