MIRA
INFORM REPORT
|
Report Date : |
24.11.2014 |
IDENTIFICATION DETAILS
|
Name : |
STAR FABRICS |
|
|
|
|
Registered
Office : |
10, 3rd Floor, Madhav Industries, Kapodra, |
|
|
|
|
Country : |
|
|
|
|
|
Financials (as
on) : |
20.10.2014 [Provisional] |
|
|
|
|
Date of
Establishment : |
27.07.2009 |
|
|
|
|
Capital
Investment : |
Rs. 3.140 Millions |
|
|
|
|
IEC No.: |
5209049302 |
|
|
|
|
PAN No.: [Permanent Account No.] |
AMLPR4470L |
|
|
|
|
Legal Form : |
Sole Proprietary Concern |
|
|
|
|
Line of Business
: |
Manufacturer of Art Silk Grey Cloth. |
|
|
|
|
No. of Employees
: |
6 (Approximately) |
RATING & COMMENTS
|
MIRA’s Rating : |
B (30) |
|
RATING |
STATUS |
PROPOSED CREDIT LINE |
|
|
26-40 |
B |
Capability to overcome financial difficulties seems comparatively
below average. |
Small |
|
Status : |
Small Concern |
|
|
|
|
Payment Behaviour : |
Slow but correct |
|
|
|
|
Litigation : |
Clear |
|
|
|
|
Comments : |
Subject is a small proprietary concern in its field. Its scale of
activities are limited. However, trade relations are reported to be fair. Business is active.
Payment terms are reported to be slow but correct. The concern can be considered for small to medium business dealings
with some caution. |
NOTES :
Any query related to this report can be made
on e-mail : infodept@mirainform.com
while quoting report number, name and date.
ECGC Country Risk Classification List – June 1, 2014
|
Country Name |
Previous Rating (31.03.2014) |
Current Rating (01.06.2014) |
|
|
A1 |
A1 |
|
Risk Category |
ECGC
Classification |
|
Insignificant |
A1 |
|
Low |
A2 |
|
Moderate |
B1 |
|
High |
B2 |
|
Very High |
C1 |
|
Restricted |
C2 |
|
Off-credit |
D |
INDIAN ECONOMIC OVERVIEW
N E W S
Verdict Implications
: Apex court order may alter coal import dynamics. Traders go slow on talks over
coal supply contracts, uncertainty over cancellation of blocks weigh on stocks.
Recent arrest of the
Chennai head of the Registrar of Companies, the ministry of corporate affairs
arm that ensures that companies file all the information required by the
Companies Act is the latest manifestation of a messy fight between a father and
his adopted son for the control of Rs 40000 mn business empire. The Central
Bureau of Investigation arrested Manumeethi Cholan after he accepted Rs 10
lakhs as bribe from M A M Ramaswamy, a CBI official said.
Central Bureau of
Investigation books Electrotherm for cheating Central Bank of Rs 4360 mn.
Infosys maintains
revenue guidance. COO Rao says attrition still an area of concern and it would take
a few more quarters to bring down levels to 13-15 %.
DHL to invest Euro
100 mn in India over next 2 years. The firm has chosen India to pilot its
e-commerce business model for the Asia-Pacific region.
Blackstone may buy
stake in BlueRidge SEZ in line with the fund’s real estate strategy in India.
Kingfisher Airlines
Ltd grounded in October 2012 under the weight of heavy debt and accumulated
losses, recently approached the Delhi high court for relief in two separate
cases. The airline challenged a notice by Punjab & National Bank alleging
that it had willfully defaulted on Rs 7700 mn of loans and sought more time to
comply with the requirements under the listing agreements with the Stock
Exchanges.
OnMobile likely to sack another 300 employees. The
lay-offs follow a spate of senior-level exits over the past two years, starting
with of its founder. The overall lay-offs could number around 600 and are
driven by the need to cut costs, says a former employee.
EXTERNAL AGENCY RATING
NOT AVAILABLE
RBI DEFAULTERS’ LIST STATUS
Subject’s name is not enlisted as a defaulter
in the publicly available RBI Defaulters’ list.
EPF (Employee Provident Fund) DEFAULTERS’ LIST STATUS
Subject’s name is not enlisted as a defaulter in
the publicly available EPF (Employee Provident Fund) Defaulters’ list as of
31-03-2014.
INFORMATION PARTED BY
|
Name : |
Mr. Shivlal U. Rajani |
|
Designation : |
Chief Executive Officer |
|
Contact No.: |
91-9925015923 |
|
Date : |
21.11.2011 |
LOCATIONS
|
Registered Office/ Factory 1 : |
10, 3rd Floor, Madhav Industries, Kapodra, Surat – 395006, Gujarat,
India |
|
Tel. No.: |
Not Available |
|
Mobile No.: |
91-9033022023 [Mrs. Chandrika Shivlal Rajani] 91-9925015923 [Mr. Shivlal U. Rajani] |
|
Fax No.: |
Not Available |
|
E-Mail : |
|
|
Location : |
Rented |
|
|
|
|
Factory 2 : |
Plot No. P-38, Sayan Textile Park, SITP-3, Hazira Adajan Road, Ichhapore,
Surat – 394510, Gujarat, India |
|
Area : |
3348.80 Sq. ft. |
|
Location : |
Owned |
SOLE PROPRIETOR
|
Name : |
Mrs. Chandrika Shivlal Rajani |
|
Designation : |
Proprietor |
|
Address : |
5, Ekta Row House, Near Lajamni Chowk, Mota, Varachha, Surat - 394110,
Gujarat, India |
|
Date of Birth/Age : |
01.06.1981 |
|
PAN No.: |
AMLPR4470L |
KEY EXECUTIVES
|
Name : |
Mr. Shivlal U. Rajani |
|
Designation : |
Chief Executive Officer |
BUSINESS DETAILS
|
Line of Business : |
Manufacturer of Art Silk Grey Cloth. |
|
|
|
|
Brand Names : |
-- |
|
|
|
|
Agencies Held : |
100% Indian |
|
|
|
|
Exports : |
Not Available |
|
|
|
|
Imports : |
Not Available |
|
|
|
|
Terms : |
|
|
Selling : |
Credit [30 days and 60 days] |
|
|
|
|
Purchasing : |
Credit [30 days] |
GENERAL INFORMATION
|
Suppliers : |
|
||||||||||||||||||||||
|
|
|
||||||||||||||||||||||
|
Customers : |
Wholesalers
|
||||||||||||||||||||||
|
|
|
||||||||||||||||||||||
|
No. of Employees : |
6 (Approximately) |
||||||||||||||||||||||
|
|
|
||||||||||||||||||||||
|
Bankers : |
|
||||||||||||||||||||||
|
|
|
||||||||||||||||||||||
|
Facilities : |
|
||||||||||||||||||||||
|
|
|
|
Auditors : |
|
|
Name : |
Jignesh Korat and Associates Chartered Accountants |
|
Address : |
F3, Shreyas Diamond, Mini Bazaar, Surat, Gujarat, India |
|
Mobile No.: |
91-9375018202 |
|
E-Mail : |
|
|
|
|
|
Associates/Subsidiaries : |
· Pearl Fab Star Fashion |
CAPITAL STRUCTURE
CAPITAL
ACCOUNT [PROVISIONAL]
[RS. IN MILLIONS]
|
DEBIT |
20.10.2014 |
CREDIT |
20.10.2014 |
|
|
|
|
|
|
Withdrawals |
0.036 |
Opening Balance |
2.915 |
|
|
|
|
|
|
Income – Tax |
0.020 |
|
|
|
|
|
Net Profit during the year |
0.281 |
|
|
|
|
|
|
Balance c/f |
3.140 |
|
|
|
|
|
|
|
|
|
|
|
|
|
Total |
3.196 |
Total |
3.196 |
FINANCIAL DATA
[all figures are
in Rupees Millions]
Note : Sole Proprietary and Partnership concerns are
exempted from filing their financials with the Government Authorities or
Registry.
ABRIDGED BALANCE
SHEET
|
SOURCES OF FUNDS |
20.10.2014 [Provisional] |
31.03.2014 |
31.03.2013 |
31.03.2012 |
|
|
SHAREHOLDERS FUNDS |
|
|
|
|
|
|
1] Proprietor Capital |
3.140 |
2.915 |
2.609 |
2.265 |
|
|
2] Share Application Money |
0.000 |
0.000 |
0.000 |
0.000 |
|
|
3] Profit and Loss Account |
0.000 |
0.000 |
0.000 |
0.000 |
|
|
4] (Accumulated Losses) |
0.000 |
0.000 |
0.000 |
0.000 |
|
|
NETWORTH |
3.140 |
2.915 |
2.609 |
2.265 |
|
|
LOAN FUNDS |
|
|
|
|
|
|
1] Secured Loans |
0.000 |
2.085 |
3.075 |
4.282 |
|
|
2] Unsecured Loans |
0.475 |
0.075 |
0.290 |
0.290 |
|
|
TOTAL BORROWING |
0.475 |
2.160 |
3.365 |
4.572 |
|
|
DEFERRED TAX LIABILITIES |
0.000 |
0.000 |
0.000 |
0.000 |
|
|
|
|
|
|
|
|
|
TOTAL |
3.615 |
5.075 |
5.974 |
6.837 |
|
|
|
|
|
|
|
|
|
APPLICATION OF
FUNDS |
|
|
|
|
|
|
|
|
|
|
|
|
|
FIXED ASSETS [Net Block] |
2.657 |
3.115 |
3.655 |
4.289 |
|
|
Capital work-in-progress |
0.000 |
0.000 |
0.000 |
0.000 |
|
|
|
|
|
|
|
|
|
INVESTMENT |
0.032 |
0.032 |
0.031 |
0.205 |
|
|
DEFERRED TAX ASSETS |
0.000 |
0.000 |
0.000 |
0.000 |
|
|
|
|
|
|
|
|
|
CURRENT ASSETS, LOANS & ADVANCES |
|
|
|
|
|
|
|
Inventories |
0.411
|
0.437
|
0.497 |
0.755 |
|
|
Sundry Debtors |
0.348
|
0.953
|
0.961 |
0.988 |
|
|
Cash & Bank Balances |
0.194
|
0.258
|
0.875 |
0.026 |
|
|
Other Current Assets |
0.000
|
0.000
|
0.000 |
0.000 |
|
|
Loans & Advances |
0.066
|
0.399
|
0.053 |
0.696 |
|
Total
Current Assets |
1.019
|
2.047
|
2.386 |
2.465 |
|
|
Less : CURRENT
LIABILITIES & PROVISIONS |
|
|
|
|
|
|
|
Sundry Creditors |
0.093
|
0.099
|
0.081 |
0.050 |
|
|
Other Current Liabilities |
0.000
|
0.000
|
0.000 |
0.000 |
|
|
Provisions |
0.000
|
0.020
|
0.017 |
0.072 |
|
Total
Current Liabilities |
0.093
|
0.119
|
0.098 |
0.122 |
|
|
Net Current Assets |
0.926
|
1.928
|
2.288 |
2.343 |
|
|
|
|
|
|
|
|
|
MISCELLANEOUS EXPENSES |
0.000 |
0.000 |
0.000 |
0.000 |
|
|
|
|
|
|
|
|
|
TOTAL |
3.615 |
5.075 |
5.974 |
6.837 |
|
PROFIT & LOSS
ACCOUNT
|
|
PARTICULARS |
20.10.2014 [Provisional] |
31.03.2014 |
31.03.2013 |
31.03.2012 |
|
|
|
SALES |
|
|
|
|
|
|
|
|
Embroidery Job Work |
3.274 |
6.841 |
6.071 |
5.862 |
|
|
|
Other Income |
0.000 |
0.000 |
0.000 |
0.000 |
|
|
|
TOTAL |
3.274 |
6.841 |
6.071 |
5.862 |
|
|
|
|
|
|
|
|
|
Less |
EXPENSES |
|
|
|
|
|
|
|
|
Cost of Goods sold |
0.026 |
0.060 |
0.258 |
(0.018) |
|
|
|
Materials Expenses |
1.532 |
3.676 |
3.009 |
0.783 |
|
|
|
Dhaga Cutting charges |
0.039 |
0.078 |
0.062 |
0.062 |
|
|
|
Job Work Charges paid |
0.411 |
0.878 |
0.472 |
2.432 |
|
|
|
Karigar Salary |
0.288 |
0.484 |
0.449 |
0.446 |
|
|
|
Electricity Powerbill Expenses |
0.043 |
0.073 |
0.045 |
0.044 |
|
|
|
Roll Polishing Charges |
0.032 |
0.067 |
0.054 |
0.053 |
|
|
|
Accounting Charges |
0.007 |
0.013 |
0.012 |
0.012 |
|
|
|
Conveyance Expenses |
0.006 |
0.010 |
0.007 |
0.009 |
|
|
|
Factory Rent |
0.084 |
0.144 |
0.120 |
0.120 |
|
|
|
Interest on loan |
0.022 |
0.268 |
0.481 |
0.660 |
|
|
|
Kasar/ Vatav Account |
0.014 |
0.035 |
0.002 |
0.000 |
|
|
|
Transportation Charges |
0.014 |
0.026 |
0.011 |
0.036 |
|
|
|
Other Expenses |
0.016 |
0.074 |
0.072 |
0.099 |
|
|
|
TOTAL |
2.534 |
5.886 |
5.054 |
4.738 |
|
|
|
|
|
|
|
|
|
|
PROFIT
BEFORE DEPRECIATION AND AMORTISATION |
0.740 |
0.955 |
1.017 |
1.124 |
|
|
|
|
|
|
|
|
|
|
Less/ Add |
DEPRECIATION/
AMORTISATION |
0.459 |
0.539 |
0.635 |
0.746 |
|
|
|
|
|
|
|
|
|
|
|
NET PROFIT |
0.281 |
0.416 |
0.382 |
0.378 |
|
KEY RATIOS
|
PARTICULARS |
|
20.10.2014 [Provisional] |
31.03.2014 |
31.03.2013 |
31.03.2012 |
|
Net Profit Margin (PAT/Sales) |
(%) |
8.58
|
6.08
|
6.29 |
6.45 |
|
|
|
|
|
|
|
|
Return on Total Assets (PBT/Total Assets} |
(%) |
7.64
|
8.06
|
6.32 |
5.60 |
|
|
|
|
|
|
|
|
Return on Investment (ROI) (PBT/Networth) |
|
0.09
|
0.14
|
0.15 |
0.17 |
|
|
|
|
|
|
|
|
Debt Equity Ratio (Total Debt/Networth) |
|
0.15
|
0.74
|
1.29 |
2.02 |
|
|
|
|
|
|
|
|
Current Ratio (Current Asset/Current Liability) |
|
10.96
|
17.20
|
24.35 |
20.20 |
FINANCIAL ANALYSIS
[all figures are
in Rupees Millions]
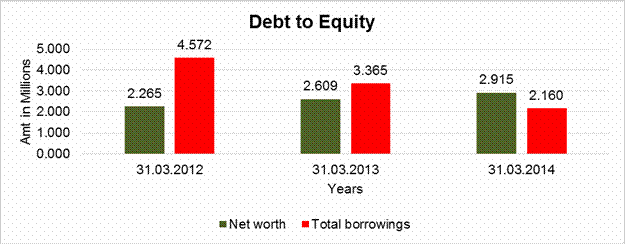
DEBT EQUITY RATIO
|
Particular |
31.03.2012 |
31.03.2013 |
31.03.2014 |
|
|
(Rs.
In Millions) |
(Rs.
In Millions) |
(Rs.
In Millions) |
|
Proprietor Capital |
2.265 |
2.609 |
2.915 |
|
Profit and Loss Account |
0.000 |
0.000 |
0.000 |
|
Net
worth |
2.265 |
2.609 |
2.915 |
|
|
|
|
|
|
Secured Loans |
4.282 |
3.075 |
2.085 |
|
Unsecured Loans |
0.290 |
0.290 |
0.075 |
|
Total
borrowings |
4.572 |
3.365 |
2.160 |
|
Debt/Equity ratio |
2.019 |
1.290 |
0.741 |
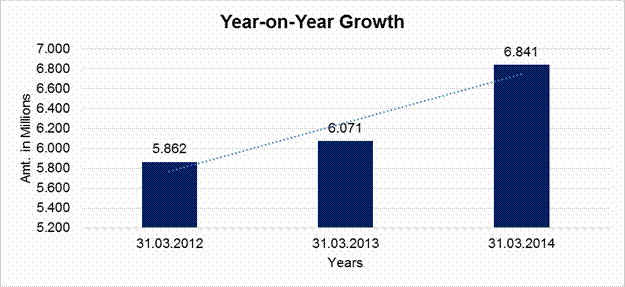
YEAR-ON-YEAR GROWTH
|
Year on Year Growth |
31.03.2012 |
31.03.2013 |
31.03.2014 |
|
|
(Rs.
In Millions) |
(Rs.
In Millions) |
(Rs.
In Millions) |
|
Sales |
5.862 |
6.071 |
6.841 |
|
|
|
3.565 |
12.683 |
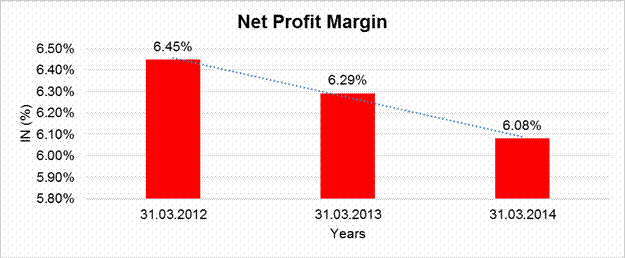
NET PROFIT MARGIN
|
Net Profit Margin |
31.03.2012 |
31.03.2013 |
31.03.2014 |
|
|
(Rs.
In Millions) |
(Rs.
In Millions) |
(Rs.
In Millions) |
|
Sales |
5.862 |
6.071 |
6.841 |
|
Profit |
0.378 |
0.382 |
0.416 |
|
|
6.45% |
6.29% |
6.08% |
LOCAL AGENCY FURTHER INFORMATION
|
Sr. No. |
Check List by Info Agents |
Available in
Report (Yes / No) |
|
1] |
Year of Establishment |
Yes |
|
2] |
Locality of the firm |
Yes |
|
3] |
Constitutions of the firm |
Yes |
|
4] |
Premises details |
Yes |
|
5] |
Type of Business |
Yes |
|
6] |
Line of Business |
Yes |
|
7] |
Promoter's background |
Yes |
|
8] |
No. of employees |
Yes |
|
9] |
Name of person contacted |
Yes |
|
10] |
Designation of contact
person |
Yes |
|
11] |
Turnover of firm for last
three years and seven months |
Yes |
|
12] |
Profitability for last
three years and seven months |
Yes |
|
13] |
Reasons for variation
<> 20% |
-- |
|
14] |
Estimation for coming
financial year |
Yes |
|
15] |
Capital in the business |
Yes |
|
16] |
Details of sister
concerns |
Yes |
|
17] |
Major suppliers |
Yes |
|
18] |
Major customers |
Yes |
|
19] |
Payments terms |
Yes |
|
20] |
Export / Import details
(if applicable) |
No |
|
21] |
Market information |
-- |
|
22] |
Litigations that the firm
/ promoter involved in |
-- |
|
23] |
Banking Details |
Yes |
|
24] |
Banking facility details |
Yes |
|
25] |
Conduct of the banking
account |
-- |
|
26] |
Buyer visit details |
-- |
|
27] |
Financials, if provided |
Yes |
|
28] |
Incorporation details, if
applicable |
No |
|
29] |
Last accounts filed at
ROC |
No |
|
30] |
Major Shareholders, if
available |
No |
|
31] |
Date of Birth of
Proprietor/Partner/Director, if available |
Yes |
|
32] |
PAN of
Proprietor/Partner/Director, if available |
Yes |
|
33] |
Voter ID No of
Proprietor/Partner/Director, if available |
No |
|
34] |
External Agency Rating,
if available |
No |
------------------------------------------------------------------------------------------------------------------------------
UNSECURED LOANS
(RS.
IN MILLIONS)
|
PARTICULARS |
20.10.2014 (Provisional) |
31.03.2014 |
|
|
|
|
|
Govindbhai K. Rajani |
0.075 |
0.075 |
|
Pawan Art |
0.400 |
0.000 |
|
|
|
|
|
Total |
0.475 |
0.075 |
------------------------------------------------------------------------------------------------------------------------------
STAR
FABRICS
COMPUTATION
OF TOTAL INCOME
(RS. IN MILLIONS)
|
PARTICULARS |
31.03.2014 |
|||
|
|
|
|
|
|
|
INCOME FROM BUSINESS OR PROFESSION |
|
|
|
|
|
Net Profit as per Profit and Loss Account |
|
0.416 |
|
|
|
|
|
|
|
|
|
Add: Disallowable / Addition |
|
|
|
|
|
Depreciation treated septly |
0.540 |
|
|
|
|
|
|
0.540 |
|
|
|
|
|
|
0.956 |
|
|
|
|
|
------------- |
|
|
|
|
|
|
|
|
Gross Total Business Income |
|
|
0.956 |
|
|
|
|
|
|
|
|
Less: Business Deductions |
|
|
|
|
|
Current Depreciation u/s. 32(1) |
|
0.540 |
|
|
|
|
|
|
0.540 |
|
|
|
|
|
|
|
|
TOTAL BUSINESS INCOME |
|
|
|
0.416 |
|
|
|
|
|
|
|
INCOME FROM OTHER SOURCES |
|
|
|
|
|
Interest Income |
|
|
|
|
|
Interest on FD with Banks |
|
0.001 |
|
|
|
|
|
|
0.001 |
|
|
TOTAL OTHER SOURCE INCOME |
|
|
|
0.001 |
|
|
|
|
|
------------- |
|
|
|
|
|
|
|
GROSS TOTAL INCOME |
|
|
|
0.417 |
|
|
|
|
|
|
|
|
|
|
|
|
|
Total Income |
|
|
|
0.417 |
|
|
|
|
|
|
|
Rounded off u/s.288A |
|
|
|
0.417 |
|
|
|
|
|
------------- |
|
COMPUTATION OF TAX PAYABLE |
|
|
|
|
|
Gross Tax on Rs. 0.417 Million [Normal] |
|
|
|
0.022 |
|
Less: Tax Rebate u/s. 87(A) |
|
|
|
0.002 |
|
|
|
|
|
|
|
Tax Payable |
|
|
|
0.020 |
|
|
|
|
|
|
|
Add: Education Cess and Higher Education
Cess |
|
|
|
0.001 |
|
|
|
|
|
------------ |
|
|
|
|
|
0.021 |
|
|
|
|
|
|
|
Tax Deducted at Sources: |
|
|
|
|
|
Other than Salary |
|
0.042 |
|
|
|
|
|
|
0.042 |
|
|
Total Prepaid Taxes |
|
|
|
0.042 |
|
|
|
|
|
----------- |
|
Tax Refundable |
|
|
|
(0.021) |
|
|
|
|
|
|
|
Rounded off to nearest 10 |
|
|
|
(0.021) |
|
|
|
|
|
======== |
------------------------------------------------------------------------------------------------------------------------------
COST
OF PROJECT
(RS. IN MILLIONS)
|
PARTICULARS |
EXISTING |
PROPOSED |
TOTAL |
|
|
|
|
|
|
Plant and Machinery |
3.056 |
9.188 |
12.244 |
|
|
|
|
|
|
Land and Building |
0.000 |
1.750 |
1.750 |
|
|
|
|
|
|
Other Fixed Assets |
0.059 |
0.000 |
0.059 |
|
|
|
|
|
|
TOTAL CAPITAL COST OF PROJECT |
3.115 |
10.938 |
14.053 |
|
|
|
|
|
|
Working Capital Margin |
1.959 |
4.653 |
6.612 |
|
|
|
|
|
|
TOTAL COST OF PROJECT |
5.074 |
15.591 |
20.665 |
------------------------------------------------------------------------------------------------------------------------------
MEANS
OF FINANCE
(RS. IN MILLIONS)
|
PARTICULARS |
EXISTING |
PROPOSED |
TOTAL |
|
|
|
|
|
|
Capital |
2.915 |
3.500 |
6.415 |
|
|
|
|
|
|
Term Loans |
1.578 |
6.891 |
8.469 |
|
|
|
|
|
|
Cash Credit |
0.506 |
3.000 |
3.506 |
|
|
|
|
|
|
Unsecured Loans / Deposits |
0.075 |
2.200 |
2.275 |
|
|
|
|
|
|
TOTAL MEANS OF FINANCE |
5.074 |
15.591 |
20.665 |
------------------------------------------------------------------------------------------------------------------------------
COMPUTATION OF DEBT SERVICE COVERAGE RATIO
(RS. IN MILLIONS)
|
PARTICULARS |
2014-15 |
2015-16 |
2016-17 |
2017-18 |
2018-19 |
2019-20 |
|
|
PROJECTION |
|||||
|
|
|
|
|
|
|
|
|
Net Profit after Tax |
0.720 |
1.620 |
2.005 |
2.380 |
2.732 |
3.368 |
|
|
|
|
|
|
|
|
|
Add: Depreciation written off |
0.803 |
1.716 |
1.459 |
1.240 |
1.054 |
0.448 |
|
|
|
|
|
|
|
|
|
Add: Interest on TL – Proposed |
0.411 |
1.271 |
1.068 |
0.862 |
0.655 |
0.457 |
|
|
|
|
|
|
|
|
|
Funds available to Service |
1.934 |
4.607 |
4.532 |
4.482 |
4.441 |
4.272 |
|
|
|
|
|
|
|
|
|
Add: Interest on TL – Proposed |
0.411 |
1.271 |
1.068 |
0.862 |
0.655 |
0.457 |
|
|
|
|
|
|
|
|
|
Principal repayment – Pr |
-- |
1.276 |
1.531 |
1.531 |
1.531 |
1.021 |
|
|
|
|
|
|
|
|
|
Total Installment |
0.411 |
2.547 |
2.600 |
2.393 |
2.186 |
1.478 |
|
|
|
|
|
|
|
|
|
DSCR |
4.70 |
1.81 |
1.74 |
1.87 |
2.03 |
2.89 |
|
|
|
|
|
|
|
|
|
Average DSCR |
2.09 |
|||||
|
|
|
|
|
|
|
|
|
Interest Coverage Ratio [No.] |
4.70 |
3.63 |
4.24 |
5.20 |
6.78 |
9.35 |
------------------------------------------------------------------------------------------------------------------------------
BREAK
EVEN ANALYSIS
(RS. IN MILLIONS)
|
PARTICULARS |
2014-15 |
2015-16 |
2016-17 |
2017-18 |
2018-19 |
2019-20 |
|
|
PROJECTION |
|||||
|
|
|
|
|
|
|
|
|
Installed Capacity |
65934 |
263736 |
263736 |
263736 |
263736 |
263736 |
|
|
|
|
|
|
|
|
|
Sales / Revenue |
10.885 |
21.187 |
23.720 |
24.253 |
24.786 |
25.319 |
|
|
|
|
|
|
|
|
|
Variable Costs |
8.640 |
18.526 |
18.735 |
18.919 |
19.103 |
19.298 |
|
|
|
|
|
|
|
|
|
Contribution |
2.245 |
4.660 |
4.985 |
5.334 |
5.683 |
6.021 |
|
|
|
|
|
|
|
|
|
Total Fixed Costs |
1.203 |
2.316 |
2.084 |
1.890 |
1.729 |
1.148 |
|
|
|
|
|
|
|
|
|
Cash Fixed Costs |
0.400 |
0.600 |
0.625 |
0.650 |
0.675 |
0.700 |
|
|
|
|
|
|
|
|
|
Profit Volume Ratio |
20.62 |
20.10 |
21.02 |
21.99 |
22.93 |
23.78 |
|
|
|
|
|
|
|
|
|
Cash Break Even Sales |
1.939 |
2.985 |
2.974 |
2.955 |
2.944 |
2.943 |
|
|
|
|
|
|
|
|
|
Cash Margin of Safety |
8.945 |
20.202 |
20.746 |
21.298 |
21.842 |
22.376 |
|
|
|
|
|
|
|
|
|
Break Even Sales |
5.833 |
11.523 |
9.915 |
8.593 |
7.541 |
4.827 |
|
|
|
|
|
|
|
|
|
Margin of Safety |
5.052 |
11.663 |
13.805 |
15.660 |
17.245 |
20.492 |
|
|
|
|
|
|
|
|
|
Cash Break Even [% of Inst.] |
42.02 |
16.17 |
16.11 |
16.01 |
15.95 |
15.94 |
|
|
|
|
|
|
|
|
|
Break Even Sales [[% of Inst.] |
126.37 |
62.42 |
53.71 |
46.54 |
40.85 |
26.15 |
------------------------------------------------------------------------------------------------------------------------------
STATEMENT
SHOWING PROFITABILITY AND NET CASH ACCRUALS
(RS. IN MILLIONS)
|
PARTICULARS |
2014-15 |
2015-16 |
2016-17 |
2017-18 |
2018-19 |
2019-20 |
|
|
PROJECTION |
|||||
|
INCOME |
|
|
|
|
|
|
|
Sales / Job Work |
9.417 |
21.662 |
22.160 |
22.658 |
23.156 |
23.654 |
|
|
|
|
|
|
|
|
|
Closing Stock |
1.468 |
1.525 |
1.560 |
1.595 |
1.630 |
1.665 |
|
|
|
|
|
|
|
|
|
Other Income |
-- |
-- |
-- |
-- |
-- |
-- |
|
|
|
|
|
|
|
|
|
TOTAL |
10.885 |
23.187 |
23.720 |
24.253 |
24.786 |
25.319 |
|
|
|
|
|
|
|
|
|
EXPENDITURES |
|
|
|
|
|
|
|
Opening Stock |
0.437 |
1.468 |
1.525 |
1.560 |
1.595 |
1.630 |
|
|
|
|
|
|
|
|
|
Raw Material Purchases |
5.442 |
11.593 |
11.860 |
12.126 |
12.393 |
12.659 |
|
|
|
|
|
|
|
|
|
Outside Job Work |
-- |
-- |
-- |
-- |
-- |
-- |
|
|
|
|
|
|
|
|
|
Power and Fuel |
0.352 |
0.721 |
0.737 |
0.753 |
0.769 |
0.785 |
|
|
|
|
|
|
|
|
|
Salaries and Wages |
1.671 |
2.778 |
2.834 |
2.891 |
2.949 |
3.008 |
|
|
|
|
|
|
|
|
|
Other Manufacturing Expenses |
0.327 |
0.696 |
0.712 |
0.728 |
0.744 |
0.760 |
|
|
|
|
|
|
|
|
|
Factory Costs |
8.228 |
17.256 |
17.667 |
18.057 |
18.448 |
18.841 |
|
|
|
|
|
|
|
|
|
Cost of Production |
8.228 |
17.256 |
17.667 |
18.057 |
18.448 |
18.841 |
|
|
|
|
|
|
|
|
|
Gross Profit |
2.656 |
5.931 |
6.053 |
6.196 |
6.338 |
6.478 |
|
|
|
|
|
|
|
|
|
Selling and General Administrative Expenses |
0.400 |
0.600 |
0.625 |
0.650 |
0.675 |
0.700 |
|
|
|
|
|
|
|
|
|
Profit before Interest and Depreciation |
2.256 |
5.331 |
5.428 |
5.546 |
5.663 |
5.778 |
|
|
|
|
|
|
|
|
|
Interest on Bank Loan |
0.411 |
1.271 |
1.068 |
0.862 |
0.655 |
0.457 |
|
|
|
|
|
|
|
|
|
Depreciation written off |
0.803 |
1.716 |
1.459 |
1.240 |
1.054 |
0.448 |
|
|
|
|
|
|
|
|
|
Net Profit before Tax |
1.042 |
2.344 |
2.901 |
3.444 |
3.954 |
4.873 |
|
|
|
|
|
|
|
|
|
Less: Tax |
0.322 |
0.724 |
0.896 |
1.064 |
1.222 |
1.506 |
|
|
|
|
|
|
|
|
|
Profit after Tax |
0.720 |
1.620 |
2.005 |
2.380 |
2.732 |
3.368 |
|
|
|
|
|
|
|
|
|
Add: Depreciation |
0.803 |
1.716 |
1.459 |
1.240 |
1.054 |
0.448 |
|
|
|
|
|
|
|
|
|
Net Cash Accruals |
1.523 |
3.336 |
3.463 |
3.620 |
3.786 |
3.815 |
------------------------------------------------------------------------------------------------------------------------------
STATEMENT
SHOWING PROJECTED BALANCE SHEET
(RS. IN MILLIONS)
|
PARTICULARS |
2014-15 |
2015-16 |
2016-17 |
2017-18 |
2018-19 |
2019-20 |
|
|
PROJECTION |
|||||
|
LIABILITIES |
|
|
|
|
|
|
|
Capital |
2.915 |
7.135 |
8.555 |
10.310 |
12.390 |
14.772 |
|
|
|
|
|
|
|
|
|
Add: Addition |
3.500 |
-- |
-- |
-- |
-- |
-- |
|
|
|
|
|
|
|
|
|
Add: Net Profit/ (Net Loss) |
0.720 |
1.620 |
2.005 |
2.380 |
2.732 |
3.368 |
|
|
|
|
|
|
|
|
|
Less: Withdrawals |
-- |
0.200 |
0.250 |
0.300 |
0.350 |
0.400 |
|
|
|
|
|
|
|
|
|
Closing Capital [A] |
7.135 |
8.555 |
10.310 |
12.390 |
14.772 |
17.739 |
|
|
|
|
|
|
|
|
|
Term Loan |
5.615 |
4.084 |
2.552 |
1.021 |
-- |
-- |
|
|
|
|
|
|
|
|
|
Unsecured Loans |
2.275 |
2.275 |
2.275 |
2.275 |
2.275 |
2.275 |
|
|
|
|
|
|
|
|
|
Total Term Liabilities [B] |
7.890 |
6.359 |
4.827 |
3.296 |
2.275 |
2.275 |
|
|
|
|
|
|
|
|
|
Installment due within one year |
1.276 |
1.531 |
1.531 |
1.531 |
1.021 |
-- |
|
|
|
|
|
|
|
|
|
Cash Credit |
3.000 |
3.000 |
3.000 |
3.000 |
3.000 |
3.000 |
|
|
|
|
|
|
|
|
|
Provision for Expenses |
0.169 |
0.168 |
0.172 |
0.176 |
0.180 |
0.185 |
|
|
|
|
|
|
|
|
|
Creditors |
0.416 |
0.505 |
0.517 |
0.528 |
0.540 |
0.551 |
|
|
|
|
|
|
|
|
|
Total Current Liabilities [C] |
4.861 |
5.205 |
5.220 |
5.236 |
4.741 |
3.736 |
|
|
|
|
|
|
|
|
|
TOTAL [A + B + C] |
19.886 |
20.118 |
20.357 |
20.922 |
21.788 |
23.750 |
|
|
|
|
|
|
|
|
|
ASSETS |
|
|
|
|
|
|
|
Fixed Assets [Gross Cost] |
14.053 |
14.053 |
14.053 |
14.053 |
14.053 |
14.053 |
|
|
|
|
|
|
|
|
|
Depreciation to date |
0.803 |
2.519 |
3.978 |
5.218 |
6.272 |
6.720 |
|
|
|
|
|
|
|
|
|
Net Fixed Assets [D] |
13.250 |
11.534 |
10.075 |
8.835 |
7.781 |
7.333 |
|
|
|
|
|
|
|
|
|
Capital work in process |
-- |
-- |
-- |
-- |
-- |
-- |
|
|
|
|
|
|
|
|
|
Long term Investments |
-- |
1.600 |
3.000 |
4.500 |
6.200 |
8.300 |
|
|
|
|
|
|
|
|
|
Long term Investments [E] |
-- |
1.600 |
3.000 |
4.500 |
6.200 |
8.300 |
|
|
|
|
|
|
|
|
|
Receivables |
4.136 |
4.193 |
4.289 |
4.385 |
4.482 |
4.578 |
|
|
|
|
|
|
|
|
|
Inventories |
1.468 |
1.525 |
1.560 |
1.595 |
1.630 |
1.665 |
|
|
|
|
|
|
|
|
|
Other Current Assets |
0.433 |
0.592 |
0.683 |
0.781 |
0.795 |
0.899 |
|
|
|
|
|
|
|
|
|
Cash and Bank Balances |
0.600 |
0.675 |
0.750 |
0.825 |
0.900 |
0.975 |
|
|
|
|
|
|
|
|
|
Total Current Assets [F] |
6.636 |
6.984 |
7.282 |
7.586 |
7.807 |
8.117 |
|
|
|
|
|
|
|
|
|
TOTAL [D + E + F] |
19.886 |
20.118 |
20.357 |
20.921 |
21.788 |
23.750 |
------------------------------------------------------------------------------------------------------------------------------
CASH
FLOW STATEMENT
(RS. IN MILLIONS)
|
PARTICULARS |
2014-15 |
2015-16 |
2016-17 |
2017-18 |
2018-19 |
2019-20 |
|
|
PROJECTION |
|||||
|
SOURCES |
|
|
|
|
|
|
|
|
|
|
|
|
|
|
|
CASH FROM OPERATIONAL ACTIVITIES |
|
|
|
|
|
|
|
Net Profit after tax |
0.720 |
1.620 |
2.005 |
2.380 |
2.732 |
3.368 |
|
|
|
|
|
|
|
|
|
Interest [Treated Separately] |
0.411 |
1.271 |
1.068 |
0.862 |
0.655 |
0.457 |
|
|
|
|
|
|
|
|
|
Depreciation |
0.803 |
1.716 |
1.459 |
1.240 |
1.054 |
0.448 |
|
|
|
|
|
|
|
|
|
Increase/ (Decrease) in Current Assets other
than cash |
(6.036) |
(0.273) |
(0.222) |
(0.229) |
(0.145) |
(0.235) |
|
|
|
|
|
|
|
|
|
Increase/ (Decrease) in Current Liabilities |
0.585 |
0.088 |
0.016 |
0.016 |
0.016 |
0.016 |
|
|
|
|
|
|
|
|
|
TOTAL [A] |
(3.517) |
4.422 |
4.325 |
4.268 |
4.311 |
4.052 |
|
|
|
|
|
|
|
|
|
CASH FROM FINANCIAL ACTIVITIES |
|
|
|
|
|
|
|
Capital Introduced |
6.415 |
-- |
-- |
-- |
-- |
-- |
|
|
|
|
|
|
|
|
|
Term Loan acquired |
6.891 |
-- |
-- |
-- |
-- |
-- |
|
|
|
|
|
|
|
|
|
Unsecured Loan acquired |
2.275 |
-- |
-- |
-- |
-- |
-- |
|
|
|
|
|
|
|
|
|
Cash Credit |
3.000 |
-- |
-- |
-- |
-- |
-- |
|
|
|
|
|
|
|
|
|
Capital Subsidy – MMS@ 15% received
[Existing] |
-- |
-- |
-- |
-- |
-- |
-- |
|
|
|
|
|
|
|
|
|
TOTAL [B] |
18.581 |
-- |
-- |
-- |
-- |
-- |
|
|
|
|
|
|
|
|
|
CASH FROM INVESTMENT ACTIVITIES |
|
|
|
|
|
|
|
Fixed asset disposed off |
-- |
-- |
-- |
-- |
-- |
-- |
|
|
|
|
|
|
|
|
|
Long term Investment disposed off |
-- |
-- |
-- |
-- |
-- |
-- |
|
|
|
|
|
|
|
|
|
TOTAL [C] |
-- |
-- |
-- |
-- |
-- |
-- |
|
|
|
|
|
|
|
|
|
TOTAL CASH INFLOW [A + B + C] |
15.064 |
4.422 |
4.325 |
4.268 |
4.311 |
4.052 |
|
|
|
|
|
|
|
|
|
APPLICATION |
|
|
|
|
|
|
|
|
|
|
|
|
|
|
|
OUTFLOW FROM OPERATIONAL ACTIVITIES |
|
|
|
|
|
|
|
Loss from Operation |
-- |
-- |
-- |
-- |
-- |
-- |
|
|
|
|
|
|
|
|
|
TOTAL [D] |
-- |
-- |
-- |
-- |
-- |
-- |
|
|
|
|
|
|
|
|
|
OUTFLOW FROM FINANCIAL ACTIVITIES |
|
|
|
|
|
|
|
Withdrawals |
-- |
0.200 |
0.250 |
0.300 |
0.350 |
0.400 |
|
|
|
|
|
|
|
|
|
Term Loan repaid |
-- |
1.276 |
1.531 |
1.531 |
1.531 |
1.021 |
|
|
|
|
|
|
|
|
|
Interest paid on Term Loan |
0.411 |
1.271 |
1.068 |
0.862 |
0.655 |
0.457 |
|
|
|
|
|
|
|
|
|
TOTAL [E] |
0.411 |
2.747 |
2.850 |
2.693 |
2.536 |
1.878 |
|
|
|
|
|
|
|
|
|
OUTFLOW FROM INVESTMENT ACTIVITIES |
|
|
|
|
|
|
|
Fixed assets purchased |
14.053 |
-- |
-- |
-- |
-- |
-- |
|
|
|
|
|
|
|
|
|
Investment in Long term sources |
-- |
1.600 |
1.400 |
1.500 |
1.700 |
2.100 |
|
|
|
|
|
|
|
|
|
TOTAL [F] |
14.053 |
1.600 |
1.400 |
1.500 |
1.700 |
2.100 |
|
|
|
|
|
|
|
|
|
TOTAL CASH OUTFLOW [D + E + F] |
14.464 |
4.347 |
4.250 |
4.193 |
4.236 |
3.978 |
|
|
|
|
|
|
|
|
|
NET EFFECT |
|
|
|
|
|
|
|
Cash Surplus/ (Deficit) [Inflow minus
Outflow] |
0.600 |
0.075 |
0.075 |
0.075 |
0.075 |
0.075 |
|
|
|
|
|
|
|
|
|
Add: Opening Cash and Bank |
-- |
0.600 |
0.675 |
0.750 |
0.825 |
0.900 |
|
|
|
|
|
|
|
|
|
CLOSING CASH AND BANK |
0.600 |
0.675 |
0.750 |
0.825 |
0.900 |
0.975 |
------------------------------------------------------------------------------------------------------------------------------
STATEMENT
SHOWING IMPORTANT FINANCIAL RATIOS
(RS. IN MILLIONS)
|
PARTICULARS |
2014-15 |
2015-16 |
2016-17 |
2017-18 |
2018-19 |
2019-20 |
|
|
PROJECTION |
|||||
|
|
|
|
|
|
|
|
|
LIQUIDITY RATIOS |
|
|
|
|
|
|
|
Current Assets |
6.636 |
6.984 |
7.282 |
7.586 |
7.807 |
8.117 |
|
|
|
|
|
|
|
|
|
Current Liabilities |
4.861 |
5.205 |
5.220 |
5.236 |
4.741 |
3.736 |
|
|
|
|
|
|
|
|
|
Net Current Assets |
1.775 |
1.779 |
2.061 |
2.350 |
3.065 |
4.381 |
|
|
|
|
|
|
|
|
|
Current Ratio |
1.37 |
1.34 |
1.39 |
1.45 |
1.65 |
2.17 |
|
|
|
|
|
|
|
|
|
SOLVENCY RATIOS |
|
|
|
|
|
|
|
Tangible worth i.e. Equity |
7.135 |
8.555 |
10.310 |
12.390 |
14.772 |
17.739 |
|
|
|
|
|
|
|
|
|
Unsecured Loans |
2.275 |
2.275 |
2.275 |
2.275 |
2.275 |
2.275 |
|
|
|
|
|
|
|
|
|
Other Term Liabilities |
5.615 |
4.084 |
2.552 |
1.021 |
-- |
-- |
|
|
|
|
|
|
|
|
|
Total Outside Liabilities |
12.751 |
11.563 |
10.048 |
8.532 |
7.016 |
6.011 |
|
|
|
|
|
|
|
|
|
TOL/ Networth [No. of Days] |
1.79 |
1.35 |
0.97 |
0.69 |
0.47 |
0.34 |
|
|
|
|
|
|
|
|
|
Debt Equity Ratio [No. of Days] |
-- |
-- |
-- |
-- |
-- |
-- |
|
|
|
|
|
|
|
|
|
Unsecured Loans as Debt |
1.11 |
0.74 |
0.47 |
0.27 |
0.15 |
0.13 |
|
|
|
|
|
|
|
|
|
Unsecured Loans as Equity |
0.60 |
0.38 |
0.20 |
0.07 |
-- |
-- |
|
|
|
|
|
|
|
|
|
PROFITABILITY RATIOS |
|
|
|
|
|
|
|
Sales / Revenue |
9.417 |
21.662 |
22.160 |
22.658 |
23.156 |
23.654 |
|
|
|
|
|
|
|
|
|
Gross Profit |
2.656 |
5.931 |
6.053 |
6.196 |
6.338 |
6.478 |
|
|
|
|
|
|
|
|
|
Net Profit after tax |
0.720 |
1.620 |
2.005 |
2.380 |
2.732 |
3.368 |
|
|
|
|
|
|
|
|
|
Gross Profit Ratio |
28.21 |
27.38 |
27.32 |
27.35 |
27.37 |
27.39 |
|
|
|
|
|
|
|
|
|
Net Profit Ratio |
7.65 |
7.48 |
9.05 |
10.50 |
11.80 |
14.24 |
|
|
|
|
|
|
|
|
|
RETURN ON FUND EMPLOYED |
|
|
|
|
|
|
|
Equity Fund |
7.135 |
8.555 |
10.310 |
12.390 |
14.772 |
17.739 |
|
|
|
|
|
|
|
|
|
Capital Employed [Equity Fund + Term
Liabilities] |
15.025 |
14.913 |
15.137 |
15.686 |
17.047 |
20.014 |
|
|
|
|
|
|
|
|
|
Profit after tax [PAT] |
0.720 |
1.620 |
2.005 |
2.380 |
2.732 |
3.368 |
|
|
|
|
|
|
|
|
|
PAT + Interest on Term Liabilities |
1.131 |
2.891 |
3.073 |
3.242 |
3.387 |
3.824 |
|
|
|
|
|
|
|
|
|
Return on Equity [ROE] |
10.09 |
18.94 |
19.44 |
19.21 |
18.50 |
18.98 |
|
|
|
|
|
|
|
|
|
Return on Capital Employed [ROCE] |
7.53 |
19.38 |
20.30 |
20.67 |
19.87 |
19.11 |
|
|
|
|
|
|
|
|
|
TURNOVER RATIOS |
|
|
|
|
|
|
|
Sales / Revenue |
9.417 |
21.662 |
22.160 |
22.658 |
23.156 |
23.654 |
|
|
|
|
|
|
|
|
|
Purchases |
5.769 |
12.289 |
12.572 |
12.854 |
13.137 |
13.419 |
|
|
|
|
|
|
|
|
|
Debtors |
4.136 |
4.193 |
4.289 |
4.385 |
4.482 |
4.578 |
|
|
|
|
|
|
|
|
|
Creditors |
0.416 |
0.505 |
0.517 |
0.528 |
0.540 |
0.551 |
|
|
|
|
|
|
|
|
|
Material Consumption [in Qty.] |
-- |
-- |
-- |
-- |
-- |
-- |
|
|
|
|
|
|
|
|
|
Raw Material [in Qty.] |
-- |
-- |
-- |
-- |
-- |
-- |
|
|
|
|
|
|
|
|
|
WIP [in Qty.] |
-- |
-- |
-- |
-- |
-- |
-- |
|
|
|
|
|
|
|
|
|
Projected Production |
56044 |
229451 |
234725 |
240000 |
245275 |
250549 |
|
|
|
|
|
|
|
|
|
Finished Goods [in Qty.] |
-- |
-- |
-- |
-- |
-- |
-- |
|
|
|
|
|
|
|
|
|
Debtors Credit Period [In days] |
71 |
71 |
71 |
71 |
71 |
71 |
|
|
|
|
|
|
|
|
|
Creditors Payment Period [In days] |
15 |
15 |
15 |
15 |
15 |
15 |
|
|
|
|
|
|
|
|
|
Inventory holding period [In days] |
48 |
48 |
48 |
48 |
48 |
48 |
------------------------------------------------------------------------------------------------------------------------------
ASSESSMENT OF WORKING
CAPITAL REQUIREMENTS
OPERATING STATEMENT
(RS. IN MILLIONS)
|
SR. NO. |
PARTICULARS |
2014-15 ESTIMATED |
2015-16 PROJECTED |
2016-17 PROJECTED |
|
|
|
|
|
|
|
|
Operating Statement |
|
|
|
|
|
1. Domestic Sale |
9.417 |
21.662 |
22.160 |
|
|
|
|
|
|
|
|
2. Export Sale |
-- |
-- |
-- |
|
|
|
|
|
|
|
1 |
Total Gross Sales |
9.417 |
21.662 |
22.160 |
|
|
|
|
|
|
|
2 |
Less: Excise duty |
-- |
-- |
-- |
|
|
|
|
|
|
|
3 |
Net Sales [1 - 2] |
9.417 |
21.662 |
22.160 |
|
|
|
|
|
|
|
4 |
Growth in sales |
38% |
130% |
2% |
|
|
|
|
|
|
|
|
Cost of sales |
|
|
|
|
5 |
a. Raw material [Imported] |
-- |
-- |
-- |
|
|
|
|
|
|
|
|
b. Raw material [Indigenous] |
5.442 |
11.593 |
11.860 |
|
|
|
|
|
|
|
|
c. Packing Material |
-- |
-- |
-- |
|
|
|
|
|
|
|
|
Job Work |
-- |
-- |
-- |
|
|
|
|
|
|
|
6 |
Power and Fuel |
0.352 |
0.721 |
0.737 |
|
|
|
|
|
|
|
7 |
Wages and Salary [Outside Manufacturing
Expenses] |
1.671 |
2.778 |
2.834 |
|
|
|
|
|
|
|
8 |
Other Manufacturing Expenses |
0.327 |
0.696 |
0.712 |
|
|
|
|
|
|
|
9 |
Office Expenses |
-- |
-- |
-- |
|
|
|
|
|
|
|
10 |
Depreciation |
0.803 |
1.716 |
1.459 |
|
|
|
|
|
|
|
|
SUB-TOTAL |
8.594 |
17.504 |
17.601 |
|
|
|
|
|
|
|
11 |
Add: Opening stock |
0.437 |
1.468 |
1.525 |
|
|
|
|
|
|
|
|
SUB-TOTAL |
9.031 |
18.972 |
19.126 |
|
|
|
|
|
|
|
12 |
Deduct: Closing Stock |
1.468 |
1.525 |
1.560 |
|
|
|
|
|
|
|
|
Cost of Production |
7.564 |
17.447 |
17.566 |
|
|
|
|
|
|
|
13 |
Add: Opening stock of goods |
-- |
-- |
-- |
|
|
|
|
|
|
|
|
SUB-TOTAL |
7.564 |
17.447 |
17.566 |
|
|
|
|
|
|
|
14 |
Less: Closing stock of goods |
-- |
-- |
-- |
|
|
|
|
|
|
|
|
SUB-TOTAL [TOTAL COST OF SALES] |
7.564 |
17.447 |
17.566 |
|
|
|
|
|
|
|
15 |
Gross Profit |
2.656 |
5.931 |
6.053 |
|
|
|
|
|
|
|
|
Gross Profit / Sales |
28% |
27% |
27% |
|
|
|
|
|
|
|
16 |
Selling and Administrative Expenses [Intt.
Remuneration to partner] |
-- |
-- |
-- |
|
|
|
|
|
|
|
17 |
Administrative Expenses |
0.400 |
0.600 |
0.625 |
|
|
|
|
|
|
|
|
SUB-TOTAL |
7.964 |
18.047 |
18.191 |
|
|
|
|
|
|
|
18 |
Operating profit before interest |
1.453 |
3.615 |
3.969 |
|
|
|
|
|
|
|
|
a. Interest on CC |
0.101 |
0.405 |
0.405 |
|
|
|
|
|
|
|
|
b. Interest on TL |
0.310 |
0.866 |
0.663 |
|
|
|
|
|
|
|
|
c. Other Interests |
-- |
-- |
-- |
|
|
|
|
|
|
|
19 |
Total Interest |
0.411 |
1.271 |
1.068 |
|
|
|
|
|
|
|
20 |
Operating profit after interest |
1.042 |
2.344 |
2.901 |
|
|
|
|
|
|
|
21 |
Add: Other Non-operating Income |
|
|
|
|
|
a. Interest/ Dividend/ Royalties etc. |
-- |
-- |
-- |
|
|
b. Other Income |
-- |
-- |
-- |
|
|
|
|
|
|
|
|
SUB-TOTAL |
-- |
-- |
-- |
|
|
|
|
|
|
|
22 |
Deduct: Other Non-operating Expenses |
|
|
|
|
|
a. Interest/ Dividend/ Royalties etc. |
-- |
-- |
-- |
|
|
b. Other Expenses |
-- |
-- |
-- |
|
|
c. Intangibles written off |
-- |
-- |
-- |
|
|
|
|
|
|
|
|
SUB-TOTAL |
-- |
-- |
-- |
|
|
|
|
|
|
|
23 |
Net of other non-operating Income/ Expenses |
-- |
-- |
-- |
|
|
|
|
|
|
|
24 |
Profit / [Loss] before tax [PBT] |
1.042 |
2.344 |
2.901 |
|
|
|
|
|
|
|
25 |
Provision for taxes |
0.322 |
0.724 |
0.896 |
|
|
|
|
|
|
|
26 |
Profit / [Loss] after tax [PAT] |
0.720 |
1.620 |
2.005 |
|
|
|
|
|
|
|
27 |
Cash Accruals |
1.523 |
3.336 |
3.463 |
|
|
|
|
|
|
|
28 |
Drawing/ Dividend |
-- |
-- |
-- |
|
|
|
|
|
|
|
29 |
Retained Profit |
0.720 |
1.620 |
2.005 |
|
|
|
|
|
|
|
30 |
Retained Cash Profits |
1.523 |
3.336 |
3.463 |
|
|
|
|
|
|
|
31 |
RM content in sales |
52% |
53% |
53% |
|
|
|
|
|
|
|
32 |
PBDIT / Sales |
23.96% |
24.61% |
24.49% |
|
|
|
|
|
|
|
33 |
Operating Profit / Sales |
11.06% |
10.82% |
13.0% |
|
|
|
|
|
|
|
34 |
PBT / Sales |
11.06% |
10.82% |
13.0% |
|
|
|
|
|
|
|
35 |
PAT / Sales |
7.65% |
7.48% |
9.0% |
|
|
|
|
|
|
|
36 |
Cash Accruals / Sales |
16.17% |
15.40% |
15.63% |
------------------------------------------------------------------------------------------------------------------------------
ANALYSIS
OF BALANCE SHEET
(RS. IN MILLIONS)
|
SR. NO. |
PARTICULARS |
2014-15 ESTIMATED |
2015-16 PROJECTED |
2016-17 PROJECTED |
|
|
|
|
|
|
|
|
CURRENT LIABILITIES |
|
|
|
|
1 |
Short term loans
from applicant bank including BP and BD |
3.000 |
3.000 |
3.000 |
|
|
|
|
|
|
|
|
Short term loans from other banks including
BP and BD |
-- |
-- |
-- |
|
|
|
|
|
|
|
|
SUB-TOTAL (A) |
3.000 |
3.000 |
3.000 |
|
|
|
|
|
|
|
2 |
Short term borrowings from others |
-- |
-- |
-- |
|
|
|
|
|
|
|
3 |
Sundry creditors [trade] |
0.416 |
0.505 |
0.517 |
|
|
|
|
|
|
|
4 |
Advance payment from customers |
-- |
-- |
-- |
|
|
|
|
|
|
|
5 |
Provision for Expenses |
0.169 |
0.168 |
0.172 |
|
|
|
|
|
|
|
6 |
Dividend payable |
-- |
-- |
-- |
|
|
|
|
|
|
|
7 |
Other statutory liabilities [due within one
year] |
-- |
-- |
-- |
|
|
|
|
|
|
|
8 |
Overdue term liabilities |
-- |
-- |
-- |
|
|
|
|
|
|
|
9 |
Installments of term loan/ DPGs/ Deposits/
Debentures due within next year |
1.276 |
1.531 |
1.531 |
|
|
|
|
|
|
|
10 |
Other current liabilities and provisions
[due within one year] |
-- |
-- |
-- |
|
|
|
|
|
|
|
11 |
SUB-TOTAL (B) |
1.861 |
2.205 |
2.220 |
|
|
|
|
|
|
|
12 |
TOTAL CURRENT LIABILITIES |
4.861 |
5.205 |
5.220 |
|
|
|
|
|
|
|
|
TERM LIABILITIES |
|
|
|
|
13 |
Debentures [not maturing within one year] |
-- |
-- |
-- |
|
|
|
|
|
|
|
14 |
Term loan from bank [less next year
installments] |
5.615 |
4.084 |
2.552 |
|
|
|
|
|
|
|
15 |
Term loan from other banks / installment [exceeding
installment due next year] |
-- |
-- |
-- |
|
|
|
|
|
|
|
16 |
Deferred payments credits [excluding
installment due next year] |
-- |
-- |
-- |
|
|
|
|
|
|
|
17 |
Term deposits [excluding installment due
next year] |
-- |
-- |
-- |
|
|
|
|
|
|
|
18 |
Other term liabilities |
2.275 |
2.275 |
2.275 |
|
|
|
|
|
|
|
19 |
TOTAL TERM LIABILITIES |
7.890 |
6.359 |
4.827 |
|
|
|
|
|
|
|
20 |
TOTAL OF OUTSIDE LIABILITIES |
12.751 |
11.563 |
10.048 |
|
|
|
|
|
|
|
|
NETWORTH |
|
|
|
|
21 |
Capital |
2.915 |
7.135 |
8.555 |
|
|
|
|
|
|
|
22 |
General reserve |
-- |
-- |
-- |
|
|
|
|
|
|
|
23 |
Revaluation reserve |
-- |
-- |
-- |
|
|
|
|
|
|
|
24 |
Net Surplus |
0.720 |
1.620 |
2.005 |
|
|
|
|
|
|
|
25 |
Drawing / Addition |
3.500 |
(0.200) |
(0.250) |
|
|
|
|
|
|
|
26 |
NETWORTH |
7.135 |
8.555 |
10.310 |
|
|
|
|
|
|
|
26 |
TOTAL LIABILITIES |
19.886 |
20.118 |
20.357 |
|
|
|
|
|
|
|
|
ASSETS |
|
|
|
|
|
CURRENT ASSETS |
|
|
|
|
27 |
Cash and Bank balances |
0.600 |
0.675 |
0.750 |
|
|
|
|
|
|
|
28 |
Government and other trustee securities |
-- |
-- |
-- |
|
|
|
|
|
|
|
29 |
Fixed deposits with banks and Investment |
-- |
-- |
-- |
|
|
|
|
|
|
|
30 |
Domestic receivables including BP/BD |
4.136 |
4.193 |
4.289 |
|
|
|
|
|
|
|
31 |
Export receivables including BP/BD |
-- |
-- |
-- |
|
|
|
|
|
|
|
32 |
Deferred receivables [due within one year] |
-- |
-- |
-- |
|
|
|
|
|
|
|
33 |
Imported raw material |
-- |
-- |
-- |
|
|
|
|
|
|
|
34 |
Indigenous raw material |
-- |
-- |
-- |
|
|
|
|
|
|
|
35 |
Stock in process |
1.468 |
1.525 |
1.560 |
|
|
|
|
|
|
|
36 |
Finished Goods |
-- |
-- |
-- |
|
|
|
|
|
|
|
37 |
Imported consumables |
-- |
-- |
-- |
|
|
|
|
|
|
|
38 |
Indigenous consumables |
-- |
-- |
-- |
|
|
|
|
|
|
|
39 |
Advances to suppliers |
-- |
-- |
-- |
|
|
|
|
|
|
|
40 |
Net advance payment of taxes [if positive] |
-- |
-- |
-- |
|
|
|
|
|
|
|
41 |
Other current assets |
0.433 |
0.592 |
0.683 |
|
|
|
|
|
|
|
42 |
TOTAL CURRENT ASSETS |
6.636 |
6.984 |
7.282 |
|
|
|
|
|
|
|
|
FIXED ASSETS |
|
|
|
|
43 |
Gross block [land and building, machinery] |
14.053 |
14.053 |
14.053 |
|
|
|
|
|
|
|
44 |
Add: Capital expenditure in work-in-process |
-- |
-- |
-- |
|
|
|
|
|
|
|
45 |
Depreciation to date |
0.803 |
2.519 |
3.978 |
|
|
|
|
|
|
|
46 |
NET BLOCK |
13.250 |
11.534 |
10.075 |
|
|
|
|
|
|
|
|
OTHER NON-CURRENT ASSETS |
|
|
|
|
47 |
Investments in sub. Cos./ affiliates |
-- |
-- |
-- |
|
|
|
|
|
|
|
48 |
Investment in others |
-- |
1.600 |
3.000 |
|
|
|
|
|
|
|
49 |
Advance to suppliers of capital goods and
contractors |
-- |
-- |
-- |
|
|
|
|
|
|
|
50 |
Deferred receivables [maturing after a year] |
-- |
-- |
-- |
|
|
|
|
|
|
|
51 |
Other non-current investments |
-- |
-- |
-- |
|
|
|
|
|
|
|
52 |
Non-consumable stores and spares |
-- |
-- |
-- |
|
|
|
|
|
|
|
53 |
TOTAL OTHER NON-CURRENT ASSETS |
-- |
1.600 |
3.000 |
|
|
|
|
|
|
|
|
INTANGIBLES ASSETS |
|
|
|
|
54 |
Preliminary expenses |
-- |
-- |
-- |
|
|
|
|
|
|
|
55 |
Deferred revenue expenditure |
-- |
-- |
-- |
|
|
|
|
|
|
|
56 |
Other intangibles [patents, goodwill, etc.] |
-- |
-- |
-- |
|
|
|
|
|
|
|
57 |
TOTAL INTANGIBLES ASSETS |
-- |
-- |
-- |
|
|
|
|
|
|
|
58 |
TOTAL ASSETS |
19.886 |
20.118 |
20.357 |
|
|
|
|
|
|
|
59 |
Tangible Networth [TNW] |
7.135 |
8.555 |
10.310 |
|
|
|
|
|
|
|
60 |
Net Working Capital [NWC] |
1.775 |
1.779 |
2.061 |
|
|
|
|
|
|
|
|
Movement of TNW |
|
|
|
|
61 |
Opening TNW |
2.915 |
7.135 |
8.555 |
|
|
|
|
|
|
|
62 |
Plough back of profit |
0.720 |
1.620 |
2.005 |
|
|
|
|
|
|
|
63 |
Increase in capital / reserves |
3.500 |
(0.200) |
(0.250) |
|
|
|
|
|
|
|
64 |
Intangibles written off |
-- |
-- |
-- |
|
|
|
|
|
|
|
65 |
Less: Increase in Revaluation Reserve |
-- |
-- |
-- |
|
|
|
|
|
|
|
66 |
Closing TNW |
7.135 |
8.555 |
10.310 |
|
|
|
|
|
|
|
67 |
Current Ratio |
1.37 |
1.34 |
1.39 |
|
|
|
|
|
|
|
68 |
Debt/ Equity |
1.11 |
0.74 |
0.47 |
|
|
|
|
|
|
|
69 |
TOL/ Equity
|
1.79 |
1.35 |
0.97 |
|
|
|
|
|
|
|
70 |
Current Assets/ Tangible Assets |
0.33 |
0.35 |
0.36 |
|
|
|
|
|
|
|
71 |
ROCE [PBDIT incl. other income / TTA] |
0.11 |
0.26 |
0.27 |
|
|
|
|
|
|
|
72 |
Inventory + Receivables as days of net sales
|
104 |
96 |
96 |
------------------------------------------------------------------------------------------------------------------------------
WORKING
CAPITAL / BANK BORROWING ASSESSMENTS
(RS. IN MILLIONS)
|
SR. NO. |
PARTICULARS |
2014-15 ESTIMATED |
2015-16 PROJECTED |
2016-17 PROJECTED |
|
|
|
|
|
|
|
|
WORKING CAPITAL
ASSESSMENT |
|
|
|
|
1 |
Stock of Imported RM – Days Consumption |
-- |
-- |
-- |
|
|
|
|
|
|
|
2 |
Stock of Indigenous RM – Days Consumption |
-- |
-- |
-- |
|
|
|
|
|
|
|
3 |
Imported Consumables - Days Consumption |
-- |
-- |
-- |
|
|
|
|
|
|
|
4 |
Indigenous Consumables - Days Consumption |
-- |
-- |
-- |
|
|
|
|
|
|
|
5 |
Stock in process – [Days of Cost of
Production] |
71.00 |
32.00 |
32.00 |
|
|
|
|
|
|
|
6 |
Finished Goods – [Days Cost of Sales] |
-- |
-- |
-- |
|
|
|
|
|
|
|
7 |
Total Inventory |
1.468 |
1.525 |
1.560 |
|
|
|
|
|
|
|
8 |
Total Inventory / Sales [Days] |
28 |
26 |
26 |
|
|
|
|
|
|
|
9 |
Domestic Receivables [Days Gross domestic
sales] |
76 |
71 |
71 |
|
|
|
|
|
|
|
10 |
Export Receivables [Days Export] |
-- |
-- |
-- |
|
|
|
|
|
|
|
11 |
Total Receivables |
4.136 |
4.193 |
4.289 |
|
|
|
|
|
|
|
12 |
Total Receivables/ Gross Sales [Days] |
76 |
71 |
71 |
|
|
|
|
|
|
|
13 |
Creditors – [Days Consumption] |
15 |
16 |
16 |
|
|
|
|
|
|
|
14 |
Total Current Assets |
6.636 |
6.984 |
7.282 |
|
|
|
|
|
|
|
|
Financed by |
|
|
|
|
1 |
Sundry Creditors % of Current Assets |
6.27% |
7.23% |
7.09% |
|
|
|
|
|
|
|
2 |
Other Current Liabilities % of Current
Assets |
21.78% |
24.34% |
23.40% |
|
|
|
|
|
|
|
3 |
Bank Finance % of Current Assets |
45.21% |
42.95% |
41.20% |
|
|
|
|
|
|
|
4 |
NWC % of Current Assets |
26.75% |
25.48% |
28.31% |
|
|
|
|
|
|
|
|
By MPBS Method |
|
|
|
|
1 |
Total Current Assets |
6.636 |
6.984 |
7.282 |
|
|
|
|
|
|
|
2 |
Other Current Liabilities |
1.861 |
2.205 |
2.220 |
|
|
|
|
|
|
|
3 |
Working Capital Gap |
4.775 |
4.779 |
5.061 |
|
|
|
|
|
|
|
4 |
Net Working Capital |
1.775 |
1.779 |
2.061 |
|
|
|
|
|
|
|
5 |
25% margin over Current Assets |
1.700 |
1.700 |
1.800 |
|
|
|
|
|
|
|
6 |
Item 3 – 5 |
3.100 |
3.000 |
3.200 |
|
|
|
|
|
|
|
7 |
Bank finance |
3.000 |
3.000 |
3.000 |
------------------------------------------------------------------------------------------------------------------------------
FUND
FLOW STATEMENT
(RS. IN MILLIONS)
|
SR. NO. |
PARTICULARS |
2014-15 ESTIMATED |
2015-16 PROJECTED |
2016-17 PROJECTED |
|
|
|
|
|
|
|
1 |
LONG TERM SOURCES |
|
|
|
|
|
Profit after tax |
0.720 |
1.620 |
2.005 |
|
|
|
|
|
|
|
|
Depreciation |
0.264 |
1.716 |
1.459 |
|
|
|
|
|
|
|
|
Intangibles written off |
-- |
-- |
-- |
|
|
|
|
|
|
|
|
Increase in capital and reserves |
3.500 |
-- |
-- |
|
|
|
|
|
|
|
|
Increase in term liability |
9.394 |
-- |
0.000 |
|
|
|
|
|
|
|
|
Decrease in fixed assets |
-- |
-- |
-- |
|
|
|
|
|
|
|
|
Decrease in other non-current assets |
-- |
-- |
-- |
|
|
|
|
|
|
|
|
TOTAL |
13.878 |
3.336 |
3.463 |
|
|
|
|
|
|
|
2 |
LONG TERM USES |
|
|
|
|
|
Net Loss |
-- |
-- |
-- |
|
|
|
|
|
|
|
|
Increase in Intangibles |
-- |
-- |
-- |
|
|
|
|
|
|
|
|
Decrease in Capital and reserves / Share
Buyback |
-- |
0.200 |
0.250 |
|
|
|
|
|
|
|
|
Term loan repayments |
1.882 |
1.276 |
1.531 |
|
|
|
|
|
|
|
|
Unsecured loan repayment |
-- |
-- |
-- |
|
|
|
|
|
|
|
|
Increase in fixed assets |
10.399 |
-- |
-- |
|
|
|
|
|
|
|
|
Increase in non-current assets |
-- |
1.600 |
1.400 |
|
|
|
|
|
|
|
|
Increase in intangibles |
-- |
-- |
-- |
|
|
|
|
|
|
|
|
Dividend paid/ drawing |
-- |
-- |
-- |
|
|
|
|
|
|
|
|
Surplus / Deficit |
12.281 |
3.076 |
3.181 |
|
|
|
|
|
|
|
3 |
SHORT TERM SOURCES |
|
|
|
|
|
Increase in Bank Borrowings |
2.494 |
-- |
-- |
|
|
|
|
|
|
|
|
Increase in Other Current Liability |
0.465 |
0.088 |
0.016 |
|
|
|
|
|
|
|
|
Decrease in Inventory |
-- |
-- |
-- |
|
|
|
|
|
|
|
|
Decrease in receivables |
-- |
-- |
-- |
|
|
|
|
|
|
|
|
Decrease in Cash / Deposits/ Government
Securities |
-- |
-- |
-- |
|
|
|
|
|
|
|
|
Decrease in other current assets |
-- |
-- |
-- |
|
|
|
|
|
|
|
|
TOTAL |
2.959 |
0.088 |
0.016 |
|
|
|
|
|
|
|
4 |
SHORT TERM USES |
|
|
|
|
|
Increase in Inventory |
1.031 |
0.057 |
0.035 |
|
|
|
|
|
|
|
|
Increase in receivables |
3.183 |
0.057 |
0.096 |
|
|
|
|
|
|
|
|
Increase in Cash / Deposits / Government
Securities |
0.341 |
0.075 |
0.075 |
|
|
|
|
|
|
|
|
Increase in other current assets |
0.002 |
0.159 |
0.091 |
|
|
|
|
|
|
|
|
Decrease in other current liability |
-- |
-- |
-- |
|
|
|
|
|
|
|
|
Decrease in bank borrowings |
-- |
-- |
-- |
|
|
|
|
|
|
|
|
TOTAL |
4.556 |
0.348 |
0.297 |
|
|
|
|
|
|
|
|
SUMMARY OF FUND FLOW ANALYSIS |
|
|
|
|
|
Long term sources |
13.878 |
3.336 |
3.463 |
|
|
|
|
|
|
|
|
Long term uses |
12.281 |
3.076 |
3.181 |
|
|
|
|
|
|
|
|
Surplus / Deficit |
1.597 |
0.260 |
0.282 |
|
|
|
|
|
|
|
|
Short term sources |
2.959 |
0.088 |
0.016 |
|
|
|
|
|
|
|
|
Short term uses |
4.556 |
0.348 |
0.297 |
|
|
|
|
|
|
|
|
Surplus / Deficit |
(1.597) |
(0.260) |
(0.282) |
------------------------------------------------------------------------------------------------------------------------------
RATIO
ANALYSIS
(RS. IN MILLIONS)
|
SR. NO. |
PARTICULARS |
2014-15 ESTIMATED |
2015-16 PROJECTED |
2016-17 PROJECTED |
|
|
|
|
|
|
|
|
RATIOS |
|
|
|
|
1 |
Growth in sales |
38% |
130% |
2% |
|
|
|
|
|
|
|
2 |
Gross Profit Ratio |
28% |
27% |
27% |
|
|
|
|
|
|
|
3 |
PBDIT / Sales |
11.06% |
10.82% |
13.09% |
|
|
|
|
|
|
|
4 |
Operating Profit/ Sales |
11.06% |
10.82% |
13.09% |
|
|
|
|
|
|
|
5 |
PBT/ Sales |
11.06% |
10.82% |
13.09% |
|
|
|
|
|
|
|
6 |
PAT/ Sales |
7.65% |
7.48% |
9.05% |
|
|
|
|
|
|
|
7 |
Cash Accruals / Sales |
16.17% |
15.40% |
15.63% |
|
|
|
|
|
|
|
8 |
Sales / Equity |
1.32 |
2.53 |
2.15 |
|
|
|
|
|
|
|
9 |
Sales / TTA |
0.47 |
1.08 |
1.09 |
|
|
|
|
|
|
|
10 |
Interest Coverage [Interest/ PBDIT] |
18.23% |
23.84% |
19.68% |
|
|
|
|
|
|
|
11 |
PBDIT / Interest [Times] |
5.48 |
4.20 |
5.08 |
|
|
|
|
|
|
|
12 |
Deferred debt / Equity |
1.11 |
0.74 |
0.47 |
|
|
|
|
|
|
|
13 |
TOL / Equity |
1.79 |
1.35 |
0.97 |
|
|
|
|
|
|
|
14 |
Current Ratio [CA/ CL] |
1.37 |
1.34 |
1.39 |
|
|
|
|
|
|
|
15 |
Current Ratio excluding TL installments |
1.85 |
1.90 |
1.97 |
|
|
|
|
|
|
|
16 |
CA / TTA [%] |
33.37% |
34.72% |
35.77% |
|
|
|
|
|
|
|
17 |
Inventory + Receivables as days of net sales
|
217 |
96 |
96 |
|
|
|
|
|
|
|
18 |
Bank borrowings / Current assets |
45.21% |
42.95% |
41.20% |
|
|
|
|
|
|
|
19 |
RM content in sales |
52.09% |
53.38% |
53.43% |
|
|
|
|
|
|
|
20 |
ROCE [PBDIT including Other Income / TTA] |
0.11 |
0.26 |
0.27 |
|
|
|
|
|
|
|
21 |
Debt Service Coverage Ratio Calculations |
|
|
|
|
|
Cash Accruals |
1.523 |
3.336 |
3.463 |
|
|
|
|
|
|
|
|
Interest on TL/ deferred loans |
0.411 |
1.271 |
1.068 |
|
|
|
|
|
|
|
|
Repayment obligations of TL |
1.579 |
1.276 |
1.531 |
|
|
|
|
|
|
|
|
Repayment of other deferred loans |
-- |
-- |
-- |
|
|
|
|
|
|
|
|
Total Repayment |
1.990 |
2.547 |
2.600 |
|
|
|
|
|
|
|
|
Net Debt Service Coverage Ratio [DSCR] |
0.96 |
2.61 |
2.26 |
|
|
|
|
|
|
|
|
Gross Debt Service Coverage Ratio [DSCR] |
0.97 |
1.81 |
1.74 |
|
|
|
|
|
|
|
22 |
Security Coverage Ratio |
|
|
|
|
|
Net Block |
13.250 |
11.534 |
10.074 |
|
|
|
|
|
|
|
|
Term Loan outstanding [including
installment] |
6.891 |
5.615 |
4.084 |
|
|
|
|
|
|
|
|
Security Cover available [NB – TL / NB] |
48% |
51% |
59% |
|
|
|
|
|
|
|
23 |
Security cover including Collateral Security |
|
|
|
|
|
Security cover available [NB + Collateral -
TL] / NB |
48% |
51% |
59% |
------------------------------------------------------------------------------------------------------------------------------
KEY
INDICATORS
(RS. IN MILLIONS)
|
SR. NO. |
PARTICULARS |
2014-15 ESTIMATED |
2015-16 PROJECTED |
2016-17 PROJECTED |
|
|
|
|
|
|
|
1 |
Net Sales |
9.417 |
21.662 |
22.160 |
|
|
|
|
|
|
|
2 |
Operating Profit |
1.042 |
2.344 |
2.901 |
|
|
|
|
|
|
|
3 |
(Net) Other Income |
-- |
-- |
-- |
|
|
|
|
|
|
|
4 |
PBDIT / Sales |
11.06% |
10.82% |
13.09% |
|
|
|
|
|
|
|
5 |
PBT / Sales |
11.06% |
10.82% |
13.09% |
|
|
|
|
|
|
|
6 |
PAT |
0.720 |
1.620 |
2.005 |
|
|
|
|
|
|
|
7 |
PAT / Net Sales |
15.23 |
33.36 |
34.63 |
|
|
|
|
|
|
|
8 |
Cash Accruals |
1.523 |
3.336 |
3.463 |
|
|
|
|
|
|
|
9 |
Cash Accruals / Sales |
16.17% |
15.40% |
15.63% |
|
|
|
|
|
|
|
10 |
Paid up Capital |
2.915 |
7.135 |
8.555 |
|
|
|
|
|
|
|
11 |
TNW |
7.135 |
8.555 |
10.310 |
|
|
|
|
|
|
|
12 |
TOL / TNW |
1.79 |
1.35 |
0.97 |
|
|
|
|
|
|
|
13 |
C/R |
1.37 |
1.34 |
1.39 |
|
|
|
|
|
|
|
14 |
C/R excluding T/L installments due in 1 year
|
1.85 |
1.90 |
1.97 |
|
|
|
|
|
|
|
15 |
Net Sales / TTA [Times] |
0.47 |
1.08 |
1.09 |
|
|
|
|
|
|
|
16 |
PBT/ TTA [%] |
5.24% |
11.65% |
14.25% |
|
|
|
|
|
|
|
17 |
Operating Costs / Sales [%] |
88.94% |
89.18% |
86.91% |
|
|
|
|
|
|
|
18 |
Bank Finance / Current Assets [%] |
45.21% |
42.95% |
41.20% |
|
|
|
|
|
|
|
19 |
Inventory + Receivables / NS [Days] |
217 |
96 |
96 |
|
|
|
|
|
|
|
20 |
NWC / CA [%] |
25.75% |
25.48% |
28.31% |
------------------------------------------------------------------------------------------------------------------------------
PROJECT
REPORT
Subject is a proprietorship firm of Mrs.
Chandrika Shivlal Rajani. She is ding Textile business since more than 3 years
with the support of his husband Mr. Shivlal U. Rajani and their relatives are
also engaged in textile business. Promoters are having good financial
background as well as good contact in the textile market. Hence promoter is
having environment and experience to expansion own unit. And now she is
interested to expansion her business with installation of eight china made
imported Rapier Loom machines.
Surat is a hub of textile industries. The
textile industries have developed in Surat since last 100 years. The stepwise
development in textile industries earns lots of profit to Surat based textile
industrialist. Surat having a typical characteristic for the development of
textile industries. 24 hours continuous production for all the years is a main
and prime factor for the development of the Surat textile industries. The
industries having a base with more than 100 years. Hence Surat textile sector
have been shown various ups and down in this industries in a crucial time.
Surat textile sector having characteristic is to change/ modify/ upgrade their
technical skill time to time and as per the requirements. They added
step-by-step value addition in this sector and developed themselves for long
run. Initially manually operated looms were installed at Surat. Nowadays power
looms, automatic rapier looms, Air Jet, Water Jet Looms have taken the place of
manually operated looms. At the same time Two-for-One [TFO] machines, Texturing
Machines, Crimping Machines have also take the place of old designed Twisting Machines, from the raw yam, Surat
based textile sector producing high quality silk sarees and dress material in
Surat.
Surat’s textile sector always thinks for
innovation and creativity and adopted various new production
techniques/installing new machines for value addition.
Nowadays Surat based textile sector is
preparing for a technical up gradation to meet with challenges after opening of
GATE karar. The GATE will open for entire global market from 31.03.2005. Hence
the export quota system will be denied. On the opening of entire global gate
after the effect of GATE karar. There are huge chances for weaving value added
product in the international market.
To meet with the challenges of international
market the promoters of the project have decided to produce some weaving value
added product in textile sector this will be possible after installation of
imported Rapier Loom machines for this project. This rapier looms machine added
the quality weaving of the product by more than 100%, hence there is a good
scope of weaving-based project in Surat.
Proponent is having adequate experience of the
textile business. Looking to the rich experience and contacts of the promoters
it is presume that unit will run very smoothly.
------------------------------------------------------------------------------------------------------------------------------
NETWORTH
STATEMENT
MRS.
CHANDRIKA SHIVLAL RAJANI
(RS. IN MILLIONS)
[AS ON 03.11.2014]
TOTAL VALUE OF
IMMOVABLE PROPERTY
|
NATURE OF PROPERTY |
BOOK VALUE |
MARKET VALUE |
|
|
|
|
|
Plant and Machinery |
2.996 |
2.996 |
|
|
|
|
|
TOTAL [A] |
|
2.996 |
TOTAL VALUE OF
OTHER ASSETS
|
NATURE OF PROPERTY |
BOOK VALUE |
MARKET VALUE |
|
|
|
|
|
Gold Ornaments |
0.059 |
0.059 |
|
|
|
|
|
FD with Bank of Baroda |
0.032 |
0.032 |
|
|
|
|
|
TOTAL [B] |
|
0.091 |
TOTAL LIABILITIES
|
BORROWED FROM |
AMOUNT IN
MILLIONS |
SECURITIES
OFFERED |
PURPOSE |
OUTSTANDING AS
ON DATE |
|
|
|
|
|
|
|
Bank of Baroda |
3.100 |
Machinery as Primary |
Machinery |
0.000 |
|
|
|
|
|
|
|
Bank of Baroda |
1.000 |
Stock and Book Debt |
Working Capital |
0.000 |
|
|
|
|
|
|
|
TOTAL [C] |
|
|
|
0.000 |
|
NETWORTH [A + B + C] |
RS. 3.087 MILLIONS |
------------------------------------------------------------------------------------------------------------------------------
VALUATION REPORT
(GENERAL DETAILS)
|
Purpose for which valuation is made |
To Assess Fair Market Value for Bank of
India, Gopipura Branch, Surat |
||||||||||||||||||||||||||||||
|
|
|
||||||||||||||||||||||||||||||
|
Date as on which valuation is made |
05.11.2014 |
||||||||||||||||||||||||||||||
|
|
|
||||||||||||||||||||||||||||||
|
Name of the Allote |
Star Fabrics Mrs. Chandrika Shivlal Rajani, Proprietor |
||||||||||||||||||||||||||||||
|
|
|
||||||||||||||||||||||||||||||
|
If the property is under ownership/ co-owners, share of each such owner are the undivided? |
Individual |
||||||||||||||||||||||||||||||
|
|
|
||||||||||||||||||||||||||||||
|
Brief description of the property |
Industrial land with shade type property |
||||||||||||||||||||||||||||||
|
|
|
||||||||||||||||||||||||||||||
|
Location,
Street, Ward No. |
Plot No. P/38, Sayan Textile Park, Nera RJD
Park, Surat Hazira Road, Ichchapore, Surat. |
||||||||||||||||||||||||||||||
|
|
|
||||||||||||||||||||||||||||||
|
Survey/
Plot No. of land |
R.S. No. 55 paikee, 56, 60/1, 60/2, 59, 61,
62, 63, 64, 65 paikee, 66, 67, 69 paikee, 70 paikee, 71 + 69, 71 + 69/4, 72 +
73 + 74 + 75 paikee, 96 paikee, 97 paikee, 98 paikee, 99 + 100 + 101 + 102,
103, 106, 104 + 105 paikee, 170 paikee, 112 paikee, 113 paikee, 114, 115/1,
115/2, 116, 117 + 118 + 119 paikee, 127 paikee, 128 paikee, 126 paikee, 149 +
150/1, 147 + 148 + 146/1/ paikee, 151 paikee, Moje-Ichchapore, Hazira-Adajan
Road, Tal-Choryasi, Surat. |
||||||||||||||||||||||||||||||
|
|
|
||||||||||||||||||||||||||||||
|
Is
the property situated in the Residential/ Commercial/ Mixed Area/ Industrial
area? |
Industrial Area |
||||||||||||||||||||||||||||||
|
|
|
||||||||||||||||||||||||||||||
|
Classification
of Locality – High class/ Middle class/ Poor class |
Industrial Class |
||||||||||||||||||||||||||||||
|
|
|
||||||||||||||||||||||||||||||
|
Proximity
to civic amenities like School, Hospital, offices, markets, cinema etc. |
All amenities are available at distance |
||||||||||||||||||||||||||||||
|
|
|
||||||||||||||||||||||||||||||
|
Means
and proximity to surface communication by which the locality is served |
By Road Transportation |
||||||||||||||||||||||||||||||
|
|
|
||||||||||||||||||||||||||||||
|
LAND |
|
||||||||||||||||||||||||||||||
|
Area
of land supported by documentary proof, dimensions and physical features |
Land Area; 189.04 Sq. mt. or 226 Sq. Yds. |
||||||||||||||||||||||||||||||
|
|
|
||||||||||||||||||||||||||||||
|
Roads,
streets of lanes on which the land is abutting |
Plot No. P/38, Sayan Textile Park, Nera RJD
Park, Surat Hazira Road, Ichchapore, Surat. |
||||||||||||||||||||||||||||||
|
|
|
||||||||||||||||||||||||||||||
|
It
is freehold or leasehold land? |
Leasehold Land |
||||||||||||||||||||||||||||||
|
|
|
||||||||||||||||||||||||||||||
|
If
leasehold, the surname of lessor/ lessee, nature of lease, dates of
commencement and termination of lease and terms of renewal of lease (i)
Initial Premium (ii)
Ground rent payable per annum (iii)
Unearned increase payable to the lessor in the event of sale of transfer |
As per lease deed |
||||||||||||||||||||||||||||||
|
|
|
||||||||||||||||||||||||||||||
|
Is
there any restrictive covenant in regard to use of land? |
As per lease deed |
||||||||||||||||||||||||||||||
|
|
|
||||||||||||||||||||||||||||||
|
Are
there any agreements of easements? |
As per lease deed |
||||||||||||||||||||||||||||||
|
|
|
||||||||||||||||||||||||||||||
|
Does
the land fall in an area included in any town planning plan of govt. or any
statutory body? |
As per lease deed |
||||||||||||||||||||||||||||||
|
|
|
||||||||||||||||||||||||||||||
|
Has
any contribution been made towards development or is any demand for such
contributions still outstanding |
As per lease deed |
||||||||||||||||||||||||||||||
|
|
|
||||||||||||||||||||||||||||||
|
Has
the whole or part of the land been notified for acquisition by government? or
any statutory? Give the date of the notification. |
As per lease deed |
||||||||||||||||||||||||||||||
|
|
|
||||||||||||||||||||||||||||||
|
IMPROVEMENTS
|
|
||||||||||||||||||||||||||||||
|
Furnish
technical details of the building on a separate sheet |
As per Technical details |
||||||||||||||||||||||||||||||
|
|
|
||||||||||||||||||||||||||||||
|
(a)
Is the building owner – occupied / tenanted/ both? (b)
If party owner-occupied, specify portion and extent of area under owner
occupation |
Occupied by Allote NA |
||||||||||||||||||||||||||||||
|
|
|
||||||||||||||||||||||||||||||
|
What
is the Floor Space Index permissible and percentage actually utilized? |
NA |
||||||||||||||||||||||||||||||
|
|
|
||||||||||||||||||||||||||||||
|
RENTS |
|
||||||||||||||||||||||||||||||
|
(i)
Names of tenant/ lessees/ licensees, etc. (ii)
Portion in their occupation (iii)
Monthly or annual rent/ compensation/ licence fee, etc. paid by each (iv)
Gross amount received for the whole property |
Not Applicable |
||||||||||||||||||||||||||||||
|
|
|
||||||||||||||||||||||||||||||
|
Are
any of the occupants related to, or close business associates, of the owner? |
NA |
||||||||||||||||||||||||||||||
|
|
|
||||||||||||||||||||||||||||||
|
Is
separate amount being recovered for the use of fixtures, like fans, geysers, refrigeration’s,
cooking ranges, built-in wardrobes, etc. or for service charges? If so, give
details |
NA |
||||||||||||||||||||||||||||||
|
|
|
||||||||||||||||||||||||||||||
|
Give
details of water and electricity charges, if any, to be borne by the owner |
NA |
||||||||||||||||||||||||||||||
|
|
|
||||||||||||||||||||||||||||||
|
Has
the tenant to bear the whole or part of the cost of repairs and maintenance?
Give Particulars |
NA |
||||||||||||||||||||||||||||||
|
|
|
||||||||||||||||||||||||||||||
|
If
a lift is installed, who has to bear the cost of maintenance and operation
owner or tenant? |
NA |
||||||||||||||||||||||||||||||
|
|
|
||||||||||||||||||||||||||||||
|
If
a pump is installed, who has to bear the cost of maintenance and operation -
owner or tenant? |
NA |
||||||||||||||||||||||||||||||
|
|
|
||||||||||||||||||||||||||||||
|
Who
has to bear the cost of electricity charges for lighting of common space like
entrance hall, stairs, passages, compound, etc. – owner or tenant? |
NA |
||||||||||||||||||||||||||||||
|
|
|
||||||||||||||||||||||||||||||
|
What
is the amount of property tax? Who is to bear it? Give details with
documentary proof |
NA |
||||||||||||||||||||||||||||||
|
|
|
||||||||||||||||||||||||||||||
|
Is
the building insured? If so, give the policy no., amount for which it is
insured and the annual premium |
NA |
||||||||||||||||||||||||||||||
|
|
|
||||||||||||||||||||||||||||||
|
Is
there any dispute between landlord and tenant regarding rent pending in a
court of law |
NA |
||||||||||||||||||||||||||||||
|
|
|
||||||||||||||||||||||||||||||
|
Has
any standard rent been fixed for the permission under any law relating to the
control or rent |
NA |
||||||||||||||||||||||||||||||
|
|
|
||||||||||||||||||||||||||||||
|
SALES |
|
||||||||||||||||||||||||||||||
|
Give instances of sales of immovable property in the locality on a separate sheet, indicating the name and address of the property, registration No., sale price and area of land sold |
Considering the location of the property its
Industrial utility, Potential demand factors affecting the value and current
prevailing Market rates, Rates as Rs. 20000/- per Sq. Yds. After local
enquiry. |
||||||||||||||||||||||||||||||
|
|
|
||||||||||||||||||||||||||||||
|
Land rate adopted in this valuation |
Considering the location of the property its
Industrial utility, Potential demand factors affecting the value and current prevailing
Market rates, Rates as Rs. 20000/- per Sq. Yds. After local enquiry. |
||||||||||||||||||||||||||||||
|
|
|
||||||||||||||||||||||||||||||
|
If sale instances are not relied upon the basis of arriving at the land rate |
Considering the location of the property its
Industrial utility, Potential demand factors affecting the value and current
prevailing Market rates, Rates as Rs. 20000/- per Sq. Yds. After local
enquiry. |
||||||||||||||||||||||||||||||
|
|
|
||||||||||||||||||||||||||||||
|
COST OF CONSTRUCTION |
|
||||||||||||||||||||||||||||||
|
Year of commencement of construction and year of completion |
2014 |
||||||||||||||||||||||||||||||
|
|
|
||||||||||||||||||||||||||||||
|
What was the method of construction - by contract/ by employing labour directly/ both? |
By employing labours directly |
||||||||||||||||||||||||||||||
|
|
|
||||||||||||||||||||||||||||||
|
For items of work done on contract, produce copies of agreements |
NA |
||||||||||||||||||||||||||||||
|
|
|
||||||||||||||||||||||||||||||
|
For items of work done by engaging labour directly, give basic rates of materials and labour supported by documentary proof |
Labour directly |
||||||||||||||||||||||||||||||
|
|
|
||||||||||||||||||||||||||||||
|
PART
II – VALUATION The property under consideration for valuation
is an Industrial land with shed type property bearing Plot No. P/38, Sayan
Textile Park, Nera RJD Park, Surat Hazira Road, Ichchapore, Surat. It is
having CC flooring, steel shutter and aluminum section window with glass.
Considering the location, locality factors affecting the Market value of the
property. They value the property as under: LAND AREA AND ITS VALUE
BUILT UP AREA AND ITS VALUE
|
|||||||||||||||||||||||||||||||
|
TECHNICAL
DETAILS |
|||||||||||||||||||||||||||||||
|
No
of floors and height of floor |
Ground + 1 Floor |
||||||||||||||||||||||||||||||
|
|
|
||||||||||||||||||||||||||||||
|
Plinth
area floor-wise [As per IS: 3861-1966] |
As per Valuation |
||||||||||||||||||||||||||||||
|
|
|
||||||||||||||||||||||||||||||
|
Year
of Construction |
2014 |
||||||||||||||||||||||||||||||
|
|
|
||||||||||||||||||||||||||||||
|
Estimated
future life |
50 Years approx. depending upon maintenance
of the building in future. |
||||||||||||||||||||||||||||||
|
|
|
||||||||||||||||||||||||||||||
|
Type of construction – load bearing walls/ RCC
frame/ Steel Frame |
RCC Structure |
||||||||||||||||||||||||||||||
|
|
|
||||||||||||||||||||||||||||||
|
Type
of foundations |
RCC Footing |
||||||||||||||||||||||||||||||
|
|
|
||||||||||||||||||||||||||||||
|
Walls
: (a)
Ground Floor (b)
Basement and Plinth (c)
Super Structure above Ground Floor |
Brick masonry in cement mortar |
||||||||||||||||||||||||||||||
|
|
|
||||||||||||||||||||||||||||||
|
Partitions
|
Brick masonry in cement mortar |
||||||||||||||||||||||||||||||
|
|
|
||||||||||||||||||||||||||||||
|
Door
and Windows (Floor Wise) |
Steel shutter and aluminum section windows
with glass |
||||||||||||||||||||||||||||||
|
|
|
||||||||||||||||||||||||||||||
|
Flooring
|
CC flooring |
||||||||||||||||||||||||||||||
|
|
|
||||||||||||||||||||||||||||||
|
Finishing |
Cement plaster with lapi |
||||||||||||||||||||||||||||||
|
|
|
||||||||||||||||||||||||||||||
|
Roofing
and Terracing |
RCC Roofing
|
||||||||||||||||||||||||||||||
|
|
|
||||||||||||||||||||||||||||||
|
Special
architectural or decorative features, if any |
NA |
||||||||||||||||||||||||||||||
|
|
|
||||||||||||||||||||||||||||||
|
(i)
Internal Wiring – Surface or Concealed (ii)
Class of fitting – Superior/ Ordinary/ Poor |
Open wiring Ordinary |
||||||||||||||||||||||||||||||
|
|
|
||||||||||||||||||||||||||||||
|
Compound
Wall (i)
Height (ii)
Length (iii)
Type of Construction |
Existing
|
||||||||||||||||||||||||||||||
|
|
|
||||||||||||||||||||||||||||||
|
No.
of Lifts and Capacity |
NA |
||||||||||||||||||||||||||||||
|
|
|
||||||||||||||||||||||||||||||
|
Underground
sump capacity and type of construction |
NA |
||||||||||||||||||||||||||||||
|
|
|
||||||||||||||||||||||||||||||
|
Overhead
Tank |
NA |
||||||||||||||||||||||||||||||
|
|
|
||||||||||||||||||||||||||||||
|
Pumps
No. and their horse power |
NA |
||||||||||||||||||||||||||||||
|
|
|
||||||||||||||||||||||||||||||
|
Roads
and paving within the compound, approximate area and type of paving |
CC Road |
||||||||||||||||||||||||||||||
|
|
|
||||||||||||||||||||||||||||||
|
Sewage
disposal where connected to public sewers. if septic tanks provided no. and
capacity. |
Drainage system available |
||||||||||||||||||||||||||||||
------------------------------------------------------------------------------------------------------------------------------
TRADE REFERENCE
· B Dobariya and Company
Address: B-609, Diamond World, Mini Bazaar, Varachha
Road, Surat – 395006, Gujarat, India
Contact Person: Mr. Bhavesh Dobariya
[91-9825331103]
------------------------------------------------------------------------------------------------------------------------------
CMT REPORT (Corruption, Money Laundering & Terrorism]
The Public Notice information has been collected from various sources
including but not limited to: The Courts, India Prisons Service,
Interpol, etc.
1] INFORMATION ON
DESIGNATED PARTY
No exist designating subject or any of its beneficial owners,
controlling shareholders or senior officers as terrorist or terrorist
organization or whom notice had been received that all financial transactions
involving their assets have been blocked or convicted, found guilty or against
whom a judgement or order had been entered in a proceedings for violating
money-laundering, anti-corruption or bribery or international economic or
anti-terrorism sanction laws or whose assets were seized, blocked, frozen or
ordered forfeited for violation of money laundering or international anti-terrorism
laws.
2] Court Declaration :
No records exist to suggest that subject is
or was the subject of any formal or informal allegations, prosecutions or other
official proceeding for making any prohibited payments or other improper
payments to government officials for engaging in prohibited transactions or
with designated parties.
3] Asset Declaration :
No records exist to suggest that the property or assets of the subject
are derived from criminal conduct or a prohibited transaction.
4] Record on Financial
Crime :
Charges or conviction
registered against subject: None
5] Records on Violation of
Anti-Corruption Laws :
Charges or
investigation registered against subject: None
6] Records on Int’l
Anti-Money Laundering Laws/Standards :
Charges or
investigation registered against subject: None
7] Criminal Records
No
available information exist that suggest that subject or any of its principals
have been formally charged or convicted by a competent governmental authority
for any financial crime or under any formal investigation by a competent
government authority for any violation of anti-corruption laws or international
anti-money laundering laws or standard.
8] Affiliation with
Government :
No record
exists to suggest that any director or indirect owners, controlling
shareholders, director, officer or employee of the company is a government
official or a family member or close business associate of a Government
official.
9] Compensation Package :
Our market
survey revealed that the amount of compensation sought by the subject is fair
and reasonable and comparable to compensation paid to others for similar
services.
10] Press Report :
No press reports / filings exists on
the subject.
CORPORATE GOVERNANCE
MIRA INFORM as part of its Due Diligence do provide comments on
Corporate Governance to identify management and governance. These factors often
have been predictive and in some cases have created vulnerabilities to credit
deterioration.
Our Governance Assessment focuses principally on the interactions
between a company’s management, its Board of Directors, Shareholders and other
financial stakeholders.
CONTRAVENTION
Subject is not known to have contravened any existing local laws,
regulations or policies that prohibit, restrict or otherwise affect the terms
and conditions that could be included in the agreement with the subject.
FOREIGN EXCHANGE RATES
|
Currency |
Unit
|
Indian Rupees |
|
US Dollar |
1 |
Rs. 61.85 |
|
UK Pound |
1 |
Rs. 97.01 |
|
Euro |
1 |
Rs. 77.62 |
INFORMATION DETAILS
|
Information
Gathered by : |
SVA |
|
|
|
|
Analysis Done by
: |
SUM |
|
|
|
|
Report Prepared
by : |
BVA |
SCORE & RATING EXPLANATIONS
|
SCORE FACTORS |
RANGE |
POINTS |
|
HISTORY |
1~10 |
4 |
|
PAID-UP CAPITAL |
1~10 |
3 |
|
OPERATING SCALE |
1~10 |
4 |
|
FINANCIAL CONDITION |
|
|
|
--BUSINESS SCALE |
1~10 |
4 |
|
--PROFITABILIRY |
1~10 |
3 |
|
--LIQUIDITY |
1~10 |
3 |
|
--LEVERAGE |
1~10 |
3 |
|
--RESERVES |
1~10 |
3 |
|
--CREDIT LINES |
1~10 |
3 |
|
--MARGINS |
-5~5 |
-- |
|
DEMERIT POINTS |
|
|
|
--BANK CHARGES |
YES/NO |
YES |
|
--LITIGATION |
YES/NO |
NO |
|
--OTHER ADVERSE INFORMATION |
YES/NO |
NO |
|
MERIT POINTS |
|
|
|
--SOLE DISTRIBUTORSHIP |
YES/NO |
NO |
|
--EXPORT ACTIVITIES |
YES/NO |
NO |
|
--AFFILIATION |
YES/NO |
YES |
|
--LISTED |
YES/NO |
NO |
|
--OTHER MERIT FACTORS |
YES/NO |
YES |
|
DEFAULTERS |
|
|
|
--RBI |
YES/NO |
NO |
|
--EPF |
YES/NO |
NO |
|
TOTAL |
|
30 |
This score serves as a reference to assess SC’s credit risk
and to set the amount of credit to be extended. It is calculated from a
composite of weighted scores obtained from each of the major sections of this
report. The assessed factors and their relative weights (as indicated through
%) are as follows:
Financial
condition (40%) Ownership
background (20%) Payment
record (10%)
Credit history
(10%) Market trend
(10%) Operational
size (10%)
RATING EXPLANATIONS
|
RATING |
STATUS |
PROPOSED CREDIT LINE |
|
|
>86 |
Aaa |
Possesses an extremely sound financial base with the strongest
capability for timely payment of interest and principal sums |
Unlimited |
|
71-85 |
Aa |
Possesses adequate working capital. No caution needed for credit transaction.
It has above average (strong) capability for payment of interest and
principal sums |
Large |
|
56-70 |
A |
Financial & operational base are regarded healthy. General unfavourable
factors will not cause fatal effect. Satisfactory capability for payment of
interest and principal sums |
Fairly Large |
|
41-55 |
Ba |
Overall operation is considered normal. Capable to meet normal
commitments. |
Satisfactory |
|
26-40 |
B |
Capability to overcome financial difficulties seems comparatively
below average. |
Small |
|
11-25 |
Ca |
Adverse factors are apparent. Repayment of interest and principal sums
in default or expected to be in default upon maturity |
Limited with full
security |
|
<10 |
C |
Absolute credit risk exists. Caution needed to be exercised |
Credit not
recommended |
|
-- |
NB |
New Business |
-- |
This report is issued at your request without any
risk and responsibility on the part of MIRA INFORM PRIVATE LIMITED (MIPL)
or its officials.