MIRA
INFORM REPORT
|
Report Date : |
25.11.2014 |
IDENTIFICATION DETAILS
|
Name : |
JUBILEE ENTERPRISE PUBLIC COMPANY LIMITED |
|
|
|
|
Registered Office : |
10th Floor, |
|
|
|
|
Country : |
|
|
|
|
|
Financials (as on) : |
31.12.2013 |
|
|
|
|
Date of Incorporation : |
03.11.1993 |
|
|
|
|
Com. Reg. No.: |
0107551000177 [Former :
0105536125477] |
|
|
|
|
Legal Form : |
Public Limited Company |
|
|
|
|
Line of Business : |
The subject is
engaged in design
and distributing various
types of and
diamond jewelry products,
including ring, earring,
bangle, bracelet, necklace,
wedding ring |
|
|
|
|
No. of Employees : |
290 |
RATING & COMMENTS
|
MIRA’s Rating : |
Ba |
|
RATING |
STATUS |
PROPOSED CREDIT LINE |
|
|
41-55 |
Ba |
Overall operation is considered normal. Capable to meet normal
commitments. |
Satisfactory |
|
Status : |
Satisfactory |
|
Payment Behaviour : |
No complaints |
|
Litigation : |
Clear |
NOTES :
Any query related to this report can be made
on e-mail : infodept@mirainform.com
while quoting report number, name and date.
ECGC Country Risk Classification List – June 1, 2014
|
Country Name |
Previous Rating (31.03.2014) |
Current Rating (01.06.2014) |
|
Thailand |
B1 |
B1 |
|
Risk Category |
ECGC
Classification |
|
Insignificant |
A1 |
|
Low |
A2 |
|
Moderate |
B1 |
|
High |
B2 |
|
Very High |
C1 |
|
Restricted |
C2 |
|
Off-credit |
D |
THAILAND - ECONOMIC OVERVIEW
With a well-developed infrastructure, a free-enterprise
economy, generally pro-investment policies, and strong export industries, Thailand
achieved steady growth due largely to industrial and agriculture exports -
mostly electronics, agricultural commodities, automobiles and parts, and
processed foods. Unemployment, at less than 1% of the labor force, stands as
one of the lowest levels in the world, which puts upward pressure on wages in
some industries. Thailand also attracts nearly 2.5 million migrant workers from
neighboring countries. The Thai government in 2013 implemented a nation-wide
300 baht ($10) per day minimum wage policy and deployed new tax reforms
designed to lower rates on middle-income earners. The Thai economy has
weathered internal and external economic shocks in recent years. The global
economic recession severely cut Thailand's exports, with most sectors experiencing
double-digit drops. In late 2011 Thailand's recovery was interrupted by
historic flooding in the industrial areas in Bangkok and its five surrounding
provinces, crippling the manufacturing sector. The government approved flood
mitigation projects worth $11.7 billion, which were started in 2012, to prevent
similar economic damage, and an additional $75 billion for infrastructure over
the following seven years. This was expected to lead to an economic upsurge but
growth has remained slow, in part due to ongoing political unrest and resulting
uncertainties. Spending on infrastructure will require re-approval once a new
government is seated.
|
Source
: CIA |
Company name
JUBILEE ENTERPRISE PUBLIC COMPANY LIMITED
SUMMARY
BUSINESS ADDRESS : 10th
FLOOR, BANGKOK CITY
TOWER,
SOUTH
SATHORN ROAD, THUNGMAHAMEK,
SATHORN,
BANGKOK 10120, THAILAND
TELEPHONE : [66] 2625-1188
FAX : [66] 2625-1100
E-MAIL ADDRESS : conbct@jubileediamond.co.th
REGISTRATION ADDRESS : SAME AS BUSINESS
ADDRESS
ESTABLISHED : 1993
REGISTRATION NO. : 0107551000177 [Former
: 0105536125477]
TAX ID NO. : 3011348871
CAPITAL REGISTERED : BHT. 175,000,000
CAPITAL PAID-UP : BHT.
174,273,125
FISCAL YEAR CLOSING DATE : DECEMBER 31
LEGAL STATUS : PUBLIC LIMITED
COMPANY
EXECUTIVE : MR. VIROJ PHONPRAKIT,
THAI
CHIEF EXECUTIVE
OFFICER & PRESIDENT
NO. OF STAFF : 290
LINES OF BUSINESS : DIAMONDS AND
DIAMOND JEWELRY PRODUCTS
DESIGN AND
DISTRIBUTOR
CORPORATE PROFILE
OPERATING TREND : STABLE
PRESENT SITUATION : OPERATING NORMALLY
REPUTATION : GOOD
WITH NORMAL BUSINESS
ENGAGEMENT
MANAGEMENT STANDARD : MANAGEMENT
WITH GOOD PERFORMANCE
HISTORY
The subject was established on November 3, 1993 originally a private
limited company under the
registered name “Jubilee Enterprise Co.,
Ltd.” by Thai
groups. On July
8, 2008, subject
changed its status
to public company, named JUBILEE
ENTERPRISE PUBLIC COMPANY
LIMITED, and was
listed on the
Stock Exchange of
Thailand [SET] on November 9, 2009. Its
business objective is
to design and
distribute diamonds and
diamond jewelry products
to domestic market. Subject currently employs approximately 290 staff.
The subject’s registered
address was initially
at 721 Silom
Rd., Silom, Bangrak,
Bangkok 10500.
In 2013, its
registered address was
relocated to 10th Floor,
Bangkok City Tower,
179 South Sathorn Road, Thungmahamek,
Sathorn, Bangkok 10120, and
this is the
subject’s current operation
address.
THE BOARD OF DIRECTOR
|
Name |
|
Nationality |
Age |
|
|
|
|
|
|
Mr. Viroj Phonprakit :
Chairman |
[x] |
Thai |
62 |
|
Mrs. Suvatana Tulayapisitchai |
[x] |
Thai |
60 |
|
Ms. Unyarat Phonprakit |
[x] |
Thai |
34 |
|
Mr. Amnuay Nakruchata-amorn |
|
Thai |
58 |
|
Mr. Pairote Maleehorm |
|
Thai |
58 |
|
Ms. Zonwa Denmeka |
|
Thai |
63 |
|
Mr. Sahasroj Rojmetha |
|
Thai |
55 |
|
Mr. Manu Leopairote |
|
Thai |
71 |
AUTHORIZED PERSON
Any two of
the mentioned directors
[x] can jointly
sign on behalf
of the subject
with company’s affixed.
MANAGEMENT
Mr. Viroj Phonprakit is
the Chief Executive
Officer and President.
He is Thai
nationality with the
age of 62
years old.
Mrs. Suvatana
Tulayapisitchai is the
Deputy Senior Chief
Executive Officer.
She is Thai
nationality with the
age of 60
years old.
Ms. Unyarat Phonprakit is
the Chief Financial
Officer.
She is Thai
nationality with the
age of 34
years old.
Mr. Warawut Settanarag is
the Senior Director-Internal Audit
Office.
He is Thai
nationality with the
age of 62
years old.
Mr. Olarn Pirintarangkura is
the Director-Sales Department.
He is Thai
nationality.
Mr. Sopon Arunsuraponmatee is
the Director-Marketing Department.
He is Thai
nationality.
Mr. Yuttana Taepangthong is
the Director-Finance &
Accounting Department.
He is Thai
nationality.
Mr. Varit Saimala is
the Director-Purchasing Department.
He is Thai
nationality.
BUSINESS OPERATIONS
The subject is
engaged in design
and distributing various
types of and
diamond jewelry products,
including ring, earring,
bangle, bracelet, necklace,
wedding ring under
its owned brand
“JUBILEE DIAMOND”. Its production has
been supplied by
local jewelry manufacturing contractor.
PURCHASE
95% of raw material
is imported from Belgium, U.S.A., Hong
Kong & the
remaining 25%, as well
as component are
purchased from local
suppliers.
SALES
100% of the
products is sold
locally by retail
through the shop,
counter sale and
GP counter, named “Diamond Center”,
with currently has
108 owned branches
and 14 franchise
branches. Most of
the jewelry counters
are located at
the leading department
store nationwide, such
as Robinson Department
Store, Central Department
Store, Mah Boonkrong
Center, Promenade, Tesco
Lotus, Big C
Super Center and
etc.
REVENUE STRUCTURE
[Unit
: Million baht]
Income From 2013 2012
Amount
% Amount %
Diamond Jewelry and
others 1,334.94 91.30 1,089.34 88.84
Carat Diamond 120.42 8.24 131.05 10.69
Services 6.78 0.46 5.84 0.47
Total Income 1,455.46 100.00 1,220.39 100.00
SUBSIDIARY AND AFFILIATED COMPANY
The subject is
not found to
have any subsidiary
or affiliated company
here in Thailand.
LITIGATION
Bankruptcy and Receivership
There are no litigation
on bankruptcy and
receivership cases filed
against the subject
found at Legal
Execution Department for
the past five
years.
Others
There are no
legal suits filed
against the subject
for the past
two years.
CREDIT
Sales are by
cash.
Local bills are
paid by cash
or on the
credits term of
30-60 days.
Imports are by
L/C at sight
or T/T.
BANKING
Bangkok Bank Public
Co., Ltd.
The Siam Commercial
Bank Public Co.,
Ltd.
Kasikornbank Public Co.,
Ltd.
Krung Thai Bank
Public Co., Ltd.
EMPLOYMENT
The subject employs
approximately 290 staff.
LOCATION DETAILS
The premise is
owned for administrative office
at the heading
address. Premise is located
in a prime
commercial area.
COMMENT
Subject is a
designer and distributor of
diamond jewelry products
with gold and
platinum setting. The products
are sold through
its counter sales in leading
department store nationwide. Subject
reported a healthy sales
in 2013, meanwhile
its business in
2014 is relatively
slow due to
shrinking purchasing power
and delay spending.
FINANCIAL INFORMATION
The capital was
registered at Bht. 10,000,000 divided
into 100,000 shares of
Bht. 100 each.
The latest registered
capital was increased
to Bht. 175,000,000 divided
into 175,000,000 shares
of Bht. 1
each.
THE SHAREHOLDERS LISTED WERE
[as at August
28, 2014] at
Bht. 174,273,125 of
capitalization]
|
NAME |
HOLDING |
% |
|
|
|
|
|
Mr. Viroj Phonprakit Nationality: Thai Address : 162-164
Charoenkrung Rd.,
Samphantawong, Bangkok |
72,341,400 |
41.51 |
|
Mrs. Suvatana Tulayapisitchai Nationality: Thai Address : 2/2
Taksin Rd., Bukkalo,
Thonburi, Bangkok |
12,249,000 |
7.03 |
|
Mr. Monchai Leesirikul Nationality: Thai Address : - |
7,000,000 |
4.02 |
|
Ms. Unyarat Pornprakit Nationality: Thai Address : 162-164
Charoenkrung Rd.,
Samphantawong, Bangkok |
6,249,000 |
3.59 |
|
Mr. Akarapong Phonprakit Nationality: Thai Address : 162-164
Charoenkrung Rd.,
Samphantawong, Bangkok |
6,007,500 |
3.45 |
|
Ms. Orarat Phonprakit Nationality: Thai Address : 162-164
Charoenkrung Rd.,
Samphantawong, Bangkok |
5,505,000 |
3.16 |
|
Mr. Jaraspan Panjasap Nationality: Thai Address : - |
4,300,000 |
2.47 |
|
K-SMD-Joint Venture Co.,
Ltd. Nationality: Thai Address : 252/38
Ratchadapisek Rd., Huaykwang,
Bangkok |
3,515,600 |
2.02 |
|
Mr. Kachen Benjakul Nationality: Thai Address : - |
2,642,500 |
1.52 |
|
Others |
54,463,125 |
31.23 |
Total Shareholders :
1,556
NAME OF AUDITOR & CERTIFIED
PUBLIC ACCOUNTANT NO.
Mr. Banchong Pichayaprasart
No. 7147
BALANCE SHEET [BAHT]
The latest financial figures published
as at December
31, 2013, 2012
& 2011 were:
ASSETS
|
Current Assets |
2013 |
2012 [Adjusted] |
2011 |
|
|
|
|
|
|
Cash and Cash Equivalents |
49,926,423.51 |
29,925,889.86 |
75,787,030.33 |
|
Short-term Investment |
165,016,025.07 |
98,110,983.60 |
60,255,029.04 |
|
Trade Accounts &
Other Receivable |
84,101,236.65 |
76,750,906.04 |
54,338,350.50 |
|
Inventories |
565,479,556.49 |
479,421,226.79 |
384,723,551.63 |
|
Other Current Assets
|
6,330,646.55 |
10,822,604.78 |
8,363,858.69 |
|
|
|
|
|
|
Total Current Assets
|
870,853,888.27 |
695,031,611.07 |
583,467,820.19 |
|
Cash at Bank pledged as a Collateral |
- |
- |
25,000,000.00 |
|
Fixed Assets |
56,118,211.39 |
34,382,324.31 |
24,805,209.55 |
|
Intangible Assets |
2,668,320.53 |
2,545,496.47 |
4,438,624.55 |
|
Deferred Income Tax Assets |
1,555,283.23 |
909,115.00 |
- |
|
Other Non - current Assets
|
23,104,666.33 |
14,606,007.61 |
9,566,694.69 |
|
Total Assets |
954,300,369.75 |
747,474,554.46 |
647,278,348.98 |
LIABILITIES &
SHAREHOLDERS’ EQUITY [BAHT]
|
Current
Liabilities |
2013 |
2012 [Adjusted] |
2011 |
|
|
|
|
|
|
Trade Accounts & Other
Payable |
269,230,864.52 |
171,057,658.54 |
153,305,568.53 |
|
Current Portion of
Liabilities |
2,317,992.62 |
8,664,199.77 |
7,703,623.97 |
|
Accrued Income Tax |
25,539,718.12 |
22,095,531.21 |
16,616,014.50 |
|
Other Current Liabilities |
19,533,524.98 |
36,419,224.50 |
24,162,316.92 |
|
|
|
|
|
|
Total Current Liabilities |
316,622,100.24 |
238,236,614.02 |
201,787,523.92 |
|
Long-term Loan from Financial Institutions |
- |
- |
6,666,656.00 |
|
Financial Lease Contract
Liabilities |
3,259,513.27 |
3,723,614.59 |
1,262,577.02 |
|
Liabilities Estimated |
3,600,000.00 |
- |
- |
|
Employee Benefits Obligation |
4,862,653.78 |
5,346,722.99 |
3,528,994.68 |
|
Total Liabilities |
328,344,267.29 |
247,306,951.60 |
213,245,751.62 |
|
|
|
|
|
|
Shareholders' Equity |
|
|
|
|
|
|
|
|
|
Share capital : Baht 1
par value authorized, &
issued share capital
175,000,000 shares |
175,000,000.00 |
175,000,000.00 |
175,000,000.00 |
|
|
|
|
|
|
Capital Paid |
174,273,125.00 |
173,297,625.00 |
172,287,750.00 |
|
Premium on Share Capital |
92,267,172.80 |
92,267,172.80 |
92,267,172.80 |
|
Retained Earnings: Appropriated for Statutory Reserve |
17,500,000.00 |
17,500,000.00 |
17,500,000.00 |
|
Unappropriated |
341,915,804.66 |
217,102,805.06 |
151,977,674.56 |
|
Total Shareholders' Equity |
625,956,102.46 |
500,167,602.86 |
434,032,597.36 |
|
Total Liabilities &
Shareholders' Equity |
954,300,369.75 |
747,474,554.46 |
647,278,348.98 |
PROFIT & LOSS ACCOUNT
|
Revenue |
2013 |
2012 [Adjusted] |
2011 |
|
|
|
|
|
|
Sales Income |
1,462,143,037.90 |
1,226,230,285.32 |
887,316,244.47 |
|
Other Income |
3,442,375.49 |
4,690,668.32 |
3,300,323.33 |
|
Total Revenues |
1,465,585,413.39 |
1,230,920,953.64 |
890,616,567.80 |
|
Expenses |
|
|
|
|
|
|
|
|
|
Cost of Goods
Sold |
831,226,556.18 |
716,021,706.79 |
497,665,606.65 |
|
Selling Expenses |
287,312,141.77 |
227,580,887.17 |
154,624,432.09 |
|
Administrative Expenses |
93,023,993.42 |
77,866,895.15 |
71,494,517.80 |
|
Financial Cost |
522,426.88 |
952,445.63 |
1,298,062.71 |
|
Total Expenses |
1,212,085,118.25 |
1,022,421,934.74 |
725,082,619.25 |
|
Profit before Income
Tax |
253,500,295.14 |
208,499,018.90 |
165,533,948.55 |
|
Income Tax |
[50,703,364.29] |
[42,268,944.05] |
[34,348,117.08] |
|
|
|
|
|
|
Net Profit / [Loss] |
202,796,930.85 |
166,230,074.85 |
131,185,831.47 |
FINANCIAL ANALYSIS
|
ITEM |
UNIT |
2013 |
2012 |
2011 |
|
|
|
|
|
|
|
LIQUIDITY RATIO |
|
|
|
|
|
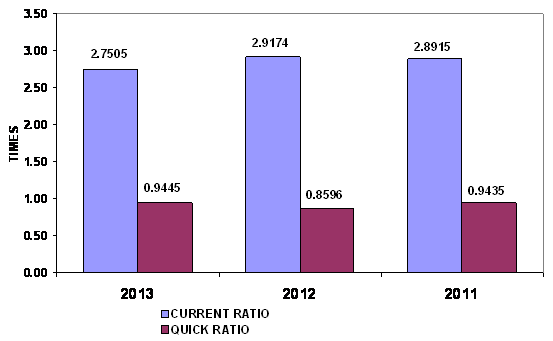
CURRENT RATIO |
TIMES |
2.75 |
2.92 |
2.89 |
|
QUICK RATIO |
TIMES |
0.94 |
0.86 |
0.94 |
|
|
|
|
|
|
|
ACTIVITY RATIO |
|
|
|
|
|
FIXED ASSETS TURNOVER |
TIMES |
26.05 |
35.66 |
35.77 |
|
TOTAL ASSETS TURNOVER |
TIMES |
1.53 |
1.64 |
1.37 |
|
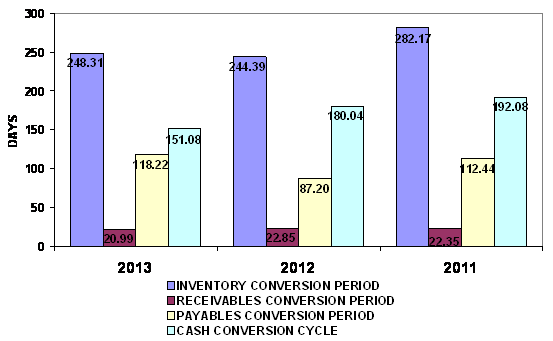
INVENTORY CONVERSION PERIOD |
DAYS |
248.31 |
244.39 |
282.17 |
|
INVENTORY TURNOVER |
TIMES |
1.47 |
1.49 |
1.29 |
|
RECEIVABLES CONVERSION PERIOD |
DAYS |
20.99 |
22.85 |
22.35 |
|
RECEIVABLES TURNOVER |
TIMES |
17.39 |
15.98 |
16.33 |
|
PAYABLES CONVERSION PERIOD |
DAYS |
118.22 |
87.20 |
112.44 |
|
CASH CONVERSION CYCLE |
DAYS |
151.08 |
180.04 |
192.08 |
|
|
|
|
|
|
|
PROFITABILITY RATIO |
|
|
|
|
|
COST OF GOODS SOLD |
% |
56.85 |
58.39 |
56.09 |
|
SELLING & ADMINISTRATION |
% |
26.01 |
24.91 |
25.48 |
|
INTEREST |
% |
0.04 |
0.08 |
0.15 |
|
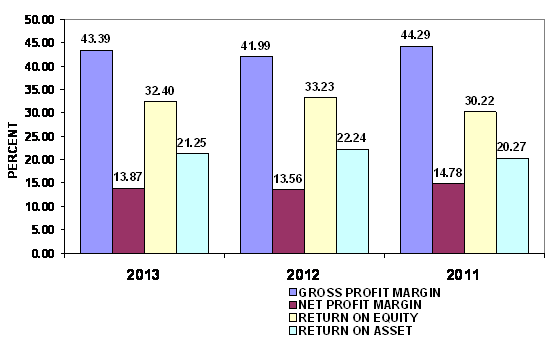
GROSS PROFIT MARGIN |
% |
43.39 |
41.99 |
44.29 |
|
NET PROFIT MARGIN BEFORE EX. ITEM |
% |
17.34 |
17.00 |
18.66 |
|
NET PROFIT MARGIN |
% |
13.87 |
13.56 |
14.78 |
|
RETURN ON EQUITY |
% |
32.40 |
33.23 |
30.22 |
|
RETURN ON ASSET |
% |
21.25 |
22.24 |
20.27 |
|
EARNING PER SHARE |
BAHT |
1.16 |
0.96 |
0.76 |
|
|
|
|
|
|
|
LEVERAGE RATIO |
|
|
|
|
|
DEBT RATIO |
TIMES |
0.34 |
0.33 |
0.33 |
|
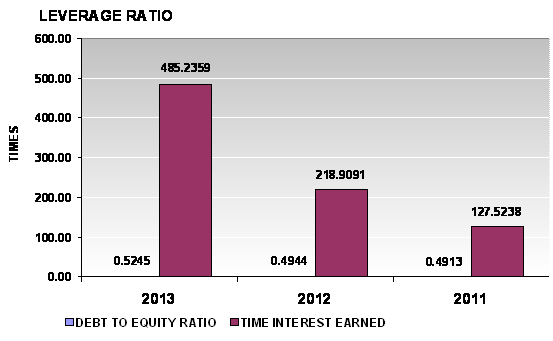
DEBT TO EQUITY RATIO |
TIMES |
0.52 |
0.49 |
0.49 |
|
TIME INTEREST EARNED |
TIMES |
485.24 |
218.91 |
127.52 |
|
|
|
|
|
|
|
ANNUAL GROWTH |
|
|
|
|
|
SALES GROWTH |
% |
19.24 |
38.20 |
|
|
OPERATING PROFIT |
% |
21.58 |
25.96 |
|
|
NET PROFIT |
% |
22.00 |
26.71 |
|
|
FIXED ASSETS |
% |
63.22 |
38.61 |
|
|
TOTAL ASSETS |
% |
27.67 |
15.48 |
|
ANNUAL GROWTH : EXCELLENT
An annual sales growth is 19.24%. Turnover has increased from THB
PROFITABILITY : EXCELLENT
PROFITABILITY
RATIO
|
Gross Profit Margin |
43.39 |
Impressive |
Industrial Average |
3.01 |
|
Net Profit Margin |
13.87 |
Impressive |
Industrial Average |
0.58 |
|
Return on Assets |
21.25 |
Impressive |
Industrial Average |
3.55 |
|
Return on Equity |
32.40 |
Impressive |
Industrial Average |
14.14 |
Gross Profit Margin used to assess a firm's financial health by
revealing the proportion of money left over from revenues after accounting for
the cost of goods sold. Gross profit margin serves as the source for paying
additional expenses and future savings. The
company’s figure is 43.39%. When
compared with the industry average, the ratio of the company was higher,
indicated that company was more profitable than the same industry.
Net Profit Margin is the indicator of the company's efficiency in that
net profit takes into consideration all expenses of the company. A low profit
margin indicates a low margin of safety, higher risk that a decline in sales
will erase profits and result in a net loss. The company’s figure is 13.87% compared with those of its average
competitors in the same industry, indicated that business was an efficient
operator in a dominant position within
its industry.
Return on Assets measures how efficiently profits are being generated
from the assets employed in the business when compared with the ratios of firms
in a similar business. A low ratio in comparison with industry averages
indicates an inefficient use of business assets. Return on Assets ratio is
21.25%, higher figure when compared with those of its average competitors in
the same industry, indicated that business was an efficient profit in a dominant position within its industry.
Return on Equity indicates how profitable a company is by comparing its
net income to its average shareholders' equity, ROE measures how much the
shareholders earned for their investment in the company. Return on Equity ratio
is 32.4%, higher figure when compared with those of its average competitors in
the same industry, indicated that business was an efficient profit in a dominant position within its industry.
Trend of the average competitors in the same industry for last 5 years
Return on Assets Uptrend
Return on Equity Uptrend
LIQUIDITY : ACCEPTABLE
LIQUIDITY RATIO
|
Current Ratio |
2.75 |
Impressive |
Industrial Average |
1.60 |
|
Quick Ratio |
0.94 |
|
|
|
|
Cash Conversion Cycle |
151.08 |
|
|
|
The Current Ratio is to ascertain whether a company's short-term assets
are readily available to pay off its short-term liabilities. The company's
figure is 2.75 times in 2013, decreased from 2.92 times, then it is generally
considered to have good short-term financial strength. When compared with the
industry average, the ratio of the company was higher, indicated that company
was an efficient operator in a dominant position within its industry.
The Quick Ratio is a liquidity indicator that further refines the
current ratio by measuring the amount of the most liquid current assets there
are to cover current liabilities. The company's figure is 0.94 times in 2013,
increased from 0.86 times, by excluding inventory, the company may have
problems meeting current liabilities.
The Cash Conversion Cycle measures the number of days a company's cash
is tied up in the production and sales process of its operations and the
benefit from payment terms from its creditors. It meant the company could
survive when no cash inflow was received from sale for 152 days.
Trend of the average competitors in the same industry for last 5 years
Current Ratio Uptrend
LEVERAGE : EXCELLENT
LEVERAGE RATIO
|
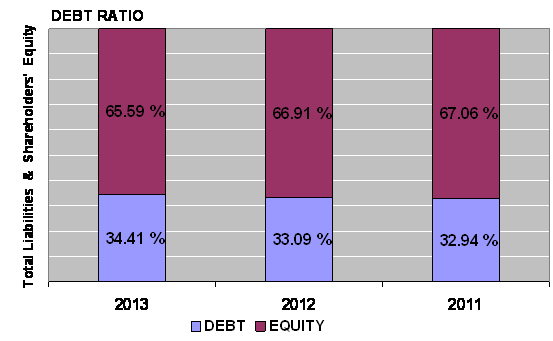
Debt Ratio |
0.34 |
Impressive |
Industrial Average |
0.73 |
|
Debt to Equity Ratio |
0.52 |
Impressive |
Industrial Average |
2.73 |
|
Times Interest Earned |
485.24 |
Impressive |
Industrial Average |
- |
Debt to Equity Ratio a measurement of how much suppliers, lenders, creditors
and obligors have committed to the company versus what the shareholders have
committed. A lower the percentage means that the company is using less leverage
and has a stronger equity position.
Times Interest Earned measuring a company's ability to meet its debt
obligations. Ratio is 485.24 higher than 1, so the company can pay interest
expenses on outstanding debt.
Debt Ratio shows the proportion of a company's assets which are financed
through debt. The company's figure is 0.34 less than 0.5, most of the company's
assets are financed through equity.
Trend of the average competitors in the same industry for last 5 years
Debt Ratio Downtrend
Times Interest Earned Stable
ACTIVITY : SATISFACTORY
ACTIVITY RATIO
|
Fixed Assets Turnover |
26.05 |
Impressive |
Industrial Average |
- |
|
Total Assets Turnover |
1.53 |
Deteriorated |
Industrial Average |
6.16 |
|
Inventory Conversion Period |
248.31 |
|
|
|
|
Inventory Turnover |
1.47 |
Deteriorated |
Industrial Average |
12.03 |
|
Receivables Conversion Period |
20.99 |
|
|
|
|
Receivables Turnover |
17.39 |
Impressive |
Industrial Average |
8.23 |
|
Payables Conversion Period |
118.22 |
|
|
|
The company's Account Receivable Ratio is calculated as 17.39 and
Inventory Turnover in Days Ratio indicates the liquidity of inventory.
It estimates the number of days that it will take to sell the current
inventory. Inventory is particularly sensitive to change in business
activities. The inventory turnover in days has increased from 244 days at the
end of 2012 to 248 days at the end of 2013. This represents a negative trend.
And Inventory turnover has decreased from 1.49 times in year 2012 to 1.47 times
in year 2013.
The company's Total Asset Turnover is calculated as 1.53 times and 1.64
times in 2013 and 2012 respectively. This ratio is determined by dividing total
assets into total sales turnover. The ratio measures the activity of the assets
and the ability of the firm to generate sales through the use of the assets.
Trend of the average competitors in the same industry for last 5 years
Fixed Assets Turnover Stable
Total Assets Turnover Downtrend
Inventory Turnover Downtrend
Receivables Turnover Downtrend
FOREIGN EXCHANGE RATES
|
Currency |
Unit
|
Indian Rupees |
|
US Dollar |
1 |
Rs.61.78 |
|
|
1 |
Rs.96.78 |
|
Euro |
1 |
Rs.76.59 |
INFORMATION DETAILS
|
Analysis Done by
: |
DIV |
|
|
|
|
Report Prepared
by : |
SDA |
RATING EXPLANATIONS
|
RATING |
STATUS |
PROPOSED CREDIT LINE |
|
|
|
>86 |
Aaa |
Possesses an extremely sound financial base with the strongest
capability for timely payment of interest and principal sums |
Unlimited |
|
|
71-85 |
Aa |
Possesses adequate working capital. No caution needed for credit
transaction. It has above average (strong) capability for payment of interest
and principal sums |
Large |
|
|
56-70 |
A |
Financial & operational base are regarded healthy. General unfavourable
factors will not cause fatal effect. Satisfactory capability for payment of
interest and principal sums |
Fairly Large |
|
|
41-55 |
Ba |
Overall
operation is considered normal. Capable to meet normal commitments. |
Satisfactory |
|
|
26-40 |
B |
Capability to overcome financial difficulties seems comparatively
below average. |
Small |
|
|
11-25 |
Ca |
Adverse factors are apparent. Repayment of interest and principal sums
in default or expected to be in default upon maturity |
Limited with
full security |
|
|
<10 |
C |
Absolute credit risk exists. Caution needed to be exercised |
Credit not
recommended |
|
|
-- |
NB |
New Business |
-- |
|
This score serves as a reference to assess SC’s credit risk and
to set the amount of credit to be extended. It is calculated from a composite
of weighted scores obtained from each of the major sections of this report. The
assessed factors and their relative weights (as indicated through %) are as
follows:
Financial
condition (40%) Ownership
background (20%) Payment
record (10%)
Credit history
(10%) Market trend
(10%) Operational
size (10%)
This report is issued at your request without any
risk and responsibility on the part of MIRA INFORM PRIVATE LIMITED (MIPL)
or its officials.