MIRA INFORM REPORT
|
Report Date : |
01.10.2014 |
IDENTIFICATION DETAILS
|
Name : |
E D & F MAN SUGAR LIMITED |
|
|
|
|
Formerly Known As : |
E.D. & F. MAN (SUGAR) LIMITED |
|
|
|
|
Registered Office : |
Cotton Centre, Hay’s Lane, London SE 1 2QE |
|
|
|
|
Country : |
United Kingdom |
|
|
|
|
Financials (as on) : |
30.09.2013 |
|
|
|
|
Date of Incorporation : |
08.12.1950 |
|
|
|
|
Com. Reg. No.: |
00489204 |
|
|
|
|
Legal Form : |
Private Limited with Share Capital |
|
|
|
|
Line of Business : |
· Agents Specialized in the sale of Particulars Products · Sugar Merchants, Brokers and Distributors. |
|
|
|
|
No. of Employees : |
120 |
RATING & COMMENTS
|
MIRA’s Rating : |
Ba |
|
RATING |
STATUS |
PROPOSED CREDIT LINE |
|
|
41-55 |
Ba |
Overall operation is considered normal. Capable to meet normal
commitments. |
Satisfactory |
|
Status : |
Satisfactory |
|
|
|
|
Payment Behaviour : |
Slow but correct |
|
|
|
|
Litigation : |
Clear |
NOTES:
Any query related to this report can be made on
e-mail: infodept@mirainform.com
while quoting report number, name and date.
ECGC Country Risk Classification List – June 1, 2014
|
Country Name |
Previous Rating (31.03.2014) |
Current Rating (01.06.2014) |
|
United Kingdom |
A1 |
A1 |
|
Risk Category |
ECGC
Classification |
|
Insignificant |
A1 |
|
Low |
A2 |
|
Moderate |
B1 |
|
High |
B2 |
|
Very High |
C1 |
|
Restricted |
C2 |
|
Off-credit |
D |
UNITED KINGDOM - ECONOMIC OVERVIEW
The UK, a leading trading
power and financial center, is the third largest economy in Europe after
Germany and France. Over the past two decades, the government has greatly
reduced public ownership. Agriculture is intensive, highly mechanized, and
efficient by European standards, producing about 60% of food needs with less
than 2% of the labor force. The UK has large coal, natural gas, and oil
resources, but its oil and natural gas reserves are declining and the UK became
a net importer of energy in 2005. Services, particularly banking, insurance,
and business services, are key drivers of British GDP growth. Manufacturing,
meanwhile, has declined in importance but still accounts for about 10% of
economic output. After emerging from recession in 1992, Britain's economy
enjoyed the longest period of expansion on record during which time growth
outpaced most of Western Europe. In 2008, however, the global financial crisis
hit the economy particularly hard, due to the importance of its financial
sector. Falling home prices, high consumer debt, and the global economic
slowdown compounded Britain's economic problems, pushing the economy into
recession in the latter half of 2008 and prompting the then BROWN (Labour)
government to implement a number of measures to stimulate the economy and
stabilize the financial markets; these included nationalizing parts of the
banking system, temporarily cutting taxes, suspending public sector borrowing
rules, and moving forward public spending on capital projects. Facing burgeoning
public deficits and debt levels, in 2010 the CAMERON-led coalition government
(between Conservatives and Liberal Democrats) initiated a five-year austerity
program, which aimed to lower London's budget deficit from about 11% of GDP in
2010 to nearly 1% by 2015. In November 2011, Chancellor of the Exchequer George
OSBORNE announced additional austerity measures through 2017 largely due to the
euro-zone debt crisis. The CAMERON government raised the value added tax from
17.5% to 20% in 2011. It has pledged to reduce the corporation tax rate to 21%
by 2014. The Bank of England (BoE) implemented an asset purchase program of
£375 billion (approximately $605 billion) as of December 2013. During times of
economic crisis, the BoE coordinates interest rate moves with the European
Central Bank, but Britain remains outside the European Economic and Monetary
Union (EMU). In 2012, weak consumer spending and subdued business investment
weighed on the economy, however, in 2013 GDP grew 1.4%, accelerating
unexpectedly in the second half of the year because of greater consumer
spending and a recovering housing market. The budget deficit is falling but
remains high at nearly 7% and public debt has continued to increase.
|
Source
: CIA |
REGISTERED
NAME & COMPANY SUMMARY
Company Name: E D & F MAN SUGAR LIMITED
Company No.: 00489204
Company Status: Active – Accounts Filed

DIRECTORS/MANAGEMENT
Current Directors
|
Name |
Niels Vesterdal |
Date of Birth |
25/04/1953 |
|
Officers Title |
Mr |
Nationality |
Danish |
|
Present Appointments |
5 |
Function |
Director |
|
Appointment Date |
31/05/1991 |
|
|
|
Address |
Cottons Centre, Hay's Lane, London, SE1 2QE |
||
|
Name |
Joaquin Munoz Alvarez De Toledo |
Date of Birth |
08/12/1963 |
|
Officers Title |
Mr |
Nationality |
Spanish |
|
Present Appointments |
1 |
Function |
Director |
|
Appointment Date |
01/07/2003 |
|
|
|
Address |
Cottons Centre, Hay's Lane, London, SE1 2QE |
||
|
Name |
Jascha Bob Raadtgever |
Date of Birth |
30/01/1976 |
|
Officers Title |
Mr |
Nationality |
Dutch |
|
Present Appointments |
5 |
Function |
Director |
|
Appointment Date |
21/06/2010 |
|
|
|
Address |
Cottons Centre, Hay's Lane, London, SE1 2QE |
||
|
Name |
Jonathan Laurence Hugh |
Date of Birth |
12/02/1970 |
|
Officers Title |
Mr |
Nationality |
British |
|
Present Appointments |
1 |
Function |
Director |
|
Appointment Date |
27/09/2013 |
|
|
|
Address |
Cottons Centre, Hay's Lane, London, SE1 2QE |
||
|
Name |
Johanna Louise Sutcliff |
Date of Birth |
04/09/1970 |
|
Officers Title |
Ms |
Nationality |
British |
|
Present Appointments |
1 |
Function |
Director |
|
Appointment Date |
13/02/2014 |
|
|
|
Address |
Cottons Centre, Hay's Lane, London, SE1 2QE |
||
NEGATIVE
INFORMATION
CCJ
|
Total Number of Exact CCJs - |
0 |
Total Value of Exact CCJs - |
|
|
Total Number of Possible CCJs - |
0 |
Total Value of Possible CCJs - |
|
|
Total Number of Satisfied CCJs - |
0 |
Total Value of Satisfied CCJs - |
|
|
Total Number of Writs - |
- |
|
|
Exact CCJ Details
|
No CCJs found |
Possible CCJs
Details
|
There are no possible CCJ details |
Writ Details
|
No writs found |
SHARE
& SHARE CAPITAL INFORMATION
Top 20
Shareholders
|
Name |
Currency |
Share Count |
Share Type |
Nominal Value |
% of Total Share Count |
|
AGMAN HOLDINGS LTD |
USD |
101,522,000 |
ORDINARY |
1 |
100 |
GROUP
STRUCTURE & AFFILIATED COMPANIES
Statistics
|
Group |
25 companies |
|
Linkages |
15 companies |
|
Countries |
In 7 countries |
Summary
|
Holding Company |
AGMAN HOLDINGS LIMITED |
|
Ownership Status |
Wholly Owned |
|
Ultimate Holding Company |
E D & F MAN HOLDINGS LIMITED |
Group structure
Other Linked
companies
|
Name |
|
Number |
Latest Key
Financials |
Turnover |
|
EMPRESAS IANSA |
|
|
31.12.2013 |
€419,433,687 |
|
VOLCAFE FRANCE SAS |
|
452155765 |
30.09.2013 |
€12,657,043 |
|
E D & F MAN HOLDINGS B.V. |
|
24188202 |
30.09.2013 |
|
|
SOFPAC B.V. |
|
24189386 |
30.09.2013 |
|
|
EUROSUGAR |
|
483385357 |
31.12.2013 |
|
|
CONSOLINVEST B.V. |
|
24234761 |
30.09.2013 |
|
|
ED&F MAN LIQUID PRODUCTS LLC |
|
|
- |
$1,486,000 |
|
AGMAN LOUISIANA, INC |
|
|
- |
|
|
WESTWAY FEED PRODUCTS LLC |
|
|
- |
$100,000,000 |
|
CAMPOS CHILENOS |
|
|
- |
|
|
ED & F MAN CHILE SA |
|
|
- |
|
|
ED & F MAN LIMITED CHILI |
|
|
- |
|
|
ED&F MAN ASIA PTE LIMITED |
|
|
- |
|
|
ED&F MAN LIQUID PRODUCTS NEDERLAND B.V |
|
|
- |
|
|
ED&F MAN MALAYSIA SDN BHD |
|
|
- |
|
FINANCIAL
INFORMATION
Profit & Loss
|
Date Of Accounts |
30/09/13 |
(%) |
30/09/12 |
(%) |
30/09/11 |
(%) |
30/09/10 |
(%) |
30/09/09 |
|
Weeks |
52 |
(%) |
52 |
(%) |
52 |
(%) |
52 |
(%) |
48 |
|
Currency |
GBP |
(%) |
GBP |
(%) |
GBP |
(%) |
GBP |
(%) |
GBP |
|
Consolidated A/cs |
N |
(%) |
N |
(%) |
N |
(%) |
N |
(%) |
N |
|
Turnover |
- |
- |
- |
- |
- |
- |
- |
- |
- |
|
Export |
- |
- |
- |
- |
- |
- |
- |
- |
- |
|
Cost of Sales |
- |
- |
- |
- |
- |
- |
- |
- |
- |
|
Gross Profit |
£47,393,896 |
-2.8% |
£48,744,715 |
498.8% |
-£12,223,837 |
-212.5% |
£10,868,051 |
-65.8% |
£31,819,074 |
|
Wages & Salaries |
£17,799,049 |
1.3% |
£17,574,656 |
98.8% |
£8,840,513 |
-26.9% |
£12,101,767 |
7% |
£11,313,085 |
|
Directors Emoluments |
£3,300,825 |
-8.6% |
£3,610,597 |
211.8% |
£1,158,166 |
-7.1% |
£1,247,259 |
-29.5% |
£1,768,017 |
|
Operating Profit |
£9,200,530 |
-38.5% |
£14,949,128 |
146.1% |
-£32,404,863 |
-194.4% |
-£11,007,352 |
-198% |
£11,237,154 |
|
Depreciation |
£28,897 |
-2.8% |
£29,730 |
-4.3% |
£31,052 |
-12.5% |
£35,470 |
-39.8% |
£58,912 |
|
Audit Fees |
£169,165 |
-20.7% |
£213,399 |
23.3% |
£173,097 |
49.9% |
£115,439 |
-43.3% |
£203,574 |
|
Interest Payments |
£9,924,147 |
-6.1% |
£10,564,878 |
-20.5% |
£13,286,205 |
84.4% |
£7,203,663 |
109.8% |
£3,433,920 |
|
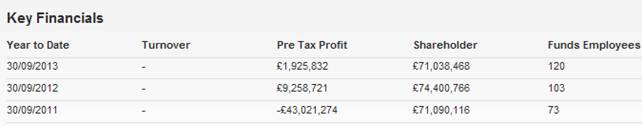
Pre Tax Profit |
£1,925,832 |
-79.2% |
£9,258,721 |
121.5% |
-£43,021,274 |
-999.9% |
-£3,741,777 |
-108.3% |
£45,108,333 |
|
Taxation |
-£80,067 |
96.6% |
-£2,334,831 |
-121.7% |
£10,782,902 |
132.1% |
£4,646,588 |
247.3% |
-£3,154,415 |
|
Profit After Tax |
£1,845,765 |
-73.3% |
£6,923,890 |
121.5% |
-£32,238,372 |
-999.9% |
£904,811 |
-97.8% |
£41,953,918 |
|
Dividends Payable |
£1,806,032 |
-54.4% |
£3,964,059 |
- |
- |
-100% |
£6,449,116 |
-80.1% |
£32,401,650 |
|
Retained Profit |
£39,733 |
-98.7% |
£2,959,831 |
109.2% |
-£32,238,372 |
-481.5% |
-£5,544,305 |
-158% |
£9,552,268 |
Balance Sheet
|
Date Of Accounts |
30/09/13 |
(%) |
30/09/12 |
(%) |
30/09/11 |
(%) |
30/09/10 |
(%) |
30/09/09 |
|
Tangible Assets |
£22,793,330 |
8.1% |
£21,088,795 |
1.7% |
£20,739,297 |
53.3% |
£13,531,536 |
52.9% |
£8,851,214 |
|
Intangible Assets |
0 |
- |
0 |
- |
0 |
- |
0 |
- |
0 |
|
Total Fixed Assets |
£22,793,330 |
8.1% |
£21,088,795 |
1.7% |
£20,739,297 |
53.3% |
£13,531,536 |
52.9% |
£8,851,214 |
|
Stock |
£129,916,923 |
0.7% |
£128,995,111 |
-4.3% |
£134,725,819 |
121.9% |
£60,702,309 |
0.6% |
£60,355,436 |
|
Trade Debtors |
£92,704,232 |
-39.5% |
£153,326,506 |
5.5% |
£145,355,444 |
-10.1% |
£161,660,003 |
57.1% |
£102,899,784 |
|
Cash |
£6,369,273 |
999.9% |
£75,978 |
666.7% |
£9,910 |
-97.7% |
£436,605 |
-59% |
£1,065,000 |
|
Other Debtors |
£129,171,031 |
19.2% |
£108,320,560 |
-3.3% |
£112,001,189 |
-51.2% |
£229,353,799 |
-6.9% |
£246,441,055 |
|
Miscellaneous Current Assets |
£42,466,438 |
-40.3% |
£71,129,757 |
-9.2% |
£78,368,129 |
-45% |
£142,358,442 |
-20.4% |
£178,844,014 |
|
Total Current Assets |
£400,627,897 |
-13.3% |
£461,847,912 |
-1.8% |
£470,460,492 |
-20.9% |
£594,511,157 |
0.8% |
£589,605,289 |
|
Trade Creditors |
£109,030,161 |
-25.2% |
£145,742,600 |
-1.2% |
£147,482,822 |
51.9% |
£97,067,587 |
15.4% |
£84,137,592 |
|
Bank Loans & Overdrafts |
0 |
- |
0 |
- |
0 |
- |
0 |
- |
0 |
|
Other Short Term Finance |
£218,821,263 |
-3.4% |
£226,520,217 |
-9.8% |
£251,268,499 |
0.9% |
£249,016,510 |
12.9% |
£220,601,558 |
|
Miscellaneous Current Liabilities |
£18,968,154 |
-33.9% |
£28,714,323 |
101.3% |
£14,264,006 |
-91.2% |
£161,401,393 |
-13.4% |
£186,466,584 |
|
Total Current Liabilities |
£346,819,577 |
-13.5% |
£400,977,141 |
-2.9% |
£413,015,328 |
-18.6% |
£507,485,489 |
3.3% |
£491,205,734 |
|
Bank Loans & Overdrafts and LTL |
£5,563,181 |
-26.4% |
£7,558,800 |
6.5% |
£7,094,345 |
- |
0 |
-100% |
£602,867 |
|
Other Long Term Finance |
£4,066,582 |
-27% |
£5,574,128 |
11.1% |
£5,017,178 |
- |
0 |
- |
0 |
|
Total Long Term Liabilities |
£5,563,181 |
-26.4% |
£7,558,800 |
6.5% |
£7,094,345 |
- |
0 |
-100% |
£602,867 |
Capital &
Reserves
|
Date Of Accounts |
30/09/13 |
(%) |
30/09/12 |
(%) |
30/09/11 |
(%) |
30/09/10 |
(%) |
30/09/09 |
|
Called Up Share Capital |
£61,117,332 |
-8.9% |
£67,073,203 |
- |
£67,073,203 |
2.4% |
£65,472,720 |
-1.5% |
£66,454,147 |
|
P & L Account Reserve |
£9,818,795 |
36.1% |
£7,215,248 |
84.8% |
£3,904,598 |
-88.8% |
£34,974,848 |
-12.7% |
£40,082,477 |
|
Revaluation Reserve |
- |
- |
- |
- |
- |
- |
- |
- |
- |
|
Sundry Reserves |
£102,342 |
-8.9% |
£112,315 |
- |
£112,315 |
2.4% |
£109,635 |
-1.5% |
£111,278 |
|
Shareholder Funds |
£71,038,468 |
-4.5% |
£74,400,766 |
4.7% |
£71,090,116 |
-29.3% |
£100,557,204 |
-5.7% |
£106,647,902 |
Other Financial
Items
|
Date Of Accounts |
30/09/13 |
(%) |
30/09/12 |
(%) |
30/09/11 |
(%) |
30/09/10 |
(%) |
30/09/09 |
|
Net Worth |
£71,038,468 |
-4.5% |
£74,400,766 |
4.7% |
£71,090,116 |
-29.3% |
£100,557,204 |
-5.7% |
£106,647,902 |
|
Working Capital |
£53,808,320 |
-11.6% |
£60,870,772 |
6% |
£57,445,164 |
-34% |
£87,025,667 |
-11.6% |
£98,399,555 |
|
Total Assets |
£423,421,227 |
-12.3% |
£482,936,707 |
-1.7% |
£491,199,789 |
-19.2% |
£608,042,693 |
1.6% |
£598,456,503 |
|
Total Liabilities |
£352,382,758 |
-13.7% |
£408,535,941 |
-2.8% |
£420,109,672 |
-17.2% |
£507,485,489 |
3.2% |
£491,808,601 |
|
Net Assets |
£71,038,468 |
-4.5% |
£74,400,766 |
4.7% |
£71,090,116 |
-29.3% |
£100,557,204 |
-5.7% |
£106,647,902 |
Cash Flow
|
Date Of Accounts |
30/09/13 |
(%) |
30/09/12 |
(%) |
30/09/11 |
(%) |
30/09/10 |
(%) |
30/09/09 |
|
Net Cashflow from Operations |
- |
- |
- |
- |
- |
- |
- |
- |
- |
|
Net Cashflow before Financing |
- |
- |
- |
- |
- |
- |
- |
- |
- |
|
Net Cashflow from Financing |
- |
- |
- |
- |
- |
- |
- |
- |
- |
|
Increase in Cash |
- |
- |
- |
- |
- |
- |
- |
- |
- |
Miscellaneous
|
Date Of Accounts |
30/09/13 |
(%) |
30/09/12 |
(%) |
30/09/11 |
(%) |
30/09/10 |
(%) |
30/09/09 |
|
Contingent Liability |
NO |
- |
NO |
- |
NO |
- |
NO |
- |
NO |
|
Capital Employed |
£76,601,650 |
-6.5% |
£81,959,567 |
4.8% |
£78,184,461 |
-22.2% |
£100,557,204 |
-6.2% |
£107,250,769 |
|
Number of Employees |
120 |
16.5% |
103 |
41.1% |
73 |
-11% |
82 |
1.2% |
81 |
|
Auditors |
ERNST & YOUNG LLP |
||||||||
|
Auditor Comments |
The audit report contains no adverse comments |
||||||||
|
Bankers |
|
||||||||
|
Bank Branch Code |
|
|
|
|
|
|
|
|
|
Ratios
|
Date Of Accounts |
30/09/13 |
30/09/12 |
30/09/11 |
30/09/10 |
30/09/09 |
|
Pre-tax profit margin % |
- |
- |
- |
- |
- |
|
Current ratio |
1.16 |
1.15 |
1.14 |
1.17 |
1.20 |
|
Sales/Net Working Capital |
- |
- |
- |
- |
- |
|
Gearing % |
7.80 |
10.20 |
10 |
0 |
0.60 |
|
Equity in % |
16.80 |
15.40 |
14.50 |
16.50 |
17.80 |
|
Creditor Days |
- |
- |
- |
- |
- |
|
Debtor Days |
- |
- |
- |
- |
- |
|
Liquidity/Acid Test |
0.78 |
0.83 |
0.81 |
1.05 |
1.07 |
|
Return On Capital Employed % |
2.51 |
11.29 |
-55.02 |
-3.72 |
42.05 |
|
Return On Total Assets Employed % |
0.45 |
1.91 |
-8.75 |
-0.61 |
7.53 |
|
Current Debt Ratio |
4.88 |
5.38 |
5.80 |
5.04 |
4.60 |
|
Total Debt Ratio |
4.96 |
5.49 |
5.90 |
5.04 |
4.61 |
|
Stock Turnover Ratio % |
- |
- |
- |
- |
- |
|
Return on Net Assets Employed % |
2.71 |
12.44 |
-60.51 |
-3.72 |
42.29 |
FOREIGN
EXCHANGE RATES
N/A
ADDITIONAL
INFORMATION
Current Company
Secretary
|
Name |
Gaynor Antigha Bassey |
Date of Birth |
07/11/1957 |
|
Officers Title |
Ms |
Nationality |
British |
|
Present Appointments |
26 |
Function |
Company Secretary |
|
Appointment Date |
28/09/2007 |
|
|
|
Address |
Cottons Centre, Hay's Lane, London, SE1 2QE |
||
Status History
|
No Status History found |
Event History
|
Date |
Description |
|
21/07/2014 |
Mr E.F. Carmona has left the board |
|
04/07/2014 |
Annual Returns |
|
02/07/2014 |
New Board Member Ms J.L. Sutcliff appointed |
|
11/04/2014 |
New Accounts Filed |
|
05/11/2013 |
Mr T.W. Slack has left the board |
|
05/11/2013 |
New Board Member Mr J.L. Hugh appointed |
|
24/08/2013 |
Annual Returns |
|
16/04/2013 |
New Accounts Filed |
|
16/04/2013 |
New Accounts Filed |
|
14/08/2012 |
Annual Returns |
|
10/07/2012 |
New Accounts Filed |
|
10/07/2012 |
New Accounts Filed |
|
11/11/2011 |
Mr J.B. Laing has left the board |
|
11/11/2011 |
New Board Member Mr T.W. Slack appointed |
|
12/07/2011 |
Annual Returns |
Previous
Company Names
|
Date |
Previous Name |
|
03/05/1991 |
E.D. & F. MAN (SUGAR) LIMITED |
|
31/12/1977 |
E.D. & F. MAN LIMITED |
Previous
Director/Company Secretaries
|
Name |
Current
Directorships |
Previous
Directorships |
|
Jane Alison Moore |
22 |
31 |
|
Farideh Bromfield |
2 |
2 |
|
Katharine Knox |
1 |
2 |
|
Lynn Rosanne Fordham |
6 |
27 |
|
Eduardo Francisco Carmona Alba |
0 |
14 |
|
James Cessford |
4 |
2 |
|
Simon John Mitchell |
2 |
25 |
|
Philip John Woodhouse |
6 |
2 |
|
Sean Martin Diffley |
0 |
1 |
|
Jahn Eric Heller |
0 |
8 |
|
Olivier Maurice Henri Bonavero |
4 |
2 |
|
Micheal John Leslie Attfield |
0 |
1 |
|
Yves Jean Marc Bonavero |
0 |
1 |
|
John Merriman Aarvold |
0 |
2 |
|
John Merriman Aarvold |
0 |
2 |
|
Anne Linda Cuttill |
5 |
62 |
|
John Martineau Kinder |
36 |
30 |
|
John Arthur Pullen |
13 |
30 |
|
Paul Anthony O'Hanlon |
6 |
28 |
|
Jonathan Richard Boyle |
0 |
9 |
|
Robin Graham Bell |
0 |
1 |
|
Keith Jeffrey O'Hana |
0 |
2 |
|
Joan Amanda Goff |
2 |
21 |
|
Barry John Wakefield |
3 |
208 |
|
David Aaron Rosenzweig |
1 |
2 |
|
Alun Wyn Jones |
0 |
2 |
|
Michael John Christopher Stone |
16 |
23 |
|
Stephen Labrooy |
0 |
2 |
|
Michael Stephen Perman |
41 |
73 |
|
Jean Paul Maricot |
0 |
1 |
|
Michael Anthony Justin Cronk |
6 |
8 |
|
Peter Lawrence Clarke |
32 |
51 |
|
Thomas William Slack |
11 |
20 |
|
James Hamilton Proudlock |
3 |
6 |
|
Athol Lee Harley |
0 |
1 |
|
Philip Robert De Pass |
7 |
3 |
|
Bogdan Mark Zaremba |
6 |
11 |
|
Rafael Fernando Muguiro Sartorius |
10 |
21 |
|
Philip Michael Wainwright |
0 |
12 |
|
Christopher Murphy |
0 |
4 |
|
Andrew Hillyer Scott |
14 |
19 |
|
John Bernard Gordon Laing |
9 |
7 |
|
Eduardo Francisco Carmona |
1 |
5 |
NOTES
& COMMENTS
Commentary
|
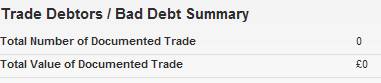
No exact match CCJs are recorded against the company. |
|
|
The company saw an increase in their Cash Balance of 999.9% during the
latest trading period. |
|
|
The audit report contains no adverse comments. |
|
|
There is insufficient data to indicate a change in this company's
percentage of sales. |
|
|
Net Worth decreased by 4.5% during the latest trading period. |
|
|
A 12.3% decline in Total Assets occurred during the latest trading
period. |
|
|
Pre-tax profits decreased by 79.2% compared to the previous trading
period. |
|
|
The company has undergone recent changes in its directorships. |
|
|
The company is part of a group. |
|
|
The company was established over 63 years ago. |
|
FOREIGN EXCHANGE RATES
|
Currency |
Unit
|
Indian Rupees |
|
US Dollar |
1 |
Rs.61.61 |
|
|
1 |
Rs.100.28 |
|
Euro |
1 |
Rs.78.21 |
INFORMATION DETAILS
|
Analysis Done by
: |
DIV |
|
|
|
|
Report Prepared
by : |
NIT |
RATING EXPLANATIONS
|
RATING |
STATUS |
PROPOSED CREDIT LINE |
|
|
|
>86 |
Aaa |
Possesses an extremely sound financial base with the strongest
capability for timely payment of interest and principal sums |
Unlimited |
|
|
71-85 |
Aa |
Possesses adequate working capital. No caution needed for credit
transaction. It has above average (strong) capability for payment of interest
and principal sums |
Large |
|
|
56-70 |
A |
Financial & operational base are regarded healthy. General unfavourable
factors will not cause fatal effect. Satisfactory capability for payment of
interest and principal sums |
Fairly Large |
|
|
41-55 |
Ba |
Overall operation is considered normal. Capable to meet normal
commitments. |
Satisfactory |
|
|
26-40 |
B |
Capability to overcome financial difficulties seems comparatively
below average. |
Small |
|
|
11-25 |
Ca |
Adverse factors are apparent. Repayment of interest and principal sums
in default or expected to be in default upon maturity |
Limited with full
security |
|
|
<10 |
C |
Absolute credit risk exists. Caution needed to be exercised |
Credit not
recommended |
|
|
-- |
NB |
New Business |
-- |
|
This score serves as a reference to assess
SC’s credit risk and to set the amount of credit to be extended. It is
calculated from a composite of weighted scores obtained from each of the major
sections of this report. The assessed factors and their relative weights (as
indicated through %) are as follows:
Financial
condition (40%) Ownership
background (20%) Payment
record (10%)
Credit history
(10%) Market trend (10%) Operational size
(10%)
This report is issued at your request without any
risk and responsibility on the part of MIRA INFORM PRIVATE LIMITED (MIPL)
or its officials.