MIRA
INFORM REPORT
|
Report Date : |
02.10.2014 |
IDENTIFICATION DETAILS
|
Name : |
DELTA TECHNOLOGY LTD |
|
|
|
|
Registered Office : |
Supreme House, |
|
|
|
|
Country : |
|
|
|
|
|
Financials (as on) : |
31.12.2012 |
|
|
|
|
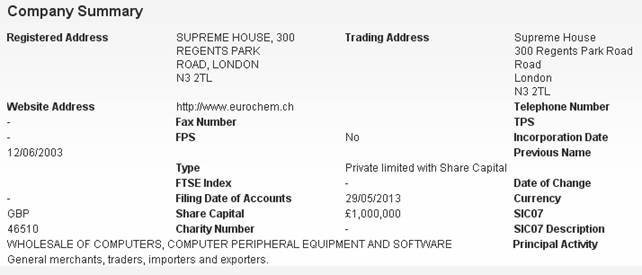
Date of Incorporation : |
12.06.2003 |
|
|
|
|
Com. Reg. No.: |
04797074 |
|
|
|
|
Legal Form : |
Private Limited With Share Capital |
|
|
|
|
Line of Business : |
Wholesale of Computer, Computer Peripheral Equipment and Software. |
|
|
|
|
No of Employees : |
9 |
RATING & COMMENTS
|
MIRA’s Rating : |
Ba |
|
RATING |
STATUS |
PROPOSED CREDIT LINE |
|
|
41-55 |
Ba |
Overall operation is considered normal. Capable to meet normal
commitments. |
Satisfactory |
|
Status : |
Satisfactory |
|
Payment Behaviour : |
No Complaints |
|
Litigation : |
Clear |
NOTES :
Any query related to this report can be made
on e-mail : infodept@mirainform.com
while quoting report number, name and date.
ECGC Country Risk Classification List – June 1, 2014
|
Country Name |
Previous Rating (31.03.2014) |
Current Rating (01.06.2014) |
|
|
A1 |
A1 |
|
Risk Category |
ECGC
Classification |
|
Insignificant |
A1 |
|
Low |
A2 |
|
Moderate |
B1 |
|
High |
B2 |
|
Very High |
C1 |
|
Restricted |
C2 |
|
Off-credit |
D |
The
|
Source
: CIA |
REGISTERED NAME & COMPANY
SUMMARY
Company Name: DELTA
TECHNOLOGY LTD
Company No: 04797074
Company Status: Active - Accounts Filed
Registered Address: Supreme House,
DIRECTORS/MANAGEMENT
|
Total Current Directors |
4 |
|
Total Current Secretaries |
1 |
|
Total Previous Directors / Company Secretaries |
2 |
Current Directors
|
Name |
Mini Bhuwania |
Date of Birth |
21/08/1973 |
|
Officers Title |
Ms |
Nationality |
Indian |
|
Present Appointments |
3 |
Function |
Director |
|
Appointment Date |
04/02/2005 |
|
|
|
Address |
8 Edmunds Walk, |
||
|
Other Actions |
View Director Report |
View Consumer Report |
View AML Report |
|
|
View Trace Report |
|
|
|
Name |
Ashish Bhuwania |
Date of Birth |
14/10/1971 |
|
Officers Title |
Mr |
Nationality |
British |
|
Present Appointments |
4 |
Function |
Director |
|
Appointment Date |
02/02/2005 |
|
|
|
Address |
8 Edmunds Walk, |
||
|
Other Actions |
View Director Report |
View Consumer Report |
View AML Report |
|
|
View Trace Report |
|
|
|
Name |
Saroj Bhuwania |
Date of Birth |
30/06/1958 |
|
Officers Title |
|
Nationality |
Indian |
|
Present Appointments |
1 |
Function |
Director |
|
Appointment Date |
02/02/2005 |
|
|
|
Address |
8 Edmunds Walk, |
||
|
Other Actions |
View Director Report |
View Consumer Report |
View AML Report |
|
|
View Trace Report |
|
|
|
Name |
Arun Bhuwania |
Date of Birth |
30/08/1947 |
|
Officers Title |
Mr |
Nationality |
Indian |
|
Present Appointments |
1 |
Function |
Director |
|
Appointment Date |
02/02/2005 |
|
|
|
Address |
8 Edmunds Walk, |
||
|
Other Actions |
View Director Report |
View Consumer Report |
View AML Report |
|
|
View Trace Report |
|
|
Current Company
Secretary
|
Name |
Ashish Bhuwania |
Date of Birth |
14/10/1971 |
|
Officers Title |
Mr |
Nationality |
British |
|
Present Appointments |
4 |
Function |
Company Secretary |
|
Appointment Date |
02/02/2005 |
|
|
|
Address |
8 Edmunds Walk, |
||
Previous
Director/Company Secretaries
|
Name |
Current Directorships |
Previous Directorships |
|
NOMINEE DIRECTOR LTD |
577 |
3230 |
|
NOMINEE SECRETARIES LTD |
3049 |
5552 |
NEGATIVE INFORMATION
Mortgage Summary
Total Mortgage
2
Outstanding
1
Satisfied
1
CCJ
|
Total Number of Exact CCJs
- |
0 |
Total Value of Exact CCJs
- |
|
|
Total Number of Possible CCJs
- |
0 |
Total Value of Possible CCJs
- |
|
|
Total Number of Satisfied CCJs - |
0 |
Total Value of Satisfied CCJs
- |
|
|
Total Number of Writs - |
- |
|
|
Mortgage Details
|
Mortgage Type: |
RENT DEPOSIT DEED |
||
|
Date Charge Created: |
12/12/11 |
|
|
|
Date Charge Registered: |
15/12/11 |
|
|
|
Date Charge Satisfied: |
- |
|
|
|
Status: |
OUTSTANDING |
|
|
|
Person(s) Entitled: |
REGENTS OFFICE PARK LIMITED |
||
|
Amount Secured: |
£13,200 AND ALL OTHER MONIES DUE OR TO
BECOME DUE FROM THE COMPANY TO THE CHARGEE UNDER THE TERMS OFTHE
AFOREMENTIONEDINSTRUMENT CREATING OR EVIDENCING THE CHARGE |
||
|
Details: |
THE SUM OF £13,200 SEE IMAGE FOR FULL
DETAILS |
||
|
|
|
||
|
Mortgage Type: |
FIXED AND FLOATING CHARGE |
||
|
Date Charge Created: |
08/09/05 |
|
|
|
Date Charge Registered: |
10/09/05 |
|
|
|
Date Charge Satisfied: |
08/09/07 |
|
|
|
Status: |
SATISFIED |
|
|
|
Person(s) Entitled: |
THE ROYAL BANK OF SCOTLAND COMMERCIAL
SERVICES LIMITED |
||
|
Amount Secured: |
ALL MONIES DUE OR TO BECOME DUE FROM THE
COMPANY TO THE CHARGEE UNDER THE TERMSOF THE AFOREMENTIONEDINSTRUMENT
CREATING OR EVIDENCING THE CHARGE |
||
|
Details: |
FIXED AND FLOATING CHARGES OVER THE
UNDERTAKING AND ALL PROPERTY AND ASSETS PRESENT AND FUTURE INCLUDING GOODWILL
BOOKDEBTS UNCALLED CAPITAL BUILDINGS FIXTURESFIXED PLANT AND MACHINERY SEE
THE MORTGAGE CHARGE DOCUMENT FOR FULL DETAILS |
||
SHARE & SHARE CAPITAL
INFORMATION
Top 20
Shareholders
|
Name |
Currency |
Share Count |
Share Type |
Nominal Value |
% of Total Share Count |
|
DELTA TRADE INTERNATIONAL LTD |
GBP |
1,000,000 |
ORDINARY |
1 |
100 |
PAYMENT INFORMATION
Trade Debtors / Bad
Debt Summary
Total Number of Documented Trade 0
Total Value of Documented Trade £0
Trade Payment
Information
|
Average Invoice Value |
73.94 |
|
Invoices available |
14 |
|
Paid |
14 |
|
Outstanding |
0 |
Trade Payment Data is information that we collect from selected third
party partners who send us information about their whole sales ledger.
|
Average Invoice Value |
£73.94 |
|
Invoices available |
14 |
|
Paid |
14 |
|
Outstanding |
0 |
|
Trade Payment Data is information that we
collect from selected third party partners who send us information about
their whole sales ledger. |
|
|
Within Terms |
0-30 Days |
31-60 Days |
61-90 Days |
91+ Days |
|
Paid |
3 |
7 |
2 |
2 |
0 |
|
Outstanding |
0 |
0 |
0 |
0 |
0 |
GROUP STRUCTURE & AFFILIATED
COMPANIES
Statistics
|
Group |
3 companies |
|
Linkages |
0 companies |
|
Countries |
In 0 countries |
Summary
|
Holding Company |
DELTA TRADE INTERNATIONAL LIMITED |
|
Ownership Status |
Wholly Owned |
|
Ultimate Holding Company |
AVENUE MARKETING LTD |
Group structure
|
Company Name |
Registered
Number |
Latest Key
Financials |
Consol. Accounts |
Turnover |
|
AVENUE MARKETING
LTD |
N/A |
- |
- |
|
|
DELTA TRADE
INTERNATIO... |
02470747 |
31.12.2012 |
Y |
£21,607,766 |
|
DELTA TECHNOLOGY
LTD |
04797074 |
31.12.2012 |
N |
£21,607,766 |
FINANCIAL INFORMATION
Profit & Loss
|
Date Of Accounts |
31/12/12 |
(%) |
31/12/11 |
(%) |
31/12/10 |
(%) |
31/12/09 |
(%) |
31/12/08 |
|
Weeks |
52 |
(%) |
52 |
(%) |
52 |
(%) |
52 |
(%) |
52 |
|
Currency |
GBP |
(%) |
GBP |
(%) |
GBP |
(%) |
GBP |
(%) |
GBP |
|
Consolidated A/cs |
N |
(%) |
N |
(%) |
N |
(%) |
N |
(%) |
N |
|
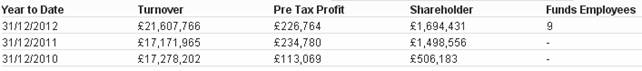
Turnover |
£21,607,766 |
25.8% |
£17,171,965 |
-0.6% |
£17,278,202 |
102.7% |
£8,522,692 |
-4.3% |
£8,905,927 |
|
Export |
£20,141,647 |
25.1% |
£16,094,351 |
-2.2% |
£16,458,209 |
107.9% |
£7,915,386 |
-6.2% |
£8,434,633 |
|
Cost of Sales |
£20,501,559 |
25.7% |
£16,305,835 |
-1.5% |
£16,558,131 |
106.6% |
£8,013,679 |
-6.1% |
£8,531,590 |
|
Gross Profit |
£1,106,207 |
27.7% |
£866,130 |
20.3% |
£720,071 |
41.5% |
£509,013 |
36% |
£374,337 |
|
Wages & Salaries |
£171,610 |
- |
- |
- |
- |
- |
- |
- |
- |
|
Directors Emoluments |
£55,125 |
- |
- |
- |
- |
- |
- |
- |
- |
|
Operating Profit |
£228,328 |
-5% |
£240,418 |
107.4% |
£115,917 |
92.5% |
£60,217 |
2.5% |
£58,725 |
|
Depreciation |
£4,876 |
3.1% |
£4,729 |
-11.5% |
£5,343 |
88.7% |
£2,831 |
161.9% |
£1,081 |
|
Audit Fees |
£6,000 |
9.1% |
£5,500 |
10% |
£5,000 |
- |
£5,000 |
- |
£5,000 |
|
Interest Payments |
£1,564 |
-72.3% |
£5,638 |
98% |
£2,848 |
-31.1% |
£4,136 |
-11.1% |
£4,655 |
|
Pre Tax Profit |
£226,764 |
-3.4% |
£234,780 |
107.6% |
£113,069 |
101.6% |
£56,082 |
3.5% |
£54,207 |
|
Taxation |
-£30,889 |
27.2% |
-£42,407 |
-56.1% |
-£27,166 |
-128.7% |
-£11,878 |
-5.5% |
-£11,257 |
|
Profit After Tax |
£195,875 |
1.8% |
£192,373 |
123.9% |
£85,903 |
94.3% |
£44,204 |
2.9% |
£42,950 |
|
Dividends Payable |
- |
- |
- |
- |
- |
- |
- |
- |
- |
|
Retained Profit |
£195,875 |
1.8% |
£192,373 |
123.9% |
£85,903 |
94.3% |
£44,204 |
2.9% |
£42,950 |
Balance Sheet
|
Date Of Accounts |
31/12/12 |
(%) |
31/12/11 |
(%) |
31/12/10 |
(%) |
31/12/09 |
(%) |
31/12/08 |
|
Tangible Assets |
£23,328 |
64.4% |
£14,187 |
-11.5% |
£16,030 |
88.8% |
£8,491 |
162% |
£3,241 |
|
Intangible Assets |
0 |
- |
0 |
- |
0 |
- |
0 |
- |
0 |
|
Total Fixed Assets |
£23,328 |
64.4% |
£14,187 |
-11.5% |
£16,030 |
88.8% |
£8,491 |
162% |
£3,241 |
|
Stock |
£1,242,598 |
-13.4% |
£1,434,231 |
-2.8% |
£1,476,187 |
115% |
£686,667 |
-51% |
£1,402,604 |
|
Trade Debtors |
£3,503,110 |
47.1% |
£2,381,798 |
191.5% |
£817,202 |
-35.6% |
£1,268,868 |
22.9% |
£1,032,724 |
|
Cash |
£114,562 |
-39.2% |
£188,374 |
243.4% |
£54,852 |
999.9% |
£25 |
-99.6% |
£6,609 |
|
Other Debtors |
£262,045 |
-42.7% |
£457,172 |
-72.4% |
£1,654,817 |
999.9% |
£92,836 |
9.4% |
£84,886 |
|
Miscellaneous Current Assets |
0 |
- |
0 |
- |
0 |
- |
0 |
- |
0 |
|
Total Current Assets |
£5,122,315 |
14.8% |
£4,461,575 |
11.5% |
£4,003,058 |
95.4% |
£2,048,396 |
-18.9% |
£2,526,823 |
|
Trade Creditors |
£2,672,676 |
41.8% |
£1,884,299 |
-45.6% |
£3,465,873 |
116.4% |
£1,601,366 |
-9.6% |
£1,770,804 |
|
Bank Loans & Overdrafts |
0 |
- |
0 |
- |
0 |
-100% |
£3,130 |
614.6% |
£438 |
|
Other Short Term Finance |
£37,906 |
-96.2% |
£1,004,859 |
- |
0 |
- |
0 |
-100% |
£297,445 |
|
Miscellaneous Current Liabilities |
£87,356 |
2.5% |
£85,211 |
94.4% |
£43,826 |
44.5% |
£30,328 |
-64.2% |
£84,620 |
|
Total Current Liabilities |
£2,797,938 |
-5.9% |
£2,974,369 |
-15.3% |
£3,509,699 |
114.7% |
£1,634,824 |
-24.1% |
£2,153,307 |
|
Bank Loans & Overdrafts and LTL |
£653,274 |
999.9% |
£2,837 |
-11.5% |
£3,206 |
-34.7% |
£4,913 |
339.1% |
£1,119 |
|
Other Long Term Finance |
£650,000 |
- |
0 |
- |
0 |
- |
0 |
- |
0 |
|
Total Long Term Liabilities |
£653,274 |
999.9% |
£2,837 |
-11.5% |
£3,206 |
79.8% |
£1,783 |
161.8% |
£681 |
Capital &
Reserves
|
Date Of Accounts |
31/12/12 |
(%) |
31/12/11 |
(%) |
31/12/10 |
(%) |
31/12/09 |
(%) |
31/12/08 |
|
Called Up Share Capital |
£1,000,000 |
- |
£1,000,000 |
400% |
£200,000 |
- |
£200,000 |
- |
£200,000 |
|
P & L Account Reserve |
£694,431 |
39.3% |
£498,556 |
62.8% |
£306,183 |
39% |
£220,280 |
25.1% |
£176,076 |
|
Revaluation Reserve |
- |
- |
- |
- |
- |
- |
- |
- |
- |
|
Sundry Reserves |
- |
- |
- |
- |
- |
- |
- |
- |
- |
|
Shareholder Funds |
£1,694,431 |
13.1% |
£1,498,556 |
196.1% |
£506,183 |
20.4% |
£420,280 |
11.8% |
£376,076 |
Other Financial
Items
|
Date Of Accounts |
31/12/12 |
(%) |
31/12/11 |
(%) |
31/12/10 |
(%) |
31/12/09 |
(%) |
31/12/08 |
|
Net Worth |
£1,694,431 |
13.1% |
£1,498,556 |
196.1% |
£506,183 |
20.4% |
£420,280 |
11.8% |
£376,076 |
|
Working Capital |
£2,324,377 |
56.3% |
£1,487,206 |
201.4% |
£493,359 |
19.3% |
£413,572 |
10.7% |
£373,516 |
|
Total Assets |
£5,145,643 |
15% |
£4,475,762 |
11.4% |
£4,019,088 |
95.4% |
£2,056,887 |
-18.7% |
£2,530,064 |
|
Total Liabilities |
£3,451,212 |
15.9% |
£2,977,206 |
-15.2% |
£3,512,905 |
114.6% |
£1,636,607 |
-24% |
£2,153,988 |
|
Net Assets |
£1,694,431 |
13.1% |
£1,498,556 |
196.1% |
£506,183 |
20.4% |
£420,280 |
11.8% |
£376,076 |
Cash Flow
|
Date Of Accounts |
31/12/12 |
(%) |
31/12/11 |
(%) |
31/12/10 |
(%) |
31/12/09 |
(%) |
31/12/08 |
|
Net Cashflow from Operations |
-£35,939 |
94.5% |
-£649,316 |
-956.3% |
£75,825 |
179.8% |
£27,096 |
114.4% |
-£188,311 |
|
Net Cashflow before Financing |
-£73,812 |
88.9% |
-£666,478 |
-999.9% |
£57,957 |
724.8% |
-£9,276 |
95.6% |
-£211,396 |
|
Net Cashflow from Financing |
- |
-100% |
£800,000 |
- |
- |
- |
- |
-100% |
£199,000 |
|
Increase in Cash |
-£73,812 |
-155.3% |
£133,522 |
130.4% |
£57,957 |
724.8% |
-£9,276 |
25.2% |
-£12,396 |
Miscellaneous
|
Date Of Accounts |
31/12/12 |
(%) |
31/12/11 |
(%) |
31/12/10 |
(%) |
31/12/09 |
(%) |
31/12/08 |
|
Contingent Liability |
NO |
- |
NO |
- |
NO |
- |
NO |
- |
NO |
|
Capital Employed |
£2,347,705 |
56.4% |
£1,501,393 |
194.7% |
£509,389 |
20.7% |
£422,063 |
12% |
£376,757 |
|
Number of Employees |
9 |
- |
- |
- |
- |
- |
- |
- |
- |
|
Auditors |
|
||||||||
|
Auditor Comments |
The audit report contains no adverse comments |
||||||||
|
Bankers |
NATIONAL WESTMINSTER BANK PLC |
||||||||
|
Bank Branch Code |
60-15-08 |
||||||||
Ratios
|
Date Of Accounts |
31/12/12 |
31/12/11 |
31/12/10 |
31/12/09 |
31/12/08 |
|
Pre-tax profit margin % |
1.05 |
1.37 |
0.65 |
0.66 |
0.61 |
|
Current ratio |
1.83 |
1.50 |
1.14 |
1.25 |
1.17 |
|
Sales/Net Working Capital |
9.30 |
11.55 |
35.02 |
20.61 |
23.84 |
|
Gearing % |
38.60 |
0.20 |
0.60 |
1.20 |
0.30 |
|
Equity in % |
32.90 |
33.50 |
12.60 |
20.40 |
14.90 |
|
Creditor Days |
45.02 |
39.94 |
73.01 |
68.39 |
72.37 |
|
Debtor Days |
59.01 |
50.48 |
17.21 |
54.19 |
42.20 |
|
Liquidity/Acid Test |
1.38 |
1.01 |
0.71 |
0.83 |
0.52 |
|
Return On Capital Employed % |
9.65 |
15.63 |
22.19 |
13.28 |
14.38 |
|
Return On Total Assets Employed % |
4.40 |
5.24 |
2.81 |
2.72 |
2.14 |
|
Current Debt Ratio |
1.65 |
1.98 |
6.93 |
3.88 |
5.72 |
|
Total Debt Ratio |
2.03 |
1.98 |
6.93 |
3.89 |
5.72 |
|
Stock Turnover Ratio % |
5.75 |
8.35 |
8.54 |
8.05 |
15.74 |
|
Return on Net Assets Employed % |
13.38 |
15.66 |
22.33 |
13.34 |
14.41 |
FOREIGN EXCHANGE RATES
Na
ADDITIONAL INFORMATION
Status History
|
No Status History found |
Event History
|
Date |
Description |
|
06/05/2014 |
Annual Returns |
|
11/06/2013 |
New Accounts Filed |
|
11/06/2013 |
New Accounts Filed |
|
14/05/2013 |
Annual Returns |
|
11/05/2012 |
Annual Returns |
|
27/04/2012 |
New Accounts Filed |
|
19/04/2012 |
Change of Company Postcode |
|
08/10/2011 |
New Accounts Filed |
|
06/10/2011 |
Change of Company Postcode |
|
31/05/2011 |
Annual Returns |
|
01/02/2011 |
New Accounts Filed |
|
01/02/2011 |
New Accounts Filed |
|
09/06/2010 |
Annual Returns |
|
11/11/2009 |
New Accounts Filed |
|
15/05/2009 |
Annual Returns |
Previous Company Names
|
No Previous Names found |
NOTES & COMMENTS
Commentary
|
No exact match CCJs
are recorded against the company. |
|
|
Sales in the latest trading period increased
25.8% on the previous trading period. |
|
|
Net Worth increased by 13.1% during the
latest trading period. |
|
|
Pre-tax profits decreased by 3.4% compared
to the previous trading period. |
|
|
A 15% growth in Total Assets occurred during
the latest trading period. |
|
|
The company saw a decrease in their Cash
Balance of 39.2% during the latest trading period. |
|
|
The audit report contains no adverse
comments. |
|
|
No recent changes in directorship are
recorded. |
|
|
The company is part of a group. |
|
|
The company was established over 11 years
ago. |
|
FOREIGN EXCHANGE RATES
|
Currency |
Unit
|
Indian Rupees |
|
US Dollar |
1 |
Rs.61.75 |
|
|
1 |
Rs.100.07 |
|
Euro |
1 |
Rs.77.95 |
INFORMATION DETAILS
|
Analysis Done by
: |
RAS |
|
|
|
|
Report Prepared
by : |
TPT |
RATING EXPLANATIONS
|
RATING |
STATUS |
PROPOSED CREDIT LINE |
|
|
>86 |
Aaa |
Possesses an extremely sound financial base with the strongest
capability for timely payment of interest and principal sums |
Unlimited |
|
71-85 |
Aa |
Possesses adequate working capital. No caution needed for credit
transaction. It has above average (strong) capability for payment of interest
and principal sums |
Large |
|
56-70 |
A |
Financial & operational base are regarded healthy. General unfavourable factors will not cause fatal effect.
Satisfactory capability for payment of interest and principal sums |
Fairly Large |
|
41-55 |
Ba |
Overall
operation is considered normal. Capable to meet normal commitments. |
Satisfactory |
|
26-40 |
B |
Capability to overcome financial difficulties seems comparatively
below average. |
Small |
|
11-25 |
Ca |
Adverse factors are apparent. Repayment of interest and principal sums
in default or expected to be in default upon maturity |
Limited with
full security |
|
<10 |
C |
Absolute credit risk exists. Caution needed to be exercised |
Credit not
recommended |
|
-- |
NB |
New Business |
-- |
This score serves as a reference to assess SC’s credit risk
and to set the amount of credit to be extended. It is calculated from a
composite of weighted scores obtained from each of the major sections of this report.
The assessed factors and their relative weights (as indicated through %) are as
follows:
Financial
condition (40%) Ownership
background (20%) Payment
record (10%)
Credit history
(10%) Market trend
(10%) Operational
size (10%)
This report is issued at your request without any
risk and responsibility on the part of MIRA INFORM PRIVATE LIMITED (MIPL)
or its officials.