MIRA
INFORM REPORT
|
Report Date : |
04.10.2014 |
IDENTIFICATION DETAILS
|
Name : |
IRMAOS VILA NOVA SA |
|
|
|
|
Registered Office : |
Avenida das Industrias, 511, Lugar de Sam, Apartado 7079
Ribeirao 4760-725-Ribeirao |
|
|
|
|
Country : |
|
|
|
|
|
Financials (as on) : |
2013 |
|
|
|
|
Date of Incorporation : |
01.06.1987 |
|
|
|
|
Com. Reg. No.: |
501997784 |
|
|
|
|
Legal Form : |
Joint Stock Company |
|
|
|
|
Line of Business : |
Wholesale of clothing and accessories |
|
|
|
|
No. of Employees : |
307 |
RATING & COMMENTS
|
MIRA’s Rating : |
Ba |
|
RATING |
STATUS |
PROPOSED CREDIT LINE |
|
|
41-55 |
Ba |
Overall operation is considered normal. Capable to meet normal
commitments. |
Satisfactory |
|
Status : |
Satisfactory |
|
Payment Behaviour : |
No complaints |
|
Litigation : |
Clear |
NOTES :
Any query related to this report can be made
on e-mail : infodept@mirainform.com
while quoting report number, name and date.
ECGC Country Risk Classification List – June 1, 2014
|
Country Name |
Previous Rating (31.03.2014) |
Current Rating (01.06.2014) |
|
Portugal |
B1 |
B1 |
|
Risk Category |
ECGC
Classification |
|
Insignificant |
A1 |
|
Low |
A2 |
|
Moderate |
B1 |
|
High |
B2 |
|
Very High |
C1 |
|
Restricted |
C2 |
|
Off-credit |
D |
PORTUGAL - ECONOMIC OVERVIEW
Portugal has become a diversified and increasingly
service-based economy since joining the European Community - the EU's
predecessor - in 1986. Over the following two decades, successive governments
privatized many state-controlled firms and liberalized key areas of the
economy, including the financial and telecommunications sectors. The country
qualified for the Economic and Monetary Union (EMU) in 1998 and began
circulating the euro on 1 January 2002 along with 11 other EU members. The
economy grew by more than the EU average for much of the 1990s, but the rate of
growth slowed in 2001-08. The economy contracted in 2009, and fell again from
2011 to 2013, as the government implemented spending cuts and tax increases to
comply with conditions of an EU-IMF financial rescue package, signed in May
2011. Austerity measures also have contributed to record unemployment and a
wave of emigration not seen since the 1960s. Booming exports will contribute to
growth and employment in 2014, but the need to continue to reduce private- and
public-sector debt could weigh on consumption and investment. The government of
Pedro PASSOS COELHO has stated its intention to reduce labor market rigidity,
and, this, along with steps to trim the budget deficit, could make Portugal more
attractive to foreign investors. The government reduced the budget deficit from
10.1% of GDP in 2009 to 5.1% in 2013, lower than the EU-IMF fiscal target of
5.5%. Despite these efforts, public debt has continued to grow and, in 2013,
stands among the highest in the EU. As a result, the government may have
difficulty regaining full bond market financing when the EU-IMF financing
program expires in May 2014.
|
Source
: CIA |
Identification
|
Name |
IRMAOS VILA NOVA SA |
|
V.A.T. Number / NIF |
501997784 |
|
Denomination |
Salsa |
|
Address |
Avenida das Industrias, 511,
Lugar de Sam, Apartado 7079 |
|
Locality |
Ribeirao |
|
Postal Code |
4760-725-RIBEIRAO |
|
Municipality |
VILA NOVA DE FAMALICAO |
|
District |
BRAGA |
|
Telephone |
252450100 |
|
Fax |
252492646 |
|
E-Mail |
info@ivn2.ivn.pt |
|
Web Site |
www.salsa.p/ www.ivn.pt |
|
|
|
|
C.A.E.(Rev 3) |
46421- Wholesale of clothing
and accessories |
Financial Highlights
|
|
2011 |
|
2012 |
|
2013 |
|
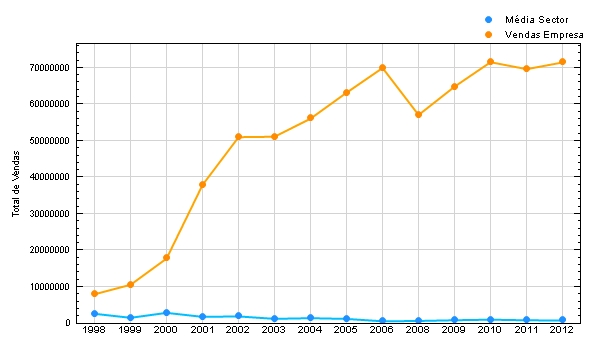
Net Sales |
69.683.565,96 |
|
71.517.319,74 |
|
73.996.273,47 |
|
Net Income For the Year |
8.419.608,86 |
|
6.295.633,74 |
|
7.264.825,43 |
|
Shareholders Funds |
13.099.730,04 |
|
12.192.152,11 |
|
11.891.370,92 |
|
Stocks |
17.735.188,37 |
|
15.617.503,03 |
|
17.081.205,18 |
|
LIABILITY |
25.083.628,36 |
|
25.311.227,09 |
|
27.138.560,76 |
|
ASSETS |
38.183.358,40 |
|
37.503.379,20 |
|
39.029.931,68 |
Sales - Sector Comparison
Summary
|
Legal Form |
Joint Stock Company |
|
Constitution |
01-06-1987 |
|
V.A.T. Number / NIF |
501997784 |
|
Employees |
307 |
|
Capital |
4.250.000,00 |
|
Sales in : 31-12-2013 |
73.996.273,47 |
|
Shareholders Funds in:
31-12-2013 |
11.891.370,92 |
|
Payments |
Good |
|
Actual Condition |
In activity |
|
Governing Bodies |
|
|
|
|
Board of Director's |
|
|
FILIPE FERNANDO VILA NOVA
AZEVEDO COSTA |
Shareholder and Board of
Director's Pres. |
|
CELSO MANUEL CAMILO MARTINS
POCAS |
Administrator |
|
|
|
|
Fiscal Board |
|
|
ANTONIO MANUEL ALVES DE SOUSA
MARTINS |
Fiscal Board Substitute |
|
ARMINDO COSTA,SERRA
CRUZ,MARTINS E ASSOCIADOS-SROC |
Unique Fiscal |
Legal Structure
|
Registed on the Register Record
Office of Vila Nova de Famalicao with the Register Number 501997784 previous
number 2104 in 01-06-1988 |
|
Constitution celebrated in
01-06-1987 published on Diário da República number 146 of 02-07-1988 |
|
To oblige the company it is
necessary 2 signature |
Changes to Society
|
In 04-08-2014 on Portal MJ of
07-08-2014 board of director's change |
|
In 17-02-2013 on Portal MJ of
23-12-2013 board of director's change |
|
In 04-09-2012 on Portal MJ of
07-09-2012 board of director's change |
|
In 17-07-2012 on Portal MJ of
28-08-2012 board of director's change |
|
In 09-03-2012 on Portal MJ of
08-05-2012 board of director's change |
|
Capital |
|
The Capital is 4.250.000,00 ,
divided in 850000 shares , with a nominal value of 5,00 |
|
|
with the following
shareholders |
|
FILIPE FERNANDO VILA NOVA
AZEVEDO COSTA |
3.612.500,00 |
85% |
|
Activities |
|
Line of Business |
Percentage |
|
Manufacture and sale of clothing and accessories |
100% |
|
Geographic Distribution of Sales |
|
|
Internal Market |
|
International Market |
|
|
Year |
|
EU |
Extra-EU |
Total |
|
|
2013 |
31.430.092,32 |
42,48% |
31.776.257,60 |
42,94% |
10.789.923,55 |
14,58% |
73.996.273,47 |
|
|
2012 |
31.173.978,55 |
43,59% |
29.121.550,61 |
40,72% |
11.221.790,58 |
15,69% |
71.517.319,74 |
|
|
2011 |
33.614.812,24 |
48,24% |
26.356.380,88 |
37,82% |
9.712.372,84 |
13,94% |
69.683.565,96 |
|
|
2010 |
39.383.901,93 |
55,01% |
23.804.070,43 |
33,25% |
8.400.601,17 |
11,73% |
71.588.573,53 |
|
|
Geographic Distribution of Purchases |
|
|
Internal Market |
|
International Market |
|
|
Year |
|
EU |
Extra-EU |
Total |
|
|
2013 |
26.348.934,78 |
63,49% |
6.680.784,93 |
16,10% |
8.472.261,67 |
20,41% |
41.501.981,38 |
|
|
2012 |
30.982.733,90 |
82,57% |
644.705,58 |
1,72% |
5.896.522,85 |
15,71% |
37.523.962,33 |
|
|
2011 |
24.946.183,54 |
63,78% |
6.511.967,23 |
16,65% |
7.656.744,72 |
19,58% |
39.114.895,49 |
|
|
2010 |
20.140.339,73 |
51,79% |
9.591.298,63 |
24,67% |
9.153.256,24 |
23,54% |
38.884.894,60 |
|
|
Trade Marks |
|
Salsa |
|
Denominations |
|
Salsa |
|
Banks and Financial Institutions |
|
BANCO SANTANDER TOTTA SA |
Centro Empresas Guimarães |
|
CAIXA GERAL DE DEPOSITOS, SA |
Vila Nova de Famalicao |
|
BANCO BPI, SA |
Trofa |
|
NOVO BANCO, SA |
Trofa |
|
CAIXA DE CREDITO AGRICOLA
MUTUO |
Vila Nova de Famalicao |
|
Incidents |
|
Legal Actions |
|
Date |
Process |
Author |
Type |
Amount |
Judicial District |
Court |
Situation |
|
|
228783/11.2YIPRT |
|
Especial
Cump.Obrig. Pecuniarias DL 269/98 |
15.375,00 |
Vila
Nova de Famalicão-Juízos Compet. Cível de V.N.Famalicão |
5 |
Resolvida |
|
|
3093/10.9TJVNF |
|
Sumária |
21.002,91 |
Vila
Nova de Famalicão-Juízos Compet. Cível de V.N.Famalicão |
3 |
Resolvida |
|
Employees |
|
Year |
Total |
Men |
Women |
|
|
2013
|
307 |
187 |
61% |
120 |
39% |
|
|
2012
|
349 |
225 |
64% |
124 |
36% |
|
|
2011
|
315 |
204 |
65% |
111 |
35% |
|
|
2010
|
288 |
191 |
66% |
97 |
34% |
|
|
Insurance |
|
Companhia de Seguros Açoreana
SA |
|
Império Bonança Companhia de
Seguros SA |
|
Tranquilidade Seguros SA |
|
Crédito Agrícola Seguros SA |
|
Head Office and Installations |
|
Head office, warehouse and
factory owned Avenidas das Indústrias, 511, Lugar de Sam, Apartado 7079 ,
Ribeirao, 4760-725, RIBEIRAO-VILA NOVA DE FAMALICAO, Tel:252450200,
Fax:252492646 |
|
Special Information |
|
Event |
General Description |
|
Merge |
A 28 de Dezembro de 2010,
fusão mediante a transferência global do património da firma Irmãos Vila Nova
II-Indsustria de Confeções SA na titular. |
Financial Demonstration SNC
|
Balance Sheet SNC |
||
|
CoinEUROS |
|
Year:2013 |
|
|
||
|
|
2013 |
2012 |
2011 |
% Var.2013/2012 |
|
ASSET |
|
|||||
|
|
|
|
|
|
|
|
|
Non-current assets |
|
|||||
|
|
|
|
|
|
|
|
|
Tangible fixed assets |
1.500.035,47 |
1.180.597,80 |
980.976,90 |
27,06 |
|
|
|
Intangible assets |
131.732,02 |
132.898,27 |
80.685,09 |
(0,88) |
|
|
|
Deferred tax assets |
44.257,99 |
93.544,64 |
87.857,34 |
(52,69) |
|
|
|
Total |
|
|
|
|
|
|
|
|
|
|
|
|
|
|
|
Current assets |
|
|||||
|
|
|
|
|
|
|
|
|
Inventories |
17.081.205,18 |
15.617.503,03 |
17.735.188,37 |
9,37 |
|
|
|
Costumers |
15.248.799,69 |
12.683.126,64 |
13.340.958,17 |
20,23 |
|
|
|
Advances to suppliers |
37.250,29 |
13.521,08 |
|
175,50 |
|
|
|
State and other public
entities |
100.555,63 |
362.490,59 |
249.625,00 |
(72,26) |
|
|
|
Shareholders/partners |
2.990.643,86 |
4.006.315,37 |
2.337.641,04 |
(25,35) |
|
|
|
Other accounts receivable |
254.791,11 |
451.521,09 |
437.957,49 |
(43,57) |
|
|
|
Deferrals |
280.434,01 |
328.455,28 |
386.709,89 |
(14,62) |
|
|
|
Other financial assets |
67.505,93 |
67.500,00 |
|
0,01 |
|
|
|
Cashier and bank deposits |
1.292.720,50 |
2.565.905,41 |
2.545.759,11 |
(49,62) |
|
|
|
Total |
|
|
|
|
|
|
|
|
|
|
|
|
|
|
|
TOTAL ASSET |
|
|
|
|
|
|
|
|
|
|
|
|
|
|
|
SHAREHOLDERS FUNDS AND
LIABILITIES |
|
|||||
|
|
|
|
|
|
|
|
|
SHAREHOLDERS FUNDS |
|
|||||
|
|
|
|
|
|
|
|
|
Capital |
4.250.000,00 |
4.250.000,00 |
4.250.000,00 |
|
|
|
|
Legal reserves |
1.150.000,00 |
1.150.000,00 |
1.150.000,00 |
|
|
|
|
Other reserves |
925.853,77 |
925.853,77 |
925.853,77 |
|
|
|
|
Net retained |
774.701,65 |
2.038.561,75 |
1.316.051,78 |
(62,00) |
|
|
|
Other shareholders funds
changes |
25.990,07 |
32.102,85 |
38.215,63 |
(19,04) |
|
|
|
Total |
|
|
|
|
|
|
|
|
|
|
|
|
|
|
|
Net income for the period |
7.264.825,43 |
6.295.633,74 |
8.419.608,86 |
15,39 |
|
|
|
Antecipated dividends |
(2.500.000,00) |
(2.500.000,00) |
(3.000.000,00) |
|
|
|
|
TOTAL OF SHAREHOLDERS
FUNDS |
|
|
|
|
|
|
|
|
|
|
|
|
|
|
|
LIABILITY |
|
|||||
|
|
|
|
|
|
|
|
|
Non-current liiabilities |
|
|||||
|
|
|
|
|
|
|
|
|
Financing obtained |
4.004.676,74 |
4.481.413,16 |
4.468.463,76 |
(10,64) |
|
|
|
Diferred taxes liabilities |
6.497,51 |
8.025,71 |
9.553,91 |
(19,04) |
|
|
|
Total |
|
|
|
|
|
|
|
|
|
|
|
|
|
|
|
Current liabilities |
|
|||||
|
|
|
|
|
|
|
|
|
Suppliers |
14.052.740,80 |
14.464.426,07 |
14.423.885,07 |
(2,85) |
|
|
|
Advances from costumers |
14.920,32 |
1.321,26 |
|
1.029,25 |
|
|
|
State and other public
entities |
2.867.011,02 |
2.727.747,84 |
2.557.072,23 |
5,11 |
|
|
|
Financing obtained |
3.502.098,24 |
1.128.515,29 |
1.826.574,91 |
210,33 |
|
|
|
Other payable accounts |
2.690.616,13 |
2.499.777,76 |
1.798.078,48 |
7,63 |
|
|
|
Total |
|
|
|
|
|
|
|
|
|
|
|
|
|
|
|
TOTAL LIABILITIES |
|
|
|
|
|
|
|
|
|
|
|
|
|
|
|
TOTAL SHAREHOLDERS FUNDS
AND LIABILITIES |
|
|
|
|
|
|
|
|
|
|
|
|
|
|
|
INCOME STATEMENT |
|
|||||
|
|
|
|
|
|
|
|
|
INCOME AND EXPENSES |
|
|||||
|
|
|
|
|
|
|
|
|
Sales and services |
73.996.273,47 |
71.517.319,74 |
69.683.565,96 |
3,47 |
|
|
|
Operating government grants |
4.129,84 |
6.338,93 |
12.957,36 |
(34,85) |
|
|
|
Variation in production
inventories |
2.177.784,25 |
(1.101.386,22) |
385.464,97 |
(297,73) |
|
|
|
Cost of goods sold and
materials consumed |
41.284.231,30 |
36.780.113,75 |
35.590.675,98 |
12,25 |
|
|
|
Suppliers and external
services |
15.738.153,18 |
16.258.565,51 |
14.475.342,39 |
(3,20) |
|
|
|
Personnel costs |
7.384.656,24 |
7.510.883,37 |
7.601.659,93 |
(1,68) |
|
|
|
Impairment of inventories
(losses/revearsals) |
517.282,74 |
156.208,01 |
652.355,90 |
231,15 |
|
|
|
Impairment of receivables
(losses/revearsals) |
383.647,75 |
394.501,26 |
31.648,25 |
(2,75) |
|
|
|
Provisions
(increases/reductions) |
|
|
(24.151,42) |
|
|
|
|
Other income and gains |
633.508,29 |
457.915,47 |
214.686,95 |
38,35 |
|
|
|
Other expenses and losses |
1.039.817,48 |
662.084,26 |
794.714,36 |
57,05 |
|
|
|
Result before
depreciation, financing costs and taxes |
|
|
|
|
|
|
|
|
|
|
|
|
|
|
|
Expenses/reversals of
depreciation and amortization |
463.216,57 |
473.037,38 |
445.186,85 |
(2,08) |
|
|
|
Operating result (before
financing costs and taxes) |
|
|
|
|
|
|
|
|
|
|
|
|
|
|
|
Interest and similar income
obtained |
44.664,05 |
192.685,81 |
172.010,69 |
(76,82) |
|
|
|
interest and similar expenses
incurred |
351.702,37 |
414.397,27 |
274.362,69 |
(15,13) |
|
|
|
Net before taxes |
|
|
|
|
|
|
|
|
|
|
|
|
|
|
|
Income tax of the period |
2.428.826,84 |
2.127.449,18 |
2.207.282,14 |
14,17 |
|
|
|
RATIOS SNC |
|
Closing Date |
2013 |
2012 |
2011 |
|
|
|
|
|||||
|
TURNOVER RATIOS |
|
|||||
|
Shareholder's Funds
Profitability |
0,611 |
0,516 |
0,643 |
|
|
|
|
Assets Profitability |
0,256 |
0,231 |
0,281 |
|
|
|
|
Sales Net Profitability |
0,098 |
0,088 |
0,121 |
|
|
|
|
|
|
|||||
|
EFFICIENCY RATIOS |
|
|||||
|
Medium Term Receivable |
75,217 |
64,73 |
69,879 |
|
|
|
|
Asset Rotation |
1,896 |
1,907 |
1,825 |
|
|
|
|
|
|
|||||
|
PRODUCTIVITY RATIOS |
|
|||||
|
Productivity |
4,43 |
4,625 |
4,485 |
|
|
|
|
|
|
|||||
|
SHORT TERM RATIOS |
|
|||||
|
General Liquidity |
1,615 |
1,734 |
1,797 |
|
|
|
|
Reduced Liquidity |
0,877 |
0,984 |
0,937 |
|
|
|
|
Immediate Liquidity |
0,056 |
0,123 |
0,124 |
|
|
|
|
|
|
|||||
|
MEDIUM LONG TERM RATIOS |
|
|||||
|
Financial Autonomy |
0,305 |
0,325 |
0,343 |
|
|
|
|
Solvability |
0,438 |
0,482 |
0,522 |
|
|
|
|
Borrowed Capital Structure |
0,852 |
0,823 |
0,821 |
|
|
|
|
General Debt |
0,631 |
0,46 |
0,481 |
|
|
|
|
Medium Long Term Debt |
0,337 |
0,368 |
0,341 |
|
|
|
|
Debt Structure |
0,852 |
0,823 |
0,821 |
|
|
|
|
Capital Structure |
2,965 |
2,716 |
2,925 |
|
|
|
|
|
|
|||||
|
Operational and Financial
Risk |
|
|||||
|
Operational Leverage Level |
3,271 |
4,018 |
3,178 |
|
|
|
|
Financial Leverage Level |
1,032 |
1,026 |
1,01 |
|
|
|
|
Combined Leverage Level |
3,376 |
4,122 |
3,21 |
|
|
|
|
CASH FLOW STATEMENT |
|
Rubrics |
2013 |
2012 |
PERIODS |
|
CASH FLOWS FROM OPERATIONAL ACTIVITIES |
|
|
|
|
Customers receipts |
78.149.272,52 |
79.814.426,65 |
(2,09)% |
|
Payments to suppliers |
67.101.288,92 |
60.337.652,20 |
11,21% |
|
Payments to employees |
7.065.692,96 |
7.108.153,64 |
(0,60)% |
|
Cash at bank generated from operations |
3.982.290,64 |
12.368.620,81 |
(67,80)% |
|
Payment/receipt of income tax
|
(1.774.782,35) |
(1.856.121,13) |
4,38% |
|
Other receipts/payments |
2.109.292,42 |
102.566,53 |
1.956,51% |
|
Cash Flows from Operational Activities (A) |
4.316.800,71 |
10.615.066,21 |
(59,33)% |
|
CASH FLOWS' INVESTMENT
ACTIVITIES |
|
|
|
|
Payments
regarding: |
|
|
|
|
Fixed tangible assets |
389.287,65 |
707.914,05 |
(45,01)% |
|
Intangible assets |
103.762,80 |
- |
- |
|
Financial investments |
- |
- |
- |
|
Other assets |
6.291.056,63 |
8.189.305,94 |
(23,18)% |
|
Receipts from: |
|
|
|
|
Fixed tangible assets |
1.670,84 |
4.876,02 |
(65,73)% |
|
Intangible assets |
- |
- |
- |
|
Financial investments |
- |
- |
- |
|
Other assets |
7.298.356,07 |
6.520.631,61 |
11,93% |
|
Investment subsidies |
- |
- |
- |
|
Interest and similar income |
176.898,47 |
91.183,83 |
94,00% |
|
Dividends |
- |
- |
- |
|
Cash Flows' Investments Activities (B) |
692.818,30 |
(2.280.528,53) |
130,38% |
|
CASH FLOWS'
INVESTMENT ACTIVITIES |
|
|
|
|
Receipts from: |
|
|
|
|
Obtained financing |
1.000.000,00 |
- |
- |
|
Paying-up of capital and
other equity instruments |
- |
- |
- |
|
Coverage of losses |
- |
- |
- |
|
Donations |
- |
- |
- |
|
Other financing operations |
6.803.547,55 |
1.649.264,14 |
312,52% |
|
Payments regarding: |
|
|
|
|
Obtained financing |
377.717,40 |
711.050,72 |
(46,88)% |
|
Interests and similar
expenses |
348.496,77 |
336.377,88 |
3,60% |
|
Dividends |
7.561.022,04 |
7.198.627,09 |
5,03% |
|
Capital's redution and other
equity instruments |
- |
- |
- |
|
Other financing operations |
5.795.105,94 |
1.694.137,55 |
242,07% |
|
Cash Flows' Financing Activities © |
(6.278.794,60) |
(8.290.929,10) |
24,27% |
|
Variation in cash at bank and
its equivalents (A+B+C) |
(1.269.175,59) |
43.608,58 |
(3.010,38)% |
|
Effect of exchange
differences |
(4.009,32) |
(23.462,28) |
82,91% |
|
Cash at bank and its equivalents at the start of period |
2.565.905,41 |
2.545.759,11 |
0,79% |
|
Cash at bank and its equivalents at the end of period |
1.292.720,50 |
2.565.905,41 |
(49,62)% |
|
CASH FLOWS |
|
|
Movimentos do Periodo de 2013 |
|||
|
Rubrics |
Initial
balance |
Debits |
Credits |
Final
balance |
|
PERIOD'S CARRYING AMOUNT AND MOVEMENTS |
|
|||
|
Cash in hand |
16.892,28 |
93.575,02 |
107.303,49 |
3.163,81 |
|
Order deposits |
1.258.790,15 |
88.054.300,44 |
88.273.533,90 |
1.039.556,69 |
|
Other bank deposits |
1.290.222,98 |
459.777,02 |
1.500.000,00 |
250.000,00 |
|
Total cash at bank and bank
deposits |
2.565.905,41 |
88.607.652,48 |
89.880.837,39 |
1.292.720,50 |
|
Of which: Bank deposits
abroad |
153.049,14 |
400.316,51 |
518.774,11 |
34.591,54 |
|
Rubrics |
Value |
|
OTHER INFORMATION |
|
|
Receipts from: |
|
|
Non-life insurance claims |
- |
|
Operating subsidies |
- |
|
Cash at bank and its
equivalents not available for use |
- |
|
ASSETS IMPAIRMENT |
|
|
Movimentos do Periodo de 2013 |
|||||
|
|
Impairment losses |
Impairment losses reversals |
||||
|
Rubrics |
Recognized
in profit and loss |
Recognized
in Equity |
Total |
Recognized
in profit and loss |
On
revalued assets recognized in equity |
Total |
|
|
|
|
|
|
|
|
|
Individual assets |
|
|||||
|
Fixed tangible assets |
0,00 |
- |
- |
0,00 |
- |
- |
|
Goodwill |
0,00 |
0,00 |
- |
- |
0,00 |
0,00 |
|
Intangible assets |
0,00 |
- |
- |
0,00 |
- |
- |
|
Investment properties (cost
model) |
0,00 |
0,00 |
- |
0,00 |
0,00 |
- |
|
Investments in progress |
0,00 |
0,00 |
- |
0,00 |
0,00 |
- |
|
Financial investments |
0,00 |
0,00 |
- |
0,00 |
0,00 |
- |
|
TOTAL |
|
|
|
|
|
|
|
of which: cash-generating
units |
0,00 |
0,00 |
- |
0,00 |
0,00 |
- |
|
GOVERNMENT GRANTS AND
GOVERNMENT ASSISTANCE |
|
|
Grants from State and other public bodies |
Grants from other entities |
||
|
Rubrics |
Value
assigned in the period or in previous periods |
Value
attributed to the period |
Value
assigned in the period or in previous periods |
Value
attributed to the period |
|
|
|
|
|
|
|
Grants related to
assets/investment: |
0,00 |
0,00 |
0,00 |
0,00 |
|
Fixed tangible assets |
0,00 |
0,00 |
0,00 |
0,00 |
|
Land and Natural Resources |
- |
- |
- |
- |
|
Buildings and other
structures |
- |
- |
- |
- |
|
Basic equipment |
- |
- |
- |
- |
|
Transport equipment |
- |
- |
- |
- |
|
Office equipment |
- |
- |
- |
- |
|
Biological equipment |
- |
- |
- |
- |
|
Others |
- |
- |
- |
- |
|
Intangible assets |
0,00 |
0,00 |
0,00 |
0,00 |
|
Development projects |
- |
- |
- |
- |
|
Computer programmes |
- |
- |
- |
- |
|
Industrial property |
- |
- |
- |
- |
|
Others |
- |
- |
- |
- |
|
Other assets |
- |
- |
- |
- |
|
Grants related to income /
operating |
- |
4.129,84 |
- |
- |
|
Value of repayments in the
period: |
0,00 |
0,00 |
0,00 |
0,00 |
|
Grants related to
assets/investment |
- |
- |
- |
- |
|
Grants related to income /
operating |
- |
- |
- |
- |
|
TOTAL |
0,00 |
4.129,84 |
0,00 |
0,00 |
|
IMPAIRMENT LOSSES IN FINANCIAL ASSETS AT COST OR AT AMORTIZED COST |
|
|
Movimentos do Periodo de 2013 |
||
|
Rubrics |
Impairment
losses |
Impairment
losses reversals |
Total |
|
Receivable debts from
customers |
414.025,37 |
30.377,62 |
383.647,75 |
|
Other receivables |
- |
- |
0,00 |
|
Equity instruments and other securities |
- |
- |
0,00 |
|
Others |
- |
- |
0,00 |
|
TOTAL |
414.025,37 |
30.377,62 |
383.647,75 |
|
DEBTS REGISTERED AS DOUBTFUL |
|
Rubrics |
Value |
|
Regarding insolvency and
company recovery procedures or enforcement procedures |
- |
|
Claimed in court |
- |
|
In arrears: |
0,00 |
|
Over six months and up to
twelve months |
- |
|
Over twelve months and up to
eighteen months |
- |
|
Over eighteen months and up
to twenty four months |
- |
|
Over twenty four months |
- |
|
TOTAL |
0,00 |
|
EMPLOYEE BENEFITS, COMPANY
EMPLOYEES AND PERSONNEL COSTS |
|
|
|
Rubrics |
Average
number of employees |
Average
number of hours worked |
|
Company employees, paid and
unpaid |
307 |
605.241 |
|
Paid company employees |
307 |
605.241 |
|
Company UNPAID employees |
0 |
0 |
|
Company
employees, by type of working hours |
|
|
|
Full time company employees |
305 |
604.678 |
|
Of which: Full time company
employees |
305 |
604.678 |
|
Part time company employees |
2 |
563 |
|
Of which: Part time company
employees |
2 |
563 |
|
Company
employees, by gender: |
|
|
|
Men |
187 |
366.212 |
|
Women |
120 |
239.029 |
|
Company
employees, of which: |
|
|
|
Company employees assigned to
Research and Development |
- |
- |
|
Service providers |
1 |
693 |
|
People placed through
temporary employment agencies |
8 |
- |
|
Staff costs |
|
|
|
Rubrics |
Value |
|
Staff costs |
7.384.656,24 |
|
Governance Bodies
Remuneration |
159.425,16 |
|
Of which: Profit-sharing |
- |
|
Employees remuneration |
5.633.437,25 |
|
Of which: Profit-sharing |
236.100,28 |
|
Post-employment benefits |
0,00 |
|
Pension premiums |
- |
|
Other benefits |
- |
|
Of which: |
|
|
For defined contribution
plans - corporate bodies |
- |
|
For defined contribution
plans - others |
- |
|
Compensations |
118.284,66 |
|
Charges on remunerations |
1.217.265,00 |
|
Insurance for accidents at
work and professional diseases |
25.421,14 |
|
Social security expenses |
21.405,45 |
|
Other staff costs |
209.417,58 |
|
Of which: |
|
|
Expenditure on education |
27.887,73 |
|
Expenditure on uniforms |
6.208,83 |
|
INFORMATION BY GEOGRAPHIC
MARKETS |
|
|
Geographic markets |
|||
|
Rubrics |
Internal |
EU |
Extra-EU |
Total |
|
Sales |
28.421.447,36 |
31.774.330,33 |
10.785.697,47 |
70.981.475,16 |
|
Services provided |
3.008.644,96 |
1.927,27 |
4.226,08 |
3.014.798,31 |
|
Purchases |
26.348.934,78 |
6.680.784,93 |
8.472.261,67 |
41.501.981,38 |
|
Supplies and external
services |
11.427.780,71 |
3.866.388,53 |
443.983,94 |
15.738.153,18 |
|
Acquisition of fixed tangible
assets |
703.387,04 |
- |
- |
703.387,04 |
|
Acquisition of investment
properties |
0,00 |
- |
- |
0,00 |
|
Acquisition of intangible
assets |
78.100,00 |
- |
- |
78.100,00 |
|
Supplementary income: |
23.252,10 |
22.352,45 |
5.620,00 |
51.224,55 |
|
Social services |
- |
- |
- |
0,00 |
|
Equipment rental |
- |
- |
- |
0,00 |
|
Studies, projects and
technological assistance |
- |
- |
- |
0,00 |
|
Royalities |
- |
- |
5.620,00 |
5.620,00 |
|
Others |
23.252,10 |
22.352,45 |
- |
45.604,55 |
|
Memorandum: Sales and
services provided (undiscounted values) |
- |
- |
- |
0,00 |
|
Memorandum: Purchases and
supplies and external services (undiscounted values) |
- |
- |
- |
0,00 |
|
RECEIVABLE AND PAYABLE
ACCOUNTS |
|
Rubrics |
2013 |
2012 |
PERIODS |
|
Customers |
|
|
|
|
Trade accounts receivable |
16.807.439,97 |
13.956.150,71 |
20,43% |
|
Trade notes receivable |
- |
0,00 |
- |
|
Advances received from customers |
14.920,32 |
1.321,26 |
1.029,25% |
|
Suppliers |
|
|
|
|
Trade accounts payable |
13.712.524,43 |
14.464.426,07 |
(5,20)% |
|
Trade notes payable |
- |
0,00 |
- |
|
Trade accounts payable -
unchecked invoices |
340.216,37 |
0,00 |
- |
|
Advances to suppliers |
37.250,29 |
13.521,08 |
175,50% |
|
Staff |
|
|
|
|
Payable remunerations |
1.224,21 |
5.225,08 |
(76,57)% |
|
Advanced payments |
- |
- |
- |
|
Bonds |
- |
- |
- |
|
Other operations |
3.219,38 |
8.791,71 |
(63,38)% |
|
State and other
public sector institutions |
|
|
|
|
Income Tax |
(2.375.103,39) |
2.119.410,96 |
(212,06)% |
|
Deductible IVA (debt
cumulative amounts) |
691,54 |
- |
- |
|
Paid IVA (credit cumulative
amounts) |
691,54 |
- |
- |
|
Shareholders /
partners |
|
|
|
|
Shareholders with
subscription |
- |
- |
- |
|
Unreleased quotas |
- |
- |
- |
|
Advances for profits |
- |
- |
- |
|
Allocated
results |
|
|
|
|
From the perspective of the
entity distributing profits |
- |
- |
- |
|
From the perspective of the entity
with allocated profits |
- |
- |
- |
|
Available
profits |
|
|
|
|
From the perspective of the
entity distributing profits |
- |
- |
- |
|
From the perspective of the
entity with allocated profits |
- |
- |
- |
|
Granted loans - parent
company |
2.990.643,86 |
4.006.315,37 |
(25,35)% |
|
Granted loans - subsidiary
companies, associated companies and joint ventures |
- |
- |
- |
|
Granted loans - other
shareholders/partners |
- |
- |
- |
|
Of which: Participating
companies |
- |
- |
- |
|
Other operations |
|
|
|
|
Debit status |
- |
- |
- |
|
Credit status |
- |
- |
- |
|
Other
receivable and payable accounts |
|
|
|
|
Investment providers -
general accounts |
215.333,76 |
144.200,81 |
49,33% |
|
Trade accounts payable -
unchecked invoices |
- |
- |
- |
|
Advanced payments to
investment providers |
- |
- |
- |
|
additional income - Debtors |
139.587,74 |
30.363,76 |
359,72% |
|
additional expenses -
Creditors |
2.310.999,65 |
1.995.396,95 |
15,82% |
|
Deferred tax assets |
44.257,99 |
93.544,64 |
(52,69)% |
|
Deferred tax liabilities |
6.497,51 |
8.025,71 |
(19,04)% |
|
Unreleased subscriptions -
Creditors |
- |
- |
- |
|
Advances received on account
of sales |
- |
- |
- |
|
Other debtors
and creditors |
|
|
|
|
Other debtors |
11.376,37 |
404.637,92 |
(97,19)% |
|
Other creditors |
62.957,27 |
52.025,22 |
21,01% |
|
EXPENSE ACCOUNTS |
|
Rubrics |
2013 |
2012 |
PERIODS |
|
Supplies and external
services |
15.738.153,18 |
16.258.565,51 |
(3,20)% |
|
Subcontracts |
1.769.908,97 |
1.759.100,69 |
0,61% |
|
Specialized services |
8.576.889,46 |
9.152.800,89 |
(6,29)% |
|
Specialized works |
3.546.512,56 |
3.569.964,13 |
(0,66)% |
|
Of which: Payments to workers
placed through agencies |
- |
- |
- |
|
Advertising and promotion |
1.872.124,54 |
2.586.565,99 |
(27,62)% |
|
Surveillance and security |
- |
243,05 |
- |
|
Fees |
4.995,60 |
320,20 |
1.460,15% |
|
Comissions |
2.940.283,99 |
2.769.761,97 |
6,16% |
|
Maintenance and repairs |
212.972,77 |
225.945,55 |
(5,74)% |
|
Others |
- |
- |
- |
|
Materials |
155.073,06 |
248.476,91 |
(37,59)% |
|
Fast wear tools and utensils |
123.050,18 |
216.972,71 |
(43,29)% |
|
Books and technical
documentation |
5.962,92 |
11.101,24 |
(46,29)% |
|
Office material |
17.641,92 |
19.363,59 |
(8,89)% |
|
Gift items |
7.973,02 |
577,14 |
1.281,47% |
|
Others |
445,02 |
462,23 |
(3,72)% |
|
Energy and fluids |
509.083,93 |
115.378,61 |
341,23% |
|
Electricity |
25.053,16 |
1.238,50 |
1.922,86% |
|
Fuels |
103.840,98 |
111.921,78 |
(7,22)% |
|
Water |
77,75 |
59,80 |
30,02% |
|
Others |
380.112,04 |
2.158,53 |
17.509,76% |
|
Travel, lodging and
transportation |
2.085.728,66 |
2.032.365,93 |
2,63% |
|
Travel and lodging |
306.246,03 |
383.322,89 |
(20,11)% |
|
Transport of personnel |
- |
- |
- |
|
Transport of goods |
1.739.144,89 |
1.612.027,20 |
7,89% |
|
Others |
40.337,74 |
37.015,84 |
8,97% |
|
Different services |
2.641.469,10 |
2.950.442,48 |
(10,47)% |
|
Rents and leases |
2.376.061,26 |
2.565.896,96 |
(7,40)% |
|
Of which: Rents from land |
- |
1.000,00 |
- |
|
Communication |
63.741,98 |
64.970,85 |
(1,89)% |
|
Insurance |
157.911,07 |
183.974,82 |
(14,17)% |
|
Royalties |
- |
- |
- |
|
Litigation and Notaries |
3.469,49 |
15.892,64 |
(78,17)% |
|
Representation expenses |
19.893,55 |
47.149,48 |
(57,81)% |
|
Cleaning, hygiene and comfort |
17.624,79 |
72.365,53 |
(75,64)% |
|
Other services |
2.766,96 |
192,20 |
1.339,63% |
|
Deliberation of Approval of
Accounts |
|
Were the financial year's accounts approved? |
|
|
YES |
|
|
Data da Aprovação: 31-03-2014 |
|
|
By
(Unanimity/Majority): |
|
|
Unanimity |
|
|
Percentage of
issued votes related to the share capital subscribed with voting right |
|
|
100 |
|
|
The accounts
were approved: |
|
|
In universal meeting |
|
|
Through deliberation by
writing vote |
|
|
The accounts
were approved: |
|
|
In POC/SNC/NCM (National Plan
of Accounts/Accounting Normalization System/Accounting Normalization for
micro entities) |
|
|
PROFIT APLICATION ACCORDING TO THE DELIBERATION THAT APPROVED THE
FINANCIAL YEAR'S ACCOUNTS |
|
Rubrics |
2013 |
2012 |
|
Retained earnings |
8.039.527,08 |
8.334.195,49 |
|
Allocated results / Available
profits |
- |
- |
|
Percentages or bonuses to managing
bodies |
- |
- |
|
Ditto to staff |
- |
- |
|
Reserves |
- |
- |
|
Coverage of losses |
- |
- |
|
7. Others |
- |
- |
|
BALANCE (1-2-3-4-5-6-7) |
8.039.527,08 |
8.334.195,49 |
|
Management Report / Assessment of the Inspection Body / Legal Certification
of Accounts |
|
MANAGEMENT REPORT |
|
|
Were the Management Report and financial year's accounts prepared? |
|
|
YES |
|
|
Were the
management report and the financial year's accounts signed by all members of
the management / administration? |
|
|
YES |
|
|
ASSESSMENT OF THE INSPECTION BODY |
|
|
The entity has
an inspection body? |
|
|
YES |
|
|
Has the
inspection body issued an assessment? |
|
|
YES |
|
|
The inspection
body pronounced: |
|
|
In favour of the approval of
accounts |
|
|
LEGAL CERTIFICATION OF ACCOUNTS (CLC) |
|
|
Is the entity
required to have certified accounts by a Statutory Auditor/Statutory Audit
Firm? |
|
|
YES |
|
|
Identificação do ROC:
151188386 |
|
|
Was the Legal
certification of accounts issued? |
|
|
YES |
|
|
Without reservation and
without emphasis |
|
FOREIGN EXCHANGE RATES
|
Currency |
Unit
|
Indian Rupees |
|
US Dollar |
1 |
Rs.61.75 |
|
|
1 |
Rs.100.06 |
|
Euro |
1 |
Rs.77.95 |
INFORMATION DETAILS
|
Analysis Done by
: |
RAS |
|
|
|
|
Report Prepared
by : |
SDA |
RATING EXPLANATIONS
|
RATING |
STATUS |
PROPOSED CREDIT LINE |
|
|
|
>86 |
Aaa |
Possesses an extremely sound financial base with the strongest capability
for timely payment of interest and principal sums |
Unlimited |
|
|
71-85 |
Aa |
Possesses adequate working capital. No caution needed for credit
transaction. It has above average (strong) capability for payment of interest
and principal sums |
Large |
|
|
56-70 |
A |
Financial & operational base are regarded healthy. General
unfavourable factors will not cause fatal effect. Satisfactory capability for
payment of interest and principal sums |
Fairly Large |
|
|
41-55 |
Ba |
Overall operation
is considered normal. Capable to meet normal commitments. |
Satisfactory |
|
|
26-40 |
B |
Capability to overcome financial difficulties seems comparatively
below average. |
Small |
|
|
11-25 |
Ca |
Adverse factors are apparent. Repayment of interest and principal sums
in default or expected to be in default upon maturity |
Limited with
full security |
|
|
<10 |
C |
Absolute credit risk exists. Caution needed to be exercised |
Credit not
recommended |
|
|
-- |
NB |
New Business |
-- |
|
This score serves as a reference to assess SC’s credit risk
and to set the amount of credit to be extended. It is calculated from a composite
of weighted scores obtained from each of the major sections of this report. The
assessed factors and their relative weights (as indicated through %) are as
follows:
Financial
condition (40%) Ownership
background (20%) Payment
record (10%)
Credit history
(10%) Market trend
(10%) Operational
size (10%)
This report is issued at your request without any
risk and responsibility on the part of MIRA INFORM PRIVATE LIMITED (MIPL)
or its officials.