MIRA
INFORM REPORT
|
Report Date : |
04.10.2014 |
IDENTIFICATION DETAILS
|
Name : |
KENYA JEWELLERS LIMITED |
|
|
|
|
Registered Office : |
|
|
|
|
|
Country : |
|
|
|
|
|
Financials (as on) : |
31.03.2013 |
|
|
|
|
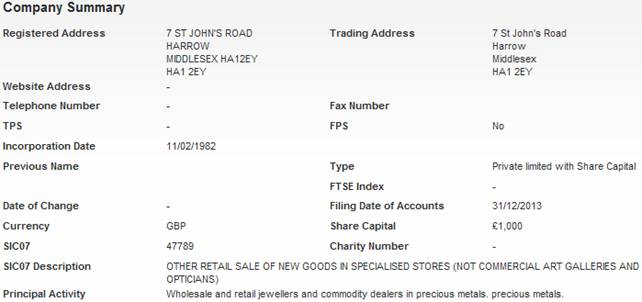
Date of Incorporation : |
11.02.1982 |
|
|
|
|
Legal Form : |
Private Limited with Share Capital |
|
|
|
|
Line of Business : |
Wholesale and Retail Jewellers and Commodity dealers in precious
metals. |
|
|
|
|
No. of Employees : |
Not Available |
RATING & COMMENTS
|
MIRA’s Rating : |
Ba |
|
RATING |
STATUS |
PROPOSED CREDIT LINE |
|
|
41-55 |
Ba |
Overall operation is considered normal. Capable to meet normal
commitments. |
Satisfactory |
|
Status : |
Satisfactory |
|
Payment Behaviour : |
No complaints |
|
Litigation : |
Clear |
NOTES :
Any query related to this report can be made
on e-mail : infodept@mirainform.com
while quoting report number, name and date.
ECGC Country Risk Classification List – June 1, 2014
|
Country Name |
Previous Rating (31.03.2014) |
Current Rating (01.06.2014) |
|
|
A1 |
A1 |
|
Risk Category |
ECGC
Classification |
|
Insignificant |
A1 |
|
Low |
A2 |
|
Moderate |
B1 |
|
High |
B2 |
|
Very High |
C1 |
|
Restricted |
C2 |
|
Off-credit |
D |
The
|
Source
: CIA |
REGISTERED NAME & COMPANY
SUMMARY
KENYA JEWELLERS LIMITED
DIRECTORS/MANAGEMENT
Current Directors
|
Name |
Date of Birth |
29/01/1961 |
|
|
Officers Title |
|
Nationality |
British |
|
Present Appointments |
3 |
Function |
Director |
|
Appointment Date |
19/02/1993 |
|
|
|
Address |
|
||
|
Other Actions |
|||
|
|
|
||
|
Name |
Date of Birth |
20/11/1953 |
|
|
Officers Title |
|
Nationality |
British |
|
Present Appointments |
3 |
Function |
Director |
|
Appointment Date |
31/12/1992 |
|
|
|
Address |
|
||
|
Other Actions |
|||
|
|
|
||
Current Company Secretary
|
Name |
Date of Birth |
29/01/1961 |
|
|
Officers Title |
|
Nationality |
British |
|
Present Appointments |
3 |
Function |
Company Secretary |
|
Appointment Date |
31/12/1992 |
|
|
|
Address |
|
||
Previous Director/Company Secretaries
|
Name |
Current Directorships |
Previous Directorships |
|
0 |
2 |
NEGATIVE INFORMATION
Mortgage Summary
Total Mortgage 2
Outstanding 2
Satisfied 0
Trade Debtors / Bad Debt Summary
Total Number of Documented Trade 0
Total Value of Documented Trade £0
CCJ
|
Total Number of Exact CCJs - |
Total Value of Exact CCJs - |
|
|
Total Number of Possible CCJs - |
Total Value of Possible CCJs - |
|
|
Total Number of Satisfied CCJs - |
Total Value of Satisfied CCJs - |
|
|
Total Number of Writs - |
- |
|
Mortgage Details
|
Mortgage Type: |
LETTER OF CHARGE |
||
|
Date Charge Created: |
08/04/92 |
|
|
|
Date Charge Registered: |
24/04/92 |
|
|
|
Date Charge Satisfied: |
- |
|
|
|
Status: |
OUTSTANDING |
|
|
|
Person(s) Entitled: |
BARCLAYS BANK PLC |
||
|
Amount Secured: |
ALL MONIES DUE OR TO BECOME DUE FROM THE COMPANY TO THE CHARGEE ON ANY
ACCOUNT WHATSOEVER |
||
|
Details: |
ALL MONEYS NOW OR AT ANYTIME HEREAFTERSTANDING TO THE CREDIT OF ANY
ACCOUNTS\S OF THE COMPANY WITH THE BANK DESIGNATED BARCLAYS BANK PLC RE KENYA
JEWLLERS LIMITED BUSINESS PREMIUM ACCOUNT |
||
|
Mortgage Type: |
DEBENTURE |
||
|
Date Charge Created: |
14/04/89 |
|
|
|
Date Charge Registered: |
24/04/89 |
|
|
|
Date Charge Satisfied: |
- |
|
|
|
Status: |
OUTSTANDING |
|
|
|
Person(s) Entitled: |
BARCLAYS BANK PLC |
||
|
Amount Secured: |
ALL MONIES DUE OR TO BECOME DUE FROM THE COMPANY TO THE CHARGEE ON ANY
ACCOUNT WHATSOEVER |
||
|
Details: |
FIXED AND FLOATING CHARGES OVER THE UNDERTAKING AND ALL PROPERTY AND
ASSETS PRESENT AND FUTURE INCLUDING GOODWILL BOOKDEBTS UNCALLED CAPITAL BUILDINGS
FIXTURESFIXED PLANT AND MACHINERY |
||
SHARE & SHARE CAPITAL
INFORMATION
Top 20 Shareholders
|
Name |
Currency |
Share Count |
Share Type |
Nominal Value |
% of Total Share Count |
|
MR AJIT KUMAR MULJI |
GBP |
509 |
ORDINARY |
1 |
50.9 |
|
MR KAMLESH GOVINDJI MULJI |
GBP |
490 |
ORDINARY |
1 |
49 |
|
MR A.G. MULJI & MRS P.A. MULJI |
GBP |
1 |
ORDINARY |
1 |
0.1 |
PAYMENT INFORMATION
|
Average Invoice Value |
£63.33 |
|
Invoices available |
6 |
|
Paid |
4 |
|
Outstanding |
2 |
|
Trade Payment Data is information that we collect from selected third
party partners who send us information about their whole sales ledger. |
|
|
Within Terms |
0-30 Days |
31-60 Days |
61-90 Days |
91+ Days |
|
Paid |
3 |
1 |
0 |
0 |
0 |
|
Outstanding |
2 |
0 |
0 |
0 |
0 |
GROUP STRUCTURE & AFFILIATED
COMPANIES
Group structure
No group structure
FINANCIAL INFORMATION
Profit & Loss
|
Date Of Accounts |
31/03/13 |
(%) |
31/03/12 |
(%) |
31/03/11 |
(%) |
31/03/10 |
(%) |
31/03/09 |
|
Weeks |
52 |
(%) |
52 |
(%) |
52 |
(%) |
52 |
(%) |
52 |
|
Currency |
GBP |
(%) |
GBP |
(%) |
GBP |
(%) |
GBP |
(%) |
GBP |
|
Consolidated A/cs |
N |
(%) |
N |
(%) |
N |
(%) |
N |
(%) |
N |
|
Turnover |
- |
- |
- |
- |
- |
- |
- |
- |
- |
|
Export |
- |
- |
- |
- |
- |
- |
- |
- |
- |
|
Cost of Sales |
- |
- |
- |
- |
- |
- |
- |
- |
- |
|
Gross Profit |
- |
- |
- |
- |
- |
- |
- |
- |
- |
|
Wages & Salaries |
- |
- |
- |
- |
- |
- |
- |
- |
- |
|
Directors Emoluments |
- |
- |
- |
- |
- |
- |
- |
- |
- |
|
Operating Profit |
- |
- |
- |
- |
- |
- |
- |
- |
- |
|
Depreciation |
£32,485 |
46.7% |
£22,138 |
833.3% |
£2,372 |
-25% |
£3,163 |
80.7% |
£1,750 |
|
Audit Fees |
- |
- |
- |
- |
- |
- |
- |
- |
- |
|
Interest Payments |
- |
- |
- |
- |
- |
- |
- |
- |
- |
|
Pre Tax Profit |
- |
- |
- |
- |
- |
- |
- |
- |
- |
|
Taxation |
- |
- |
- |
- |
- |
- |
- |
- |
- |
|
Profit After Tax |
- |
- |
- |
- |
- |
- |
- |
- |
- |
|
Dividends Payable |
- |
- |
- |
- |
- |
- |
- |
- |
- |
|
Retained Profit |
- |
- |
- |
- |
- |
- |
- |
- |
- |
Balance Sheet
|
Date Of Accounts |
31/03/13 |
(%) |
31/03/12 |
(%) |
31/03/11 |
(%) |
31/03/10 |
(%) |
31/03/09 |
|
Tangible Assets |
£525,431 |
8.5% |
£484,403 |
17.5% |
£412,263 |
-0.6% |
£414,635 |
999.9% |
£16,356 |
|
Intangible Assets |
0 |
- |
0 |
- |
0 |
- |
0 |
- |
0 |
|
Total Fixed Assets |
£525,431 |
8.5% |
£484,403 |
17.5% |
£412,263 |
-0.6% |
£414,635 |
999.9% |
£16,356 |
|
Stock |
£638,327 |
-4.7% |
£669,464 |
-1.5% |
£679,609 |
3.2% |
£658,267 |
-20.7% |
£830,095 |
|
Trade Debtors |
£33,594 |
-31% |
£48,697 |
9.7% |
£44,402 |
-40.2% |
£74,202 |
205.7% |
£24,272 |
|
Cash |
£122,185 |
689.1% |
£15,484 |
-45.5% |
£28,427 |
634.4% |
£3,871 |
-95.2% |
£80,122 |
|
Other Debtors |
0 |
- |
0 |
- |
0 |
- |
0 |
- |
0 |
|
Miscellaneous Current Assets |
£360 |
- |
£360 |
- |
£360 |
- |
0 |
- |
0 |
|
Total Current Assets |
£794,466 |
8.2% |
£734,005 |
-2.5% |
£752,798 |
2.2% |
£736,340 |
-21.2% |
£934,489 |
|
Trade Creditors |
£289,169 |
10.5% |
£261,717 |
8.8% |
£240,588 |
-1.4% |
£243,980 |
79.4% |
£136,033 |
|
Bank Loans & Overdrafts |
0 |
- |
0 |
- |
0 |
- |
0 |
- |
0 |
|
Other Short Term Finance |
0 |
- |
0 |
- |
0 |
- |
0 |
- |
0 |
|
Miscellaneous Current Liabilities |
0 |
- |
0 |
- |
0 |
- |
0 |
- |
0 |
|
Total Current Liabilities |
£289,169 |
10.5% |
£261,717 |
8.8% |
£240,588 |
-1.4% |
£243,980 |
79.4% |
£136,033 |
|
Bank Loans & Overdrafts and LTL |
£451,792 |
0% |
£451,801 |
3.3% |
£437,378 |
0% |
£437,210 |
0.2% |
£436,163 |
|
Other Long Term Finance |
0 |
- |
0 |
- |
0 |
- |
0 |
- |
0 |
|
Total Long Term Liabilities |
£451,792 |
0% |
£451,801 |
3.3% |
£437,378 |
0% |
£437,210 |
0.2% |
£436,163 |
Capital & Reserves
|
Date Of Accounts |
31/03/13 |
(%) |
31/03/12 |
(%) |
31/03/11 |
(%) |
31/03/10 |
(%) |
31/03/09 |
|
Called Up Share Capital |
£1,000 |
- |
£1,000 |
- |
£1,000 |
- |
£1,000 |
- |
£1,000 |
|
P & L Account Reserve |
£278,446 |
36.2% |
£204,400 |
9.5% |
£186,605 |
10.2% |
£169,295 |
116.6% |
£78,159 |
|
Revaluation Reserve |
- |
- |
- |
- |
- |
- |
- |
- |
- |
|
Sundry Reserves |
£299,490 |
- |
£299,490 |
- |
£299,490 |
- |
£299,490 |
- |
£299,490 |
|
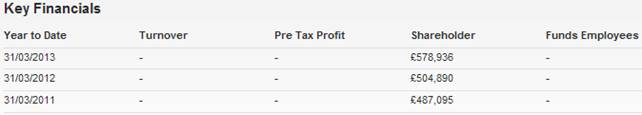
Shareholder Funds |
£578,936 |
14.7% |
£504,890 |
3.7% |
£487,095 |
3.7% |
£469,785 |
24.1% |
£378,649 |
Other Financial Items
|
Date Of Accounts |
31/03/13 |
(%) |
31/03/12 |
(%) |
31/03/11 |
(%) |
31/03/10 |
(%) |
31/03/09 |
|
Net Worth |
£578,936 |
14.7% |
£504,890 |
3.7% |
£487,095 |
3.7% |
£469,785 |
24.1% |
£378,649 |
|
Working Capital |
£505,297 |
7% |
£472,288 |
-7.8% |
£512,210 |
4% |
£492,360 |
-38.3% |
£798,456 |
|
Total Assets |
£1,319,897 |
8.3% |
£1,218,408 |
4.6% |
£1,165,061 |
1.2% |
£1,150,975 |
21% |
£950,845 |
|
Total Liabilities |
£740,961 |
3.8% |
£713,518 |
5.2% |
£677,966 |
-0.5% |
£681,190 |
19% |
£572,196 |
|
Net Assets |
£578,936 |
14.7% |
£504,890 |
3.7% |
£487,095 |
3.7% |
£469,785 |
24.1% |
£378,649 |
Cash Flow
|
Date Of Accounts |
31/03/13 |
(%) |
31/03/12 |
(%) |
31/03/11 |
(%) |
31/03/10 |
(%) |
31/03/09 |
|
Net Cashflow from Operations |
- |
- |
- |
- |
- |
- |
- |
- |
- |
|
Net Cashflow before Financing |
- |
- |
- |
- |
- |
- |
- |
- |
- |
|
Net Cashflow from Financing |
- |
- |
- |
- |
- |
- |
- |
- |
- |
|
Increase in Cash |
- |
- |
- |
- |
- |
- |
- |
- |
- |
Miscellaneous
|
Date Of Accounts |
31/03/13 |
(%) |
31/03/12 |
(%) |
31/03/11 |
(%) |
31/03/10 |
(%) |
31/03/09 |
|
Contingent Liability |
NO |
- |
NO |
- |
NO |
- |
NO |
- |
NO |
|
Capital Employed |
£1,030,728 |
7.7% |
£956,691 |
3.5% |
£924,473 |
1.9% |
£906,995 |
11.3% |
£814,812 |
|
Number of Employees |
- |
- |
- |
- |
- |
- |
- |
- |
- |
|
Auditors |
|
||||||||
|
Auditor Comments |
The company is exempt from audit |
||||||||
|
Bankers |
BARCLAYS BANK PLC |
||||||||
|
Bank Branch Code |
|
||||||||
Ratios
|
Date Of Accounts |
31/03/13 |
31/03/12 |
31/03/11 |
31/03/10 |
31/03/09 |
|
Pre-tax profit margin % |
- |
- |
- |
- |
- |
|
Current ratio |
2.75 |
2.80 |
3.13 |
3.02 |
6.87 |
|
Sales/Net Working Capital |
- |
- |
- |
- |
- |
|
Gearing % |
78 |
89.50 |
89.80 |
93.10 |
115.20 |
|
Equity in % |
43.90 |
41.40 |
41.80 |
40.80 |
39.80 |
|
Creditor Days |
- |
- |
- |
- |
- |
|
Debtor Days |
- |
- |
- |
- |
- |
|
Liquidity/Acid Test |
0.53 |
0.24 |
0.30 |
0.31 |
0.76 |
|
Return On Capital Employed % |
- |
- |
- |
- |
- |
|
Return On Total Assets Employed % |
- |
- |
- |
- |
- |
|
Current Debt Ratio |
0.49 |
0.51 |
0.49 |
0.51 |
0.35 |
|
Total Debt Ratio |
1.27 |
1.41 |
1.39 |
1.45 |
1.51 |
|
Stock Turnover Ratio % |
- |
- |
- |
- |
- |
|
Return on Net Assets Employed % |
- |
- |
- |
- |
- |
FOREIGN EXCHANGE RATES
N/a
ADDITIONAL INFORMATION
Status History
|
No Status History found. |
Event History
|
Date |
Description |
|
22/03/2014 |
Annual Returns |
|
06/01/2014 |
New Accounts Filed |
|
08/02/2013 |
Annual Returns |
|
15/01/2013 |
New Accounts Filed |
|
15/01/2013 |
New Accounts Filed |
|
18/07/2012 |
Change in Reg.Office |
|
18/07/2012 |
Change of Company Postcode |
|
17/02/2012 |
Annual Returns |
|
09/01/2012 |
New Accounts Filed |
|
26/03/2011 |
Annual Returns |
|
23/03/2011 |
Change in Reg.Office |
|
23/03/2011 |
Change of Company Postcode |
|
10/01/2011 |
New Accounts Filed |
|
08/02/2010 |
New Accounts Filed |
|
08/02/2010 |
New Accounts Filed |
Previous Company Names
|
No Previous Names found. |
NOTES & COMMENTS
Commentary
|
No exact match CCJs are recorded against the company. |
|
The company's credit rating has increased from 67 to 80 which
indicates very good creditworthiness. |
|
The credit limit on this company has risen 100% in comparison to the
previously suggested credit limit. |
|
Net Worth increased by 14.7% during the latest trading period. |
|
A 8.3% growth in Total Assets occurred during the latest trading
period. |
|
There is insufficient data to indicate a change in this company's
percentage of sales. |
|
There is insufficient data to indicate a change in this company's
pre-tax profit. |
|
The company saw an increase in their Cash Balance of 689.1% during the
latest trading period. |
|
The company is exempt from audit. |
|
No recent changes in directorship are recorded. |
|
The company is not part of a group. |
|
The movement in accumulated earnings would indicate that the company made
a profit after tax and other appropriations, including dividends. |
|
The company has changed its registered address recently. |
|
The company was established over 31 years ago. |
DIAMOND INDUSTRY –
-
From time immemorial,
-
The achievement of the Indian diamond industry was possible only due to
combination of the manufacturing skills of the Indian workforce and the
untiring and unflagging efforts of the Indian diamantaires, supported by
progressive Government policies.
-
The area of study of family owned diamond businesses derives its
importance from the huge conglomerate of family run organizations which operate
in the diamond industry since many generations.
-
Some of the basic traits of family run business enterprises include
spirit of entrepreneurship, mutual trust lowers transaction costs, small,
nimble and quick to react, information as a source of advantage and
philanthropy.
-
Family owned diamond businesses need to improve on many fronts including
higher standard of corporate governance, long-term performance – focused
strategies, modern management and technology.
-
Utmost caution is to be exercised while dealing with some medium and
large diamond traders which are usually engaged in fictitious import – export,
inter-company transactions, financially assisted by banks. In the process,
several public sector banks lost several hundred million rupees. They mostly
diverted borrowed money for diamond business into real estate and capital
markets.
-
Excerpts from Times of India dated 30th October 2010 is as
under –
-
Gem & Jewellery Export Promotion Council in its statistical data has
shown the export of polished diamonds to have increase by 28 % in February
2013. Compared to $ 1.4 bn worth of polished diamond export in February, 2012,
-
The banking sector has started exercising restraint while following
prudent risk management norms when lending money to gems and jewellery sector.
This follows the implementation of Basel III accord – a global voluntary
regulatory standard on bank capital adequacy, stress testing and market
liquidity.
FOREIGN EXCHANGE RATES
|
Currency |
Unit
|
Indian Rupees |
|
US Dollar |
1 |
Rs.61.75 |
|
|
1 |
Rs.100.07 |
|
Euro |
1 |
Rs.77.95 |
INFORMATION DETAILS
|
Analysis Done by
: |
SUM |
|
|
|
|
Report Prepared
by : |
SHG |
RATING EXPLANATIONS
|
RATING |
STATUS |
PROPOSED CREDIT LINE |
|
|
|
>86 |
Aaa |
Possesses an extremely sound financial base with the strongest
capability for timely payment of interest and principal sums |
Unlimited |
|
|
71-85 |
Aa |
Possesses adequate working capital. No caution needed for credit
transaction. It has above average (strong) capability for payment of interest
and principal sums |
Large |
|
|
56-70 |
A |
Financial & operational base are regarded healthy. General
unfavourable factors will not cause fatal effect. Satisfactory capability for
payment of interest and principal sums |
Fairly Large |
|
|
41-55 |
Ba |
Overall operation is considered normal. Capable to meet normal
commitments. |
Satisfactory |
|
|
26-40 |
B |
Capability to overcome financial difficulties seems comparatively
below average. |
Small |
|
|
11-25 |
Ca |
Adverse factors are apparent. Repayment of interest and principal sums
in default or expected to be in default upon maturity |
Limited with
full security |
|
|
<10 |
C |
Absolute credit risk exists. Caution needed to be exercised |
Credit not
recommended |
|
|
-- |
NB |
New Business |
-- |
|
This score serves as a reference to assess SC’s credit risk
and to set the amount of credit to be extended. It is calculated from a composite
of weighted scores obtained from each of the major sections of this report. The
assessed factors and their relative weights (as indicated through %) are as
follows:
Financial
condition (40%) Ownership
background (20%) Payment
record (10%)
Credit history
(10%) Market trend
(10%) Operational
size (10%)
This report is issued at your request without any
risk and responsibility on the part of MIRA INFORM PRIVATE LIMITED (MIPL)
or its officials.