MIRA INFORM REPORT
|
Report Date : |
15.10.2014 |
IDENTIFICATION DETAILS
|
Name : |
SWING TRADE B.V. |
|
|
|
|
Registered Office : |
Binnenweg 3, 2411NN Bodegraven |
|
|
|
|
Country : |
Netherlands
|
|
|
|
|
Financials (as on) : |
31.12.2010 |
|
|
|
|
Date of Incorporation : |
01.07.2000 |
|
|
|
|
Com. Reg. No.: |
KvK-nummer: 28087398 |
|
|
|
|
Legal Form : |
Besloten Vennootschap |
|
|
|
|
Line of Business : |
|
|
|
|
|
No. of Employees : |
1 |
RATING & COMMENTS
|
MIRA’s Rating : |
Ca |
|
RATING |
STATUS |
PROPOSED CREDIT LINE |
|
|
11-25 |
Ca |
Adverse factors are apparent. Repayment of interest and principal sums
in default or expected to be in default upon maturity |
Limited with
full security |
|
Status : |
Moderate |
|
Payment Behaviour : |
Unknown |
|
Litigation : |
Clear |
NOTES :
Any query related to this report can be made
on e-mail : infodept@mirainform.com
while quoting report number, name and date.
ECGC Country Risk Classification List – June 1, 2014
|
Country Name |
Previous Rating (31.03.2014) |
Current Rating (01.06.2014) |
|
Netherlands |
A1 |
A1 |
|
Risk Category |
ECGC
Classification |
|
Insignificant |
A1 |
|
Low |
A2 |
|
Moderate |
B1 |
|
High |
B2 |
|
Very High |
C1 |
|
Restricted |
C2 |
|
Off-credit |
D |
NETHERLANDS - ECONOMIC
OVERVIEW
Netherlands is the
sixth-largest economy in the euro-zone and is noted for its stable industrial
relations, moderate unemployment and inflation, sizable trade surplus, and
important role as a European transportation hub. Industrial activity is
predominantly in food processing, chemicals, petroleum refining, and electrical
machinery. A highly mechanized agricultural sector employs only 2% of the labor
force but provides large surpluses for the food-processing industry and for
exports. Netherlands, along with 11 of its EU partners, began circulating the
euro currency on 1 January 2002. The Dutch financial sector suffered as a
result of the global financial crisis, due in part to the high exposure of some
Dutch banks to US mortgage-backed securities. In 2008, the government
nationalized two banks and injected billions of dollars of capital into other
financial institutions, to prevent further deterioration of a crucial sector.
After 26 years of uninterrupted economic growth, the Dutch economy - highly
dependent on an international financial sector and international trade -
contracted by 3.5% in 2009. To recover, the government sought to boost the
domestic economy by accelerating infrastructure programs, offering corporate
tax breaks for employers to retain workers, and expanding export credit
facilities. The stimulus programs and bank bailouts, however, resulted in a
government budget deficit of 5.3% of GDP in 2010 that contrasted sharply with a
surplus of 0.7% in 2008. The government of Prime Minister Mark RUTTE began
implementing austerity measures in early 2011, mainly reducting expenditures,
which resulted in an improved budget deficit in 2011. However, in 2012 tax
revenues dropped, GDP contracted, and the budget deficit deteriorated. In 2013,
the government budget deficit decreased to 3.3% of GDP due to increased
government revenue from higher taxes. However, spending on social benefits also
increased, due to a rise in unemployment benefits and payments for pensions.
The high unemployment rate and tax increases have contributed to continued
decreases in household disposable income, causing the Dutch economy to contract
|
Source
: CIA |
Company
name
Swing Trade B.V.
Operative
address
Binnenweg 3
2411NN Bodegraven
Netherlands
Legal form Besloten
Vennootschap
Registration number KvK-nummer:
28087398
VAT-number 809117538
|
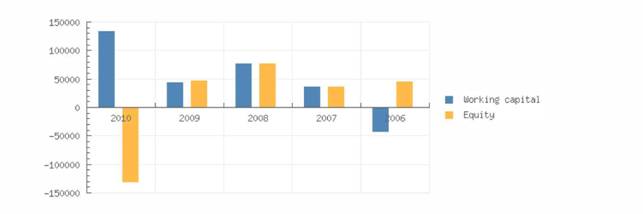
Year |
2010 |
Mutation |
2009 |
Mutation |
2008 |
|
Fixed assets |
2.462 |
-21,42 |
3.133 |
|
|
|
Total receivables |
1.630.572 |
107.89 |
784.324 |
-35.00 |
1.206.686 |
|
Total equity |
-132.507 |
-379,17 |
47.464 |
-39.00 |
77.804 |
|
Short term liabilities |
1.796.605 |
* |
100,62 |
895.546 |
|
-42,76 |
1.564.657 |
|
|
|||||||
|
Working capital |
134.265 |
|
202,87 |
44.331 |
|
-43,02 |
77.804 |
|
Quick ratio |
0,91 |
|
3,41 |
0,88 |
|
14,29 |
0,77 |
Contact
information
Company name Swing
Trade B.V.
Trade names Swing
Trade B.V.
Operative address Binnenweg
3
2411NN
Bodegraven
Netherlands
Correspondence address Postbus
134
2410AC
Bodegraven
Netherlands
Telephone number 0172618272
Fax number 0172612029
Email address db.connect@inter.nl
Registration
Registration number KvK-nummer:
28087398
Branch number 000000645478
VAT-number 809117538
Status Active
First registration company register 2000-11-29
Memorandum 2000-11-23
Establishment date 2000-07-01
Legal form Besloten
Vennootschap
Activities
SBI Agents
involved in the sale of food (4617)
Wholesale
of other machines, equipment and supplies for manufacturing and trade n.e.c.
(46699)
Wholesale
of basic and industrial chemicals (46751)
Exporter Yes
Importer Yes
Goal Import,
export, voeren handelsonderneming in textiel en levensmiddelen. Handel in
nieuween tweedehands machines, metalen, edelen metalen, edelen stenen,
chemicaliën en papier.
Relations
Shareholders Ahtesham
Percentage:
100%
Dabcon
B.V.
Registration
number: 281008190000
Companies on same address
Bouwbureau
en Aannemingsbedrijf De Wilde B.V.
Registration
number: 290389860002
In
Balans" Administratiebureau
Registration
number: 281176320000
Management
Active management D.
de Baan - Bari (Durreshahwar)
Netherlands
Competence:
Fully authorized
Function:
Manager
Starting
date: 2000-11-23
Date
of birth: 1959-06-01, Bombay, IN
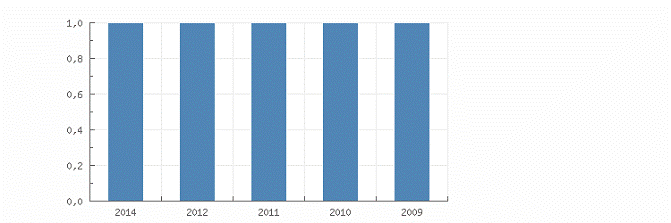
Employees
|
Year |
2014 |
2012 |
2011 |
2010 |
2009 |
|
Total |
1 |
1 |
1 |
1 |
1 |
Payments
Description Payments made under regular
condition
Key figures
|
|
|||||
|
Year |
2010 |
2009 |
2008 |
2007 |
2006 |
|
Quick ratio |
0,91 |
0,88 |
0,77 |
1,08 |
0,69 |
|
Current ratio |
1,07 |
1,05 |
1,05 |
1,14 |
0,83 |
|
|
|||||
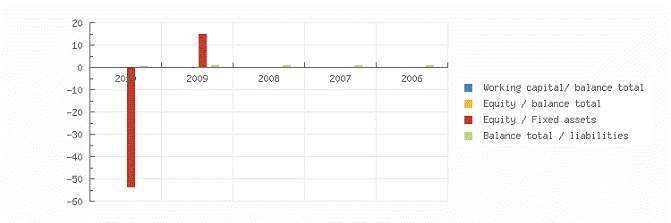
|
Working capital/ balance total |
0,07 |
0,05 |
0,05 |
0,12 |
-0,15 |
|
Equity / balance total |
-0,07 |
0,05 |
0,05 |
0,12 |
0,16 |
|
Equity / Fixed assets |
-53,82 |
15,15 |
|
|
0,52 |
|
Equity / liabilities |
-0,06 |
0,05 |
0,05 |
0,14 |
0,19 |
|
Balance total / liabilities |
0,94 |
1,05 |
1,05 |
1,14 |
1,19 |
|
|
|||||
|
Working capital |
134.265 |
44.331 |
77.804 |
38.022 |
-43.452 |
|
Equity |
-132.507 |
47.464 |
77.804 |
38.022 |
47.056 |
|
Mutation equity |
-379,17 |
-39,00 |
104,63 |
-19,20 |
884,27 |
Summary
The 2010 financial result structure is a postive working
captial of 134.265 euro, which is in
agreement with 7 % of the total assets of the company.
The working capital has increased with 202.87 % compared
to previous year. The ratio, with
respect to the total assets of the company has however,
increased.
The improvement between 2009 and 2010 has mainly been
caused by an increase of the
current assets.
The current ratio of the company in 2010 was 1.07. When
the current ratio is below 1.5, the
company may have problems meeting its short-term
obligations.
The quick ratio in 2010 of the company was 0.91. A company
with a Quick Ratio of less than
1 cannot currently pay back its current liabilities.
The 2009 financial result structure is a postive working
captial of 44.331 euro, which is in
agreement with 5 % of the total assets of the company.
The working capital has diminished with -43.02 % compared
to previous year. The ratio with
respect to the total assets of the company remains
unchanged.
The deterioration between 2008 and 2009 has mainly been
caused by an increase of the
current liabilities.
The current ratio of the company in 2009 was 1.05. When
the current ratio is below 1.5, the
company may have problems meeting its short-term
obligations.
The quick ratio in 2009 of the company was 0.88. A company
with a Quick Ratio of less than
1 cannot currently pay back its current liabilities.

Financial
statement
Last annual account 2010
Remark
annual account Although
the statutory period has expired, the company's annual reports are not yet
published.
Type of annual account Corporate
Annual account Swing
Trade B.V.
Binnenweg
3
2411NN
Bodegraven
Netherlands
Registration
number: 280873980000
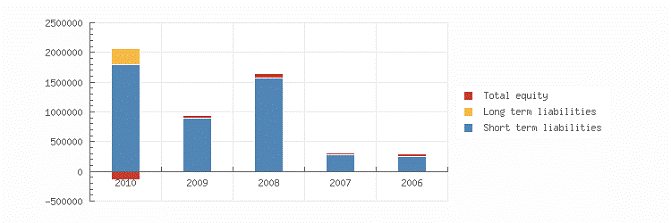
Balance
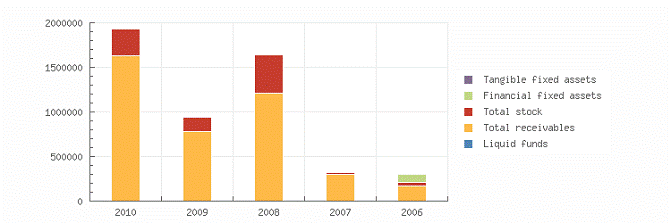
|
Year |
2010 |
2009 |
2008 |
2007 |
2006 |
|
End date |
2010-12-31 |
2009-12-31 |
2008-12-31 |
2007-12-31 |
2006-12-31 |
|
Tangible fixed assets |
2.462 |
3.133 |
|
||
|
Financial fixed assets |
|
90.508 |
|||
|
Fixed assets |
2.462 |
3.133 |
|
90.508 |
|
|
|
|||||
|
Total stock |
299.958 |
154.986 |
434.773 |
16.200 |
34.874 |
|
Total receivables |
1.630.572 |
784.325 |
1.206.686 |
300.797 |
173.229 |
|
Liquid funds |
340 |
566 |
1.002 |
389 |
404 |
|
Current assets |
1.930.870 |
939.877 |
1.642.461 |
317.386 |
208.507 |
|
Total assets |
1.933.332 |
943.010 |
1.642.461 |
317.386 |
299.015 |
|
|
|||||
|
Issued capital |
18.000 |
18.000 |
18.000 |
18.000 |
18.000 |
|
Other reserves |
-150.507 |
29.464 |
59.804 |
20.022 |
29.056 |
|
Total reserves |
-150.507 |
29.464 |
59.804 |
20.022 |
29.056 |
|
Total equity |
-132.507 |
47.464 |
77.804 |
38.022 |
47.056 |
|
|
|||||
|
Long term interest yielding debt |
269.234 |
|
|
|
|
|
Long term liabilities |
269.234 |
|
|||
|
Short term liabilities |
1.796.605 |
895.546 |
1.564.657 |
279.364 |
251.959 |
|
Total short and long term liabilities |
2.065.839 |
895.546 |
1.564.657 |
279.364 |
251.959 |
|
Total liabilities |
1.933.332 |
943.010 |
1.642.461 |
317.386 |
299.015 |
Summary
The total assets of the company increased with 105.02 %
between 2009 and 2010.
Despite the assets growth, the non current assets
decreased with -21.42 %.
Asset growth is in contrasts with the net worth decline of
-379.17 %. The company's
indebtedness has, therefore, increased with 130.68 %.
In 2010 the assets of the company were 0.13 % composed of
fixed assets and 99.87 % by
current assets. The assets are being financed by an equity
of -6.85 %, and total debt of
106.85 %.
The total assets of the company decreased with -42.59 %
between 2008 and 2009.
Assets reduction is explained by a Net Worth decrease of
-39 %, and an indebtedness
reduction of -42.76 %.
In 2009 the assets of the company were 0.33 % composed of
fixed assets and 99.67 % by
current assets. The assets are being financed by an equity
of 5.03 %, and total debt of 94.97
%
Analysis
Branch (SBI) Wholesale
trade (no motor vehicles and motorcycles) (46)
Region Rijnland
In
the Netherlands 109662 of the companies are registered with the SBI code 46
In
the region Rijnland 4319 of the companies are registered with the SBI code 46
In
the Netherlands 2387 of the bankrupcties are published within this sector
In
the region Rijnland 97 of the bankruptcies are published within this sector
The
risk of this specific sector in the Netherlands is normal
The
risk of this specific sector in the region Rijnland is normal
Publications
Filings 27-01-2011:
De jaarrekening over 2009 is gepubliceerd.
08-01-2010:
De jaarrekening over 2008 is gepubliceerd.
Functions 22-06-2011:
Per 29-04-2011 is bestuurder Mohammed Yunus Ayyub Khan uit functie
getreden.
FOREIGN EXCHANGE RATES
|
Currency |
Unit
|
Indian Rupees |
|
US Dollar |
1 |
Rs.61.10 |
|
|
1 |
Rs.98.15 |
|
Euro |
1 |
Rs.77.68 |
INFORMATION DETAILS
|
Analysis Done by
: |
SUB |
|
|
|
|
Report Prepared
by : |
PDT |
RATING EXPLANATIONS
|
RATING |
STATUS |
PROPOSED CREDIT LINE |
|
|
|
>86 |
Aaa |
Possesses an extremely sound financial base with the strongest
capability for timely payment of interest and principal sums |
Unlimited |
|
|
71-85 |
Aa |
Possesses adequate working capital. No caution needed for credit
transaction. It has above average (strong) capability for payment of interest
and principal sums |
Large |
|
|
56-70 |
A |
Financial & operational base are regarded healthy. General unfavourable
factors will not cause fatal effect. Satisfactory capability for payment of
interest and principal sums |
Fairly Large |
|
|
41-55 |
Ba |
Overall operation is considered normal. Capable to meet normal
commitments. |
Satisfactory |
|
|
26-40 |
B |
Capability to overcome financial difficulties seems comparatively
below average. |
Small |
|
|
11-25 |
Ca |
Adverse factors
are apparent. Repayment of interest and principal sums in default or expected
to be in default upon maturity |
Limited with full security |
|
|
<10 |
C |
Absolute credit risk exists. Caution needed to be exercised |
Credit not
recommended |
|
|
-- |
NB |
New Business |
-- |
|
This score serves as a reference to assess SC’s
credit risk and to set the amount of credit to be extended. It is calculated
from a composite of weighted scores obtained from each of the major sections of
this report. The assessed factors and their relative weights (as indicated
through %) are as follows:
Financial
condition (40%) Ownership
background (20%) Payment
record (10%)
Credit history
(10%) Market trend (10%) Operational size
(10%)
This report is issued at your request without any
risk and responsibility on the part of MIRA INFORM PRIVATE LIMITED (MIPL) or
its officials.