MIRA
INFORM REPORT
|
Report Date : |
01.09.2014 |
IDENTIFICATION DETAILS
|
Name : |
FAIRMONT & MAIN LIMITED |
|
|
|
|
Registered Office : |
|
|
|
|
|
Country : |
|
|
|
|
|
Financials (as on) : |
31.05.2013 |
|
|
|
|
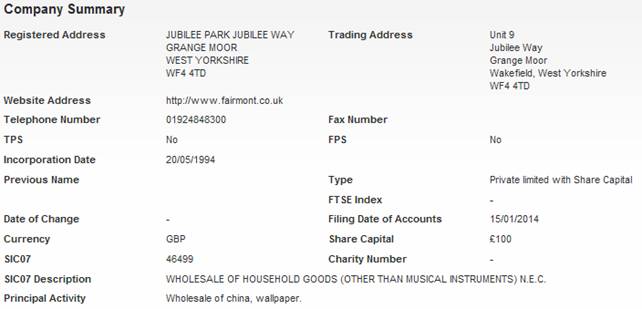
Date of Incorporation : |
20.05.1994 |
|
|
|
|
Com. Reg. No.: |
02931622 |
|
|
|
|
Legal Form : |
Private Limited with Share Capital |
|
|
|
|
Line of Business : |
·
Wholesale of Household Goods (Other than Musical
Instrument) N.E.C. ·
Wholesale of |
|
|
|
|
No. of Employees |
Not Available |
RATING & COMMENTS
|
MIRA’s Rating : |
B |
|
RATING |
STATUS |
PROPOSED CREDIT LINE |
|
|
26-40 |
B |
Capability to overcome financial difficulties seems comparatively
below average. |
Small |
|
Status : |
Moderate |
|
|
|
|
Payment Behaviour : |
No Complaints |
|
|
|
|
Litigation : |
Clear |
NOTES :
Any query related to this report can be made on
e-mail : infodept@mirainform.com
while quoting report number, name and date.
The
|
Source
: CIA |
REGISTERED NAME & COMPANY
SUMMARY
|
Company Name: |
FAIRMONT & MAIN LIMITED |
|
Company No: |
02931622 |
|
Company Status: |
Active - Accounts Filed |
DIRECTORS/MANAGEMENT
Current Directors
|
Name |
Date of Birth |
11/08/1944 |
|
|
Officers Title |
Mrs |
Nationality |
British |
|
Present Appointments |
5 |
Function |
Director |
|
Appointment Date |
20/05/1994 |
|
|
|
Address |
|
||
Previous
Director/Company Secretaries
|
Name |
Current
Directorships |
Previous
Directorships |
|
2 |
1 |
|
|
0 |
1 |
|
|
0 |
2 |
|
|
0 |
2 |
|
|
1697 |
53451 |
|
|
1799 |
53393 |
NEGATIVE INFORMATION
CCJ
|
Total Number of Exact CCJs - |
Total Value of Exact CCJs - |
||
|
Total Number of Possible CCJs - |
Total Value of Possible CCJs - |
||
|
Total Number of Satisfied CCJs - |
Total Value of Satisfied CCJs - |
||
|
Total Number of Writs - |
- |
|
|
Exact CCJ Details
|
No CCJs found |
Possible CCJs
Details
|
There are no possible CCJ details |
Writ Details
|
No writs found |
SHARE & SHARE CAPITAL
INFORMATION
Top 20 Shareholders
|
Name |
Currency |
Share Count |
Share Type |
Nominal Value |
|
GLENNIS ANNE HARRISON |
GBP |
5,000 |
ORDINARY |
0.01 |
|
EXECUTORS OF P.V. |
GBP |
5,000 |
ORDINARY |
0.01 |
Unable to report percentage holdings as filed Shareholder listing is not
full.
GROUP STRUCTURE & AFFILIATED
COMPANIES
Statistics
|
Group |
- |
|
Linkages |
|
|
Countries |
Summary
|
Holding Company |
- |
|
Ownership Status |
|
|
Ultimate Holding Company |
- |
Group structure
No group structure
FINANCIAL INFORMATION
Profit & Loss
|
Date Of Accounts |
31/05/13 |
(%) |
31/05/12 |
(%) |
31/05/11 |
(%) |
31/05/10 |
(%) |
31/05/09 |
|
Weeks |
52 |
(%) |
52 |
(%) |
52 |
(%) |
52 |
(%) |
52 |
|
Currency |
GBP |
(%) |
GBP |
(%) |
GBP |
(%) |
GBP |
(%) |
GBP |
|
Consolidated A/cs |
N |
(%) |
N |
(%) |
N |
(%) |
N |
(%) |
N |
|
Turnover |
- |
- |
- |
- |
- |
- |
- |
- |
- |
|
Export |
- |
- |
- |
- |
- |
- |
- |
- |
- |
|
Cost of Sales |
- |
- |
- |
- |
- |
- |
- |
- |
- |
|
Gross Profit |
- |
- |
- |
- |
- |
- |
- |
- |
- |
|
Wages & Salaries |
- |
- |
- |
- |
- |
- |
- |
- |
- |
|
Directors Emoluments |
- |
- |
- |
- |
- |
- |
- |
- |
- |
|
Operating Profit |
- |
- |
- |
- |
- |
- |
- |
- |
- |
|
Depreciation |
£16,105 |
-14.1% |
£18,741 |
-10.6% |
£20,974 |
-7.2% |
£22,595 |
-7.6% |
£24,454 |
|
Audit Fees |
- |
- |
- |
- |
- |
- |
- |
- |
- |
|
Interest Payments |
- |
- |
- |
- |
- |
- |
- |
- |
- |
|
Pre Tax Profit |
- |
- |
- |
- |
- |
- |
- |
- |
- |
|
Taxation |
- |
- |
- |
- |
- |
- |
- |
- |
- |
|
Profit After Tax |
- |
- |
- |
- |
- |
- |
- |
- |
- |
|
Dividends Payable |
- |
- |
- |
- |
- |
- |
- |
- |
- |
|
Retained Profit |
- |
- |
- |
- |
- |
- |
- |
- |
- |
Balance Sheet
|
Date Of Accounts |
31/05/13 |
(%) |
31/05/12 |
(%) |
31/05/11 |
(%) |
31/05/10 |
(%) |
31/05/09 |
|
Tangible Assets |
£1,237,921 |
-1.2% |
£1,252,773 |
-2.2% |
£1,281,019 |
-1.5% |
£1,300,683 |
-1.5% |
£1,320,583 |
|
Intangible Assets |
0 |
- |
0 |
- |
0 |
- |
0 |
- |
0 |
|
Total Fixed Assets |
£1,237,921 |
-1.2% |
£1,252,773 |
-2.2% |
£1,281,019 |
-1.5% |
£1,300,683 |
-1.5% |
£1,320,583 |
|
Stock |
£511,722 |
-10.3% |
£570,306 |
6.8% |
£533,847 |
-16.1% |
£636,542 |
-3.2% |
£657,677 |
|
Trade Debtors |
£325,825 |
-7.3% |
£351,465 |
-26.8% |
£480,160 |
-7.3% |
£517,878 |
14.6% |
£451,969 |
|
Cash |
£5,133 |
-46.8% |
£9,653 |
659.5% |
£1,271 |
-84.6% |
£8,236 |
-35% |
£12,680 |
|
Other Debtors |
0 |
- |
0 |
- |
0 |
- |
0 |
- |
0 |
|
Miscellaneous Current Assets |
0 |
- |
0 |
- |
0 |
- |
0 |
- |
0 |
|
Total Current Assets |
£842,680 |
-9.5% |
£931,424 |
-8.3% |
£1,015,278 |
-12.7% |
£1,162,656 |
3.6% |
£1,122,326 |
|
Trade Creditors |
£828,777 |
-5.2% |
£874,052 |
0.2% |
£872,015 |
-9.2% |
£960,244 |
1.5% |
£946,338 |
|
Bank Loans & Overdrafts |
0 |
- |
0 |
- |
0 |
- |
0 |
- |
0 |
|
Other Short Term Finance |
0 |
- |
0 |
- |
0 |
- |
0 |
- |
0 |
|
Miscellaneous Current Liabilities |
0 |
- |
0 |
- |
0 |
- |
0 |
- |
0 |
|
Total Current Liabilities |
£828,777 |
-5.2% |
£874,052 |
0.2% |
£872,015 |
-9.2% |
£960,244 |
1.5% |
£946,338 |
|
Bank Loans & Overdrafts and LTL |
£300,521 |
-18.8% |
£370,105 |
-19.7% |
£460,693 |
-18.2% |
£563,475 |
-14.6% |
£659,928 |
|
Other Long Term Finance |
0 |
- |
0 |
- |
0 |
- |
0 |
-100% |
£210,654 |
|
Total Long Term Liabilities |
£300,521 |
-18.8% |
£370,105 |
-19.7% |
£460,693 |
-18.2% |
£563,475 |
-14.6% |
£659,928 |
Capital &
Reserves
|
Date Of Accounts |
31/05/13 |
(%) |
31/05/12 |
(%) |
31/05/11 |
(%) |
31/05/10 |
(%) |
31/05/09 |
|
Called Up Share Capital |
£100 |
- |
£100 |
- |
£100 |
- |
£100 |
- |
£100 |
|
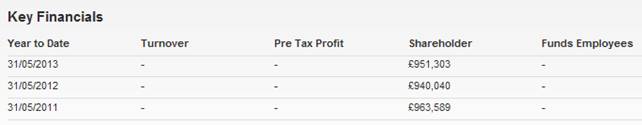
P & L Account Reserve |
£951,203 |
1.2% |
£939,940 |
-2.4% |
£963,489 |
2.6% |
£939,520 |
12.3% |
£836,543 |
|
Revaluation Reserve |
- |
- |
- |
- |
- |
- |
- |
- |
- |
|
Sundry Reserves |
- |
- |
- |
- |
- |
- |
- |
- |
- |
|
Shareholder Funds |
£951,303 |
1.2% |
£940,040 |
-2.4% |
£963,589 |
2.6% |
£939,620 |
12.3% |
£836,643 |
Other Financial
Items
|
Date Of Accounts |
31/05/13 |
(%) |
31/05/12 |
(%) |
31/05/11 |
(%) |
31/05/10 |
(%) |
31/05/09 |
|
Net Worth |
£951,303 |
1.2% |
£940,040 |
-2.4% |
£963,589 |
2.6% |
£939,620 |
12.3% |
£836,643 |
|
Working Capital |
£13,903 |
-75.8% |
£57,372 |
-60% |
£143,263 |
-29.2% |
£202,412 |
15% |
£175,988 |
|
Total Assets |
£2,080,601 |
-4.7% |
£2,184,197 |
-4.9% |
£2,296,297 |
-6.8% |
£2,463,339 |
0.8% |
£2,442,909 |
|
Total Liabilities |
£1,129,298 |
-9.2% |
£1,244,157 |
-6.6% |
£1,332,708 |
-12.5% |
£1,523,719 |
-5.1% |
£1,606,266 |
|
Net Assets |
£951,303 |
1.2% |
£940,040 |
-2.4% |
£963,589 |
2.6% |
£939,620 |
12.3% |
£836,643 |
Cash Flow
|
Date Of Accounts |
31/05/13 |
(%) |
31/05/12 |
(%) |
31/05/11 |
(%) |
31/05/10 |
(%) |
31/05/09 |
|
Net Cashflow from Operations |
- |
- |
- |
- |
- |
- |
- |
- |
- |
|
Net Cashflow before Financing |
- |
- |
- |
- |
- |
- |
- |
- |
- |
|
Net Cashflow from Financing |
- |
- |
- |
- |
- |
- |
- |
- |
- |
|
Increase in Cash |
- |
- |
- |
- |
- |
- |
- |
- |
- |
Miscellaneous
|
Date Of Accounts |
31/05/13 |
(%) |
31/05/12 |
(%) |
31/05/11 |
(%) |
31/05/10 |
(%) |
31/05/09 |
|
Contingent Liability |
NO |
- |
NO |
- |
NO |
- |
NO |
- |
NO |
|
Capital Employed |
£1,251,824 |
-4.5% |
£1,310,145 |
-8% |
£1,424,282 |
-5.2% |
£1,503,095 |
0.4% |
£1,496,571 |
|
Number of Employees |
- |
- |
- |
- |
- |
- |
- |
- |
- |
|
Auditors |
SIMPSON WOOD |
||||||||
|
Auditor Comments |
The audit report contains no adverse comments |
||||||||
|
Bankers |
|
||||||||
|
Bank Branch Code |
|
||||||||
Ratios
|
Date Of Accounts |
31/05/13 |
31/05/12 |
31/05/11 |
31/05/10 |
31/05/09 |
|
Pre-tax profit margin % |
- |
- |
- |
- |
- |
|
Current ratio |
1.02 |
1.07 |
1.16 |
1.21 |
1.19 |
|
Sales/Net Working Capital |
- |
- |
- |
- |
- |
|
Gearing % |
31.60 |
39.40 |
47.80 |
60 |
78.90 |
|
Equity in % |
45.70 |
43 |
42 |
38.10 |
34.20 |
|
Creditor Days |
- |
- |
- |
- |
- |
|
Debtor Days |
- |
- |
- |
- |
- |
|
Liquidity/Acid Test |
0.39 |
0.41 |
0.55 |
0.54 |
0.49 |
|
Return On Capital Employed % |
- |
- |
- |
- |
- |
|
Return On Total Assets Employed % |
- |
- |
- |
- |
- |
|
Current Debt Ratio |
0.87 |
0.92 |
0.90 |
1.02 |
1.13 |
|
Total Debt Ratio |
1.18 |
1.32 |
1.38 |
1.62 |
1.91 |
|
Stock Turnover Ratio % |
- |
- |
- |
- |
- |
|
Return on Net Assets Employed % |
- |
- |
- |
- |
- |
Creditor Details
|
|
Total Number |
Total
Value |
|
Trade Creditors |
0 |
- |
|
No Creditor Data |
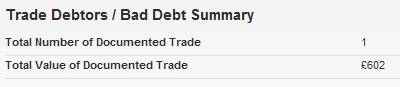
Trade Debtors /
Bad Debt Detail
|
|
Total Number of
Documented Trade |
Total Value of
Documented Trade |
|
Trade Debtors |
1 |
£602 |
|
Company Name |
Amount |
Statement Date |
|
£602 |
26/02/2013 |
FOREIGN EXCHANGE RATES
N/a
ADDITIONAL INFORMATION
Enquiries Trend
|
There have been 40 enquiries in the last 12 months. |
|
There are an average of 3 reports taken each month. |
Current Company
Secretary
|
Name |
Date of Birth |
11/08/1944 |
|
|
Officers Title |
Mrs |
Nationality |
British |
|
Present Appointments |
5 |
Function |
Company Secretary |
|
Appointment Date |
28/10/1994 |
|
|
|
Address |
|
||
Status History
|
No Status History found |
Event History
|
Date |
Description |
|
06/06/2014 |
Annual Returns |
|
22/01/2014 |
New Accounts Filed |
|
22/01/2014 |
New Accounts Filed |
|
12/12/2013 |
Mr P.V. Harrison has left the board |
|
25/05/2013 |
Annual Returns |
|
24/05/2013 |
Change in Reg.Office |
|
26/02/2013 |
New Accounts Filed |
|
26/02/2013 |
New Accounts Filed |
|
26/05/2012 |
Annual Returns |
|
07/03/2012 |
New Accounts Filed |
|
27/05/2011 |
Annual Returns |
|
05/03/2011 |
New Accounts Filed |
|
05/03/2011 |
New Accounts Filed |
|
11/06/2010 |
Annual Returns |
|
09/03/2010 |
New Accounts Filed |
Previous Company
Names
No Previous Names found
NOTES & COMMENTS
Commentary
|
No exact match CCJs are recorded against the company. |
|
|
The company's credit rating has dropped from 60 to 48 but the company
is still indicating it is creditworthy. |
|
|
The credit limit on this company has fallen 60% in comparison to the
previously suggested credit limit. |
|
|
There is insufficient data to indicate a change in this company's
percentage of sales. |
|
|
Net Worth increased by 1.2% during the latest trading period. |
|
|
A 4.7% decline in Total Assets occurred during the latest trading
period. |
|
|
There is insufficient data to indicate a change in this company's
pre-tax profit. |
|
|
The company saw a decrease in their Cash Balance of 46.8% during the
latest trading period. |
|
|
The audit report contains no adverse comments. |
|
|
The company has undergone recent changes in its directorships. |
|
|
The company is not part of a group. |
|
|
The movement in accumulated earnings would indicate that the company
made a profit after tax and other appropriations, including dividends. |
|
|
The company has changed its registered address recently. |
|
|
The company was established over 20 years ago. |
|
FOREIGN EXCHANGE RATES
|
Currency |
Unit
|
Indian Rupees |
|
US Dollar |
1 |
Rs.60.48 |
|
|
1 |
Rs.100.35 |
|
Euro |
1 |
Rs.79.86 |
INFORMATION DETAILS
|
Analysis Done by
: |
SUB |
|
|
|
|
Report Prepared
by : |
SDA |
RATING EXPLANATIONS
|
RATING |
STATUS |
PROPOSED CREDIT LINE |
|
|
|
>86 |
Aaa |
Possesses an extremely sound financial base with the strongest
capability for timely payment of interest and principal sums |
Unlimited |
|
|
71-85 |
Aa |
Possesses adequate working capital. No caution needed for credit
transaction. It has above average (strong) capability for payment of interest
and principal sums |
Large |
|
|
56-70 |
A |
Financial & operational base are regarded healthy. General
unfavourable factors will not cause fatal effect. Satisfactory capability for
payment of interest and principal sums |
Fairly Large |
|
|
41-55 |
Ba |
Overall operation is considered normal. Capable to meet normal
commitments. |
Satisfactory |
|
|
26-40 |
B |
Capability to
overcome financial difficulties seems comparatively below average. |
Small |
|
|
11-25 |
Ca |
Adverse factors are apparent. Repayment of interest and principal sums
in default or expected to be in default upon maturity |
Limited with
full security |
|
|
<10 |
C |
Absolute credit risk exists. Caution needed to be exercised |
Credit not
recommended |
|
|
-- |
NB |
New Business |
-- |
|
This score serves as a reference to assess SC’s credit risk
and to set the amount of credit to be extended. It is calculated from a composite
of weighted scores obtained from each of the major sections of this report. The
assessed factors and their relative weights (as indicated through %) are as
follows:
Financial
condition (40%) Ownership
background (20%) Payment
record (10%)
Credit history
(10%) Market trend
(10%) Operational
size (10%)
This report is issued at your request without any
risk and responsibility on the part of MIRA INFORM PRIVATE LIMITED (MIPL)
or its officials.