MIRA
INFORM REPORT
|
Report Date : |
01.09.2014 |
IDENTIFICATION DETAILS
|
Name : |
IMPERIAL CABLE
INDUSTRY CO., LTD. |
|
|
|
|
Registered Office : |
69/22 Moo 9,
T. Raiking, A. Sampran,
Nakornpathom 73210 |
|
|
|
|
Country : |
|
|
|
|
|
Financials (as on) : |
31.12.2013 |
|
|
|
|
Date of Incorporation : |
12.03.1997 |
|
|
|
|
Com. Reg. No.: |
0105540025589 |
|
|
|
|
Legal Form : |
Private
Limited Company |
|
|
|
|
Line of Business : |
Manufacture wide range
of control cables and
hoses assembly for automotive
and other industries.
|
|
|
|
|
No of Employees : |
90 |
RATING & COMMENTS
|
MIRA’s Rating : |
B |
|
RATING |
STATUS |
PROPOSED CREDIT LINE |
|
|
26-40 |
B |
Capability to overcome financial difficulties seems comparatively
below average. |
Small |
|
Status : |
Moderate |
|
|
|
|
Payment Behaviour : |
Slow but correct |
|
|
|
|
Litigation : |
Clear |
NOTES :
Any query related to this report can be made
on e-mail : infodept@mirainform.com
while quoting report number, name and date.
ECGC Country Risk Classification List – June 01, 2014
|
Country Name |
Previous Rating (31.03.2014) |
Current Rating (01.06.2014) |
|
|
B1 |
B1 |
|
Risk Category |
ECGC
Classification |
|
Insignificant |
A1 |
|
Low Risk |
A2 |
|
Moderate Low Risk |
B1 |
|
Moderate Risk |
B2 |
|
Moderate High Risk |
C1 |
|
High Risk |
C2 |
|
Very High Risk |
D |
With a well-developed
infrastructure, a free-enterprise economy, generally pro-investment policies,
and strong export industries,
|
Source
: CIA |
COMPANY NAME
IMPERIAL CABLE INDUSTRY CO., LTD.
SUMMARY
BUSINESS
ADDRESS : 69/22
MOO 9, T. RAIKING,
A. SAMPRAN,
TELEPHONE : [66] 2810-2437-8,
2813-4613-4
FAX :
[66] 2810-2438
E-MAIL
ADDRESS : virayont@loxinfo.co.th
REGISTRATION
ADDRESS : SAME
AS BUSINESS ADDRESS
ESTABLISHED
: 1997
REGISTRATION
NO. : 0105540025589
TAX
ID NO. : 3011823767
CAPITAL REGISTERED : BHT. 50,000,000
CAPITAL PAID-UP : BHT.
50,000,000
SHAREHOLDER’S PROPORTION : THAI : 100%
FISCAL YEAR CLOSING DATE : DECEMBER 31
LEGAL
STATUS : PRIVATE LIMITED
COMPANY
EXECUTIVE : MR. VIRA WONGCHAMCHAROEN, THAI
MANAGING DIRECTOR
NO.
OF STAFF : 90
LINES
OF BUSINESS : CONTROL CABLES AND
HOSES ASSEMBLY
MANUFACTURER, DISTRIBUTOR
AND EXPORTER
CORPORATE PROFILE
|
OPERATING
TREND : STABLE
PRESENT
SITUATION : OPERATING NORMALLY
REPUTATION : GOOD
WITH
MANAGEMENT
STANDARD : MANAGEMENT WITH
FAIR PERFORMANCE
HISTORY
The
subject was established
on March 12,
1997 as a private
limited company under
the registered name
IMPERIAL CABLE INDUSTRY
CO., LTD., by Thai group,
with the business
objective to manufacture
wide range of
control cables and hoses assembly for
automotive and other
industries. It currently
employs approximately 90
staff.
It has achieved the standard
ISO 9002 certification
since 1999 by
UKAS Quality Management.
The
subject’s registered address
is 69/22 Moo 9,
T. Raiking, A. Sampran, Nakornpathom
73210, and this
is the subject’s
current operation address.
THE BOARD
OF DIRECTOR
|
Name |
|
Nationality |
Age |
|
|
|
|
|
|
Mr. Vira Wongchamcharoen |
[x] |
Thai |
75 |
|
Mr. Taweesak Wongchamcharoen |
|
Thai |
49 |
|
Mr. Sakchai Wongchamcharoen |
|
Thai |
47 |
|
Mrs. Waraporn Pomthong |
|
Thai |
51 |
AUTHORIZED PERSON
Only the mentioned
director [x] can
sign or any
two of the
rest directors can
jointly sign on
behalf of the
subject with company’s
affixed.
MANAGEMENT
Mr. Vira Wongchamcharoen is
the Managing Director.
He is Thai
nationality with the
age of 75 years
old.
BUSINESS OPERATIONS
The subject
is engaged in
wide range of
control cables and hoses assembling, e.g. accelerator cables,
hand brake cables,
speedometer cables, engine
control cables, hook
cabin & bonnet cables, shift
and select gear
cables, transmission &
clutch cables, ignition
cables, spark plug
cables, hydraulic brake & clutch hoses,
oil & fuel hoses, hydraulic
hoses, power steering
hoses, hydraulic pipes,
king pin kits,
battery relay and etc.,
for automotives, motorcycle,
agriculture machinery, construction
equipment, marines, aircrafts
and others, under
its own brands
“IMPERIAL” and “KIKI”.
Its products are
supplied to leading
manufactures as follows:
Automobile
-
Japanese Vehicle :
DAIHATSU and etc.
-
European Vehicle : BMW, MERCIDEZ BENZ, VOLKSWAGEN,
PEUGOET
and etc.
-
Korean Vehicle :
HYUNDAI, KIA , DAEWOO
and etc.
-
American Vehicle : JEEP,
FORD, GM and
etc.
Motorcycle : HONDA,
YAMAHA, SUZUKI,
PURCHASE
Raw
materials are purchased
from suppliers both
domestic and overseas
in Japan and
Republic of China.
SALES
The products are sold to
customers both local and
overseas in Japan, Malaysia,
Indonesia and Korea.
RELATED AND
AFFILIATED COMPANIES
Virayont Group Co.,
Ltd.
Business Type :
Manufacturer of hoses
Salom Electric [
Business Type :
Manufacturer of AC/DC
adapter, converter and
power transformer
LITIGATION
Bankruptcy
and Receivership
There are no
litigation on bankruptcy
and receivership cases
filed against the
subject found at
Legal Execution Department
for the past
five years.
Others
There are no
legal suits filed
against the subject
according to the
past two years.
CREDIT
Sales are by
cash or on
the credits term
of 30-60 days.
Local bills are
paid by cash
or on the
credits term of
30-60 days.
Imports are by
L/C at sight
or T/T..
Exports are against
T/T.
BANKING
The
banker’s name was
not disclosed.
EMPLOYMENT
The
subject employs approximately
90 staff.
LOCATION DETAILS
The
premise is owned for
administrative office and factory
at the heading
address.
Premise
is located in
provincial.
COMMENT
The
subject was formed
in 1997 as
a cable and
hoses assembling. With
its experience in
the industry and
efficient providing customers
the best quality
products
and
services, subject is
well-known among the
world leading automotive
and motorcycle assembly.
FINANCIAL INFORMATION
The
capital was registered at Bht. 5,000,000 divided
into 50,000 shares
of Bht. 100
each with fully
paid.
The
capital was increased
later as follows:
Bht. 35,000,000
on June 26,
2000
Bht. 50,000,000
on June 18,
2003
The
latest registered capital
was increased to
Bht. 50,000,000 divided into 500,000 shares of
Bht. 100 each with
fully paid.
THE SHAREHOLDERS
LISTED WERE
[as
at April 30,
2014]
|
NAME |
HOLDING |
% |
|
|
|
|
|
Mr. Vira Wongchamcharoen Nationality: Thai Address :
Pomprabsattrupai, |
83,499 |
16.70 |
|
Mrs. Wannee Wongchamcharoen Nationality: Thai Address :
Pomprabsattrupai, |
83,300 |
16.66 |
|
Mrs. Waraporn Pomthong Nationality: Thai Address :
Pomprabsattrupai, |
83,300 |
16.66 |
|
Mr. Taweesak Wongchamcharoen Nationality: Thai Address : Pomprabsattrupai, |
83,300 |
16.66 |
|
Mr. Sakchai Wongchamcharoen Nationality: Thai Address :
Pomprabsattrupai, |
83,300 |
16.66 |
|
Master Kasem Wongchamcharoen Nationality: Thai Address : 62/29
Moo 1,
Bangkaenua, Pasicharoen, |
83,300 |
16.66 |
|
Ms. Maleerat Tanadumrongsak Nationality: Thai Address : 62/29
Moo 1, Bangkaenua, Pasicharoen, |
1 |
- |
Total Shareholders : 7
Share Structure
[as at April
30, 2014]
|
Nationality |
Shareholders |
No. of Share |
% Shares |
|
|
|
|
|
|
Thai |
7 |
500,000 |
100.00 |
|
Foreign |
- |
- |
- |
|
Total |
7 |
500,000 |
100.00 |
NAME OF AUDITOR
& CERTIFIED PUBLIC
ACCOUNTANT NO
Mrs. Premjit
Keratiwattanangkul No. 2985
BALANCE SHEET [BAHT]
The latest financial figures published
as at December
31, 2013, 2012
& 2011 were:
ASSETS
|
Current Assets |
2013 |
2012 |
2011 |
|
|
|
|
|
|
Cash and Cash Equivalents |
9,148,904.68 |
10,856,598.27 |
11,967,079.60 |
|
Trade Accounts &
Other Receivable |
15,497,541.61 |
15,940,590.65 |
10,279,621.33 |
|
Revenue Department Receivable |
520,482.06 |
158,275.99 |
395,946.75 |
|
Inventories |
59,364,968.88 |
58,388,211.54 |
52,117,548.84 |
|
|
|
|
|
|
Total Current Assets
|
84,531,897.23 |
85,343,676.45 |
74,760,196.52 |
|
|
|
|
|
|
Fixed Assets |
21,954,739.73 |
21,400,766.67 |
23,726,058.87 |
|
Other Non - current Assets |
2,071,721.95 |
2,348,889.35 |
1,564,639.07 |
|
Total Assets |
108,558,358.91 |
109,093,332.47 |
100,050,894.46 |
LIABILITIES &
SHAREHOLDERS’ EQUITY [BAHT]
|
Current
Liabilities |
2013 |
2012 |
2011 |
|
|
|
|
|
|
Trade Accounts & Other
Payable |
14,887,439.82 |
19,196,925.60 |
15,896,555.13 |
|
Short-term Loans |
40,488,000.00 |
37,478,000.00 |
33,515,048.00 |
|
Accrued Income Tax |
45,096.71 |
11,007.76 |
13,676.80 |
|
|
|
|
|
|
Total Current Liabilities |
55,420,536.53 |
56,685,933.36 |
49,425,279.93 |
|
Total Liabilities |
55,420,536.53 |
56,685,933.36 |
49,425,279.93 |
|
|
|
|
|
|
Shareholders' Equity |
|
|
|
|
|
|
|
|
|
Share capital : Baht 100
par value authorized, issued
and fully paid share
capital 500,000 shares |
50,000,000.00 |
50,000,000.00 |
50,000,000.00 |
|
|
|
|
|
|
Capital Paid |
50,000,000.00 |
50,000,000.00 |
50,000,000.00 |
|
Retained Earning Unappropriated |
3,137,822.38 |
2,407,399.11 |
625,614.53 |
|
Total Shareholders' Equity |
53,137,822.38 |
52,407,399.11 |
50,625,614.53 |
|
Total Liabilities &
Shareholders' Equity |
108,558,358.91 |
109,093,332.47 |
100,050,894.46 |
PROFIT &
LOSS ACCOUNT
|
Revenue |
2013 |
2012 |
2011 |
|
|
|
|
|
|
Sales Income |
77,785,958.49 |
81,871,864.65 |
72,933,735.24 |
|
Other Income |
1,605,195.29 |
3,352,183.82 |
1,955,497.49 |
|
Total Revenues |
79,391,153.78 |
85,224,048.47 |
74,889,232.73 |
|
Expenses |
|
|
|
|
|
|
|
|
|
Cost of Goods
Sold |
67,957,370.36 |
73,245,852.01 |
64,575,624.24 |
|
Selling Expenses |
3,413,993.03 |
3,598,089.08 |
2,890,818.85 |
|
Administrative Expenses |
7,160,105.75 |
6,480,452.41 |
6,572,820.57 |
|
Total Expenses |
78,531,469.14 |
83,324,393.50 |
74,039,263.66 |
|
Profit before Income
Tax |
859,684.64 |
1,899,654.97 |
849,969.07 |
|
Income Tax |
[129,261.37] |
[117,870.39] |
[186,631.81] |
|
|
|
|
|
|
Net Profit / [Loss] |
730,423.27 |
1,781,784.58 |
663,337.26 |
FINANCIAL ANALYSIS
|
ITEM |
UNIT |
2013 |
2012 |
2011 |
|
|
|
|
|
|
|
LIQUIDITY RATIO |
|
|
|
|
|
CURRENT RATIO |
TIMES |
1.53 |
1.51 |
1.51 |
|
QUICK RATIO |
TIMES |
0.45 |
0.48 |
0.46 |
|
|
|
|
|
|
|
ACTIVITY RATIO |
|
|
|
|
|
FIXED ASSETS TURNOVER |
TIMES |
3.54 |
3.83 |
3.07 |
|
TOTAL ASSETS TURNOVER |
TIMES |
0.72 |
0.75 |
0.73 |
|
INVENTORY CONVERSION PERIOD |
DAYS |
318.85 |
290.96 |
294.58 |
|
INVENTORY TURNOVER |
TIMES |
1.14 |
1.25 |
1.24 |
|
RECEIVABLES CONVERSION PERIOD |
DAYS |
72.72 |
71.07 |
51.44 |
|
RECEIVABLES TURNOVER |
TIMES |
5.02 |
5.14 |
7.09 |
|
PAYABLES CONVERSION PERIOD |
DAYS |
79.96 |
95.66 |
89.85 |
|
CASH CONVERSION CYCLE |
DAYS |
311.61 |
266.36 |
256.18 |
|
|
|
|
|
|
|
PROFITABILITY
RATIO |
|
|
|
|
|
COST OF GOODS SOLD |
% |
87.36 |
89.46 |
88.54 |
|
SELLING & ADMINISTRATION |
% |
13.59 |
12.31 |
12.98 |
|
INTEREST |
% |
- |
- |
- |
|
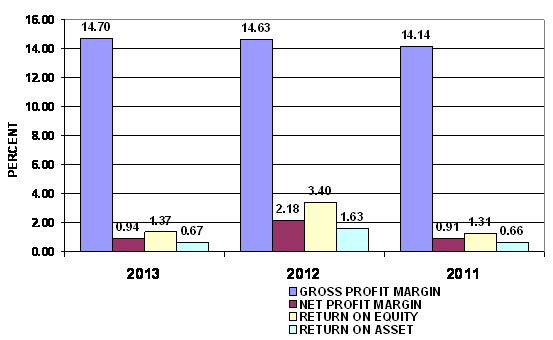
GROSS PROFIT MARGIN |
% |
14.70 |
14.63 |
14.14 |
|
NET PROFIT MARGIN BEFORE EX. ITEM |
% |
1.11 |
2.32 |
1.17 |
|
NET PROFIT MARGIN |
% |
0.94 |
2.18 |
0.91 |
|
RETURN ON EQUITY |
% |
1.37 |
3.40 |
1.31 |
|
RETURN ON ASSET |
% |
0.67 |
1.63 |
0.66 |
|
EARNING PER SHARE |
BAHT |
1.46 |
3.56 |
1.33 |
|
|
|
|
|
|
|
LEVERAGE RATIO |
|
|
|
|
|
DEBT RATIO |
TIMES |
0.51 |
0.52 |
0.49 |
|
DEBT TO EQUITY RATIO |
TIMES |
1.04 |
1.08 |
0.98 |
|
TIME INTEREST EARNED |
TIMES |
- |
- |
- |
|
|
|
|
|
|
|
ANNUAL GROWTH |
|
|
|
|
|
SALES GROWTH |
% |
(4.99) |
12.26 |
|
|
OPERATING PROFIT |
% |
(54.75) |
123.50 |
|
|
NET PROFIT |
% |
(59.01) |
168.61 |
|
|
FIXED ASSETS |
% |
2.59 |
(9.80) |
|
|
TOTAL ASSETS |
% |
(0.49) |
9.04 |
|
ANNUAL GROWTH :
RISKY
An annual sales growth is -4.99%. Turnover has decreased from THB
PROFITABILITY :
RISKY
PROFITABILITY
RATIO
|
Gross Profit Margin |
14.70 |
Acceptable |
Industrial
Average |
20.46 |
|
Net Profit Margin |
0.94 |
Deteriorated |
Industrial
Average |
6.63 |
|
Return on Assets |
0.67 |
Deteriorated |
Industrial
Average |
15.34 |
|
Return on Equity |
1.37 |
Deteriorated |
Industrial
Average |
26.91 |
Gross Profit Margin used to assess a firm's financial health by
revealing the proportion of money left over from revenues after accounting for
the cost of goods sold. Gross profit margin serves as the source for paying
additional expenses and future savings. The company's figure is 14.7%. When
compared with the industry average, the ratio of the company was lower. This
indicated that company may have problems with control over its costs.
Net Profit Margin is the indicator of the company's efficiency in that
net profit takes into consideration all expenses of the company. A low profit
margin indicates a low margin of safety, higher risk that a decline in sales
will erase profits and result in a net loss. The company's figure is 0.94%.
When compared with the industry average, the ratio of the company was lower.
Return on Assets measures how efficiently profits are being generated
from the assets employed in the business when compared with the ratios of firms
in a similar business. A low ratio in comparison with industry averages
indicates an inefficient use of business assets. When compared with the
industry average, it was lower, the
company's figure is 0.67%.
Return on Equity indicates how profitable a company is by comparing its
net income to its average shareholders' equity, ROE measures how much the
shareholders earned for their investment in the company. When compared with the
industry average, it was lower, the company's figure is 1.37%.
Trend of the
average competitors in the same industry for last 5 years
Return on Assets Uptrend
Return on Equity Uptrend
LIQUIDITY : RISKY

LIQUIDITY RATIO
|
Current Ratio |
1.53 |
Satisfactory |
Industrial
Average |
1.73 |
|
Quick Ratio |
0.45 |
|
|
|
|
Cash Conversion Cycle |
311.61 |
|
|
|
The Current Ratio is to ascertain whether a company's short-term assets
are readily available to pay off its short-term liabilities. The company's
figure is 1.53 times in 2013, increased from 1.51 times, then it is generally
considered to have good short-term financial strength. When compared with the
industry average, the ratio of the company was lower.
The Quick Ratio is a liquidity indicator that further refines the
current ratio by measuring the amount of the most liquid current assets there
are to cover current liabilities. The company's figure is 0.45 times in 2013,
decreased from 0.48 times, then the company has not enough current assets that
presumably can be quickly converted to cash for pay financial obligations.
The Cash Conversion Cycle measures the number of days a company's cash
is tied up in the production and sales process of its operations and the
benefit from payment terms from its creditors. It meant the company could
survive when no cash inflow was received from sale for 312 days.
Trend of the
average competitors in the same industry for last 5 years
Current Ratio Uptrend
LEVERAGE : RISKY


LEVERAGE RATIO
|
Debt Ratio |
0.51 |
Acceptable |
Industrial
Average |
0.41 |
|
Debt to Equity Ratio |
1.04 |
Risky |
Industrial
Average |
0.69 |
|
Times Interest Earned |
- |
|
Industrial
Average |
- |
Debt to Equity Ratio a measurement of how much suppliers, lenders,
creditors and obligors have committed to the company versus what the
shareholders have committed. A higher the percentage means that the company is
using less equity and has stronger leverage position.
Debt Ratio shows the proportion of a company's assets which are financed
through debt. The company's figure is 0.51 greater than 0.5, most of the
company's assets are financed through debt.
Trend of the
average competitors in the same industry for last 5 years
Debt Ratio Downtrend
Times Interest Earned Stable
ACTIVITY :
ACCEPTABLE

ACTIVITY RATIO
|
Fixed Assets Turnover |
3.54 |
Impressive |
Industrial
Average |
- |
|
Total Assets Turnover |
0.72 |
Deteriorated |
Industrial
Average |
2.32 |
|
Inventory Conversion Period |
318.85 |
|
|
|
|
Inventory Turnover |
1.14 |
Deteriorated |
Industrial
Average |
13.19 |
|
Receivables Conversion Period |
72.72 |
|
|
|
|
Receivables Turnover |
5.02 |
Acceptable |
Industrial
Average |
7.82 |
|
Payables Conversion Period |
79.96 |
|
|
|
The company's Account Receivable Ratio is calculated as 5.02 and
Inventory Turnover in Days Ratio indicates the liquidity of inventory.
It estimates the number of days that it will take to sell the current
inventory. Inventory is particularly sensitive to change in business
activities. The inventory turnover in days has increased from 291 days at the
end of 2012 to 319 days at the end of 2013. This represents a negative trend.
And Inventory turnover has decreased from 1.25 times in year 2012 to 1.14 times
in year 2013.
The company's Total Asset Turnover is calculated as 0.72 times and 0.75
times in 2013 and 2012 respectively. This ratio is determined by dividing total
assets into total sales turnover. The ratio measures the activity of the assets
and the ability of the firm to generate sales through the use of the assets.
Trend of the
average competitors in the same industry for last 5 years
Fixed Assets Turnover Stable
Total Assets Turnover Uptrend
Inventory Turnover Uptrend
Receivables Turnover Uptrend
FOREIGN EXCHANGE RATES
|
Currency |
Unit
|
Indian Rupees |
|
US Dollar |
1 |
Rs.60.47 |
|
|
1 |
Rs.100.35 |
|
Euro |
1 |
Rs.79.86 |
INFORMATION DETAILS
|
Analysis Done by
: |
KAR |
|
|
|
|
Report Prepared
by : |
SMN |
RATING EXPLANATIONS
|
RATING |
STATUS |
PROPOSED CREDIT LINE |
|
|
>86 |
Aaa |
Possesses an extremely sound financial base with the strongest
capability for timely payment of interest and principal sums |
Unlimited |
|
71-85 |
Aa |
Possesses adequate working capital. No caution needed for credit
transaction. It has above average (strong) capability for payment of interest
and principal sums |
Large |
|
56-70 |
A |
Financial & operational base are regarded healthy. General
unfavourable factors will not cause fatal effect. Satisfactory capability for
payment of interest and principal sums |
Fairly Large |
|
41-55 |
Ba |
Overall operation is considered normal. Capable to meet normal
commitments. |
Satisfactory |
|
26-40 |
B |
Capability to overcome financial difficulties seems comparatively
below average. |
Small |
|
11-25 |
Ca |
Adverse factors are apparent. Repayment of interest and principal sums
in default or expected to be in default upon maturity |
Limited with
full security |
|
<10 |
C |
Absolute credit risk exists. Caution needed to be exercised |
Credit not
recommended |
|
-- |
NB |
New Business |
-- |
This score serves as a reference to assess SC’s credit risk
and to set the amount of credit to be extended. It is calculated from a
composite of weighted scores obtained from each of the major sections of this
report. The assessed factors and their relative weights (as indicated through
%) are as follows:
Financial
condition (40%) Ownership
background (20%) Payment record
(10%)
Credit history
(10%) Market trend
(10%) Operational
size (10%)
This report is issued at your request without any
risk and responsibility on the part of MIRA INFORM PRIVATE LIMITED (MIPL)
or its officials.