MIRA
INFORM REPORT
|
Report Date : |
02.09.2014 |
IDENTIFICATION DETAILS
|
Name : |
KNORR-BREMSE AUSTRALIA PTY LIMITED |
|
|
|
|
Registered Office : |
|
|
|
|
|
Country : |
|
|
|
|
|
Financials (as on) : |
31.12.2013 |
|
|
|
|
Date of Incorporation : |
20.04.2000 |
|
|
|
|
Com. Reg. No.: |
Australian Company Number: 092562671 |
|
|
|
|
Legal Form : |
Australian Proprietary Company, Limited by Shares |
|
|
|
|
Line of Business : |
The Subject engages in import, manufacturing, assembly and
wholesale distribution of railway and commercial vehicle brake systems, door components
and heating, ventilation, and air conditioning (HVAC) systems |
|
|
|
|
No. of Employees : |
172 |
RATING & COMMENTS
|
MIRA’s Rating : |
Ba |
|
RATING |
STATUS |
PROPOSED CREDIT LINE |
|
|
41-55 |
Ba |
Overall operation is considered normal. Capable to meet normal
commitments. |
Satisfactory |
|
Status : |
Satisfactory |
|
Payment Behaviour : |
No complaints |
|
Litigation : |
Clear |
NOTES :
Any query related to this report can be made
on e-mail : infodept@mirainform.com
while quoting report number, name and date.
ECGC Country Risk Classification List – June 01, 2014
|
Country Name |
Previous Rating (31.03.2014) |
Current Rating (01.06.2014) |
|
Australia |
A1 |
A1 |
|
Risk Category |
ECGC
Classification |
|
Insignificant |
A1 |
|
Low Risk |
A2 |
|
Moderate Low Risk |
B1 |
|
Moderate Risk |
B2 |
|
Moderate High Risk |
C1 |
|
High Risk |
C2 |
|
Very High Risk |
D |
AUSTRALIA - ECONOMIC OVERVIEW
The Australian economy has
experienced continuous growth and features low unemployment, contained
inflation, very low public debt, and a strong and stable financial system. By
2012, Australia had experienced more than 20 years of continued economic
growth, averaging 3.5% a year. Demand for resources and energy from Asia and
especially China has grown rapidly, creating a channel for resources
investments and growth in commodity exports. The high Australian dollar has
hurt the manufacturing sector, while the services sector is the largest part of
the Australian economy, accounting for about 70% of GDP and 75% of jobs.
Australia was comparatively unaffected by the global financial crisis as the
banking system has remained strong and inflation is under control. Australia
has benefited from a dramatic surge in its terms of trade in recent years,
stemming from rising global commodity prices. Australia is a significant
exporter of natural resources, energy, and food. Australia's abundant and diverse
natural resources attract high levels of foreign investment and include
extensive reserves of coal, iron, copper, gold, natural gas, uranium, and
renewable energy sources. A series of major investments, such as the US$40
billion Gorgon Liquid Natural Gas project, will significantly expand the
resources sector. Australia is an open market with minimal restrictions on
imports of goods and services. The process of opening up has increased
productivity, stimulated growth, and made the economy more flexible and
dynamic. Australia plays an active role in the World Trade Organization, APEC,
the G20, and other trade forums. Australia has bilateral free trade agreements
(FTAs) with Chile, Malaysia, New Zealand, Singapore, Thailand, and the US, has
a regional FTA with ASEAN and New Zealand, is negotiating agreements with
China, India, Indonesia, Japan, and the Republic of Korea, as well as with its
Pacific neighbors and the Gulf Cooperation Council countries, and is also
working on the Trans-Pacific Partnership Agreement with Brunei Darussalam,
Canada, Chile, Malaysia, Mexico, New Zealand, Peru, Singapore, the US, and
Vietnam
|
Source
: CIA |
CORPORATE DETAILS
|
Verified
Address |
|
Subject name |
Registered address |
SUMMARY DETAILS
|
Report
Summary |
|
Date registered |
Paid-up capital |
STATUTORY DETAILS
|
Registry
Information |
|
Date registered |
Statutory status |
BOARD OF MANAGEMENT
|
Key
Personnel |
|
Name |
|
BOARD OF DIRECTORS
|
Appointments |
|
Name |
Staff employed |
|
Other
Appointments |
|
Auditor |
|
SHARE CAPITAL
|
Composition |
|
Authorized capital |
Paid-up capital |
OWNERSHIP / SHAREHOLDERS
|
Composition |
|
Shareholder name |
|
CORPORATE AFFILIATIONS AND RELATED COMPANIES
|
Structure |
|
Company name |
Remarks on corporate affiliations and related companies |
BANK AND MORTGAGES
|
Bank
Details |
|
Name of bank |
Comments |
|
Mortgages |
|
None reported. |
|
|
Legal
Filings |
|
Bankruptcy filings |
Tax liens |
FINANCIAL STATISTICS
|
Description |
|
Financial statement source |
Currency of financial statement |
|
Concise
Financial Data |
Consolidation
style |
Non Consolidated |
Non Consolidated |
Group Consolidated |
|
|
Currency |
Australia Dollar (AUD) |
Australia Dollar (AUD) |
Euro (EUR) |
|
|
Date
of financial year end |
31/12/13 |
31/12/12 |
31/12/13 |
|
|
Length
of financial accounts |
12 months |
12 months |
12 months |
|
|
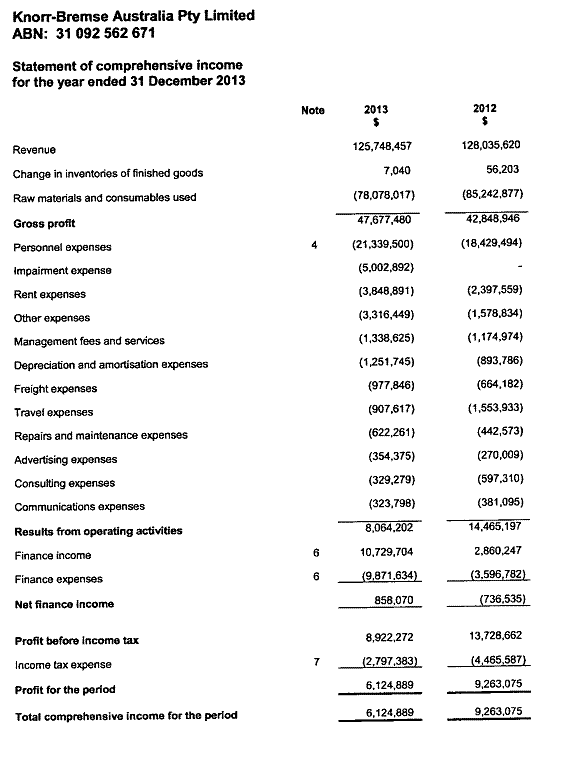
Sales
turnover / Revenue / Income |
125,748,457.00 |
128,035,620.00 |
4,302,682,000.00 |
|
|
Gross
profit |
47,078,017.00 |
85,242,877.00 |
|
|
|
Profit
/ Loss before tax |
8,922,272.00 |
13,728,662.00 |
547,628,000.00 |
|
|
Net
income / loss |
6,124,889.00 |
9,263,075.00 |
366,704,000.00 |
|
|
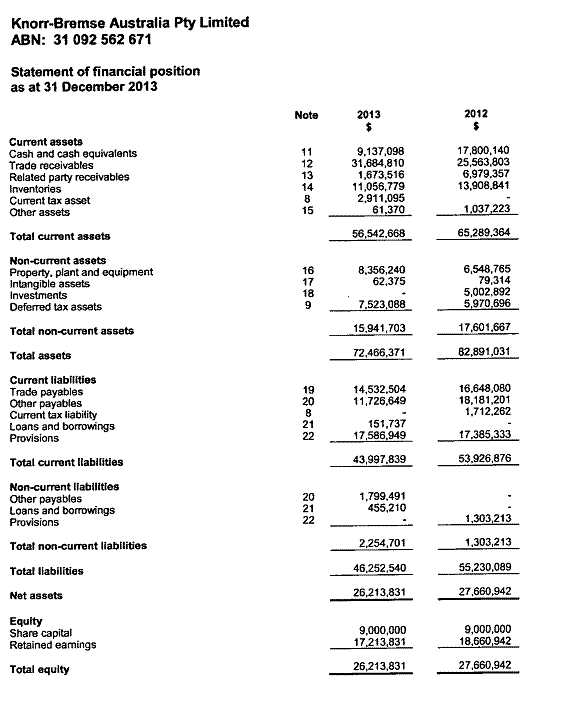
Non-current
assets |
15,941,703.00 |
17,601,667.00 |
913,825,000.00 |
|
|
Property,
plant and equipment |
8,356,240.00 |
6,548,765.00 |
642,562,000.00 |
|
|
Current
assets |
56,524,668.00 |
65,289,364.00 |
1,955,243,000.00 |
|
|
Inventories |
11,056,779.00 |
13,908,841.00 |
279,342,000.00 |
|
|
Cash
and cash equivalents |
9,137,098.00 |
17,800,140.00 |
806,386,000.00 |
|
|
Accounts
receivable |
31,684,810.00 |
25,563,803.00 |
758,261,000.00 |
|
|
Total
assets |
72,466,371.00 |
82,891,031.00 |
2,869,068,000.00 |
|
|
Current
liabilities |
43,997,839.00 |
53,926,876.00 |
779,294,000.00 |
|
|
Non-current
liabilities |
2,254,701.00 |
1,303,213.00 |
982,937,000.00 |
|
|
Accounts
payable |
14,532,504.00 |
16,648,080.00 |
693,425,000.00 |
|
|
Total
liabilities |
46,252,540.00 |
55,230,089.00 |
1,762,231,000.00 |
|
|
Share
equity |
26,213,831.00 |
27,660,942.00 |
1,106,837,000.00 |
|
|
Retained
earnings |
17,213,831.00 |
18,660,942.00 |
584,599,000.00 |
|
Remarks |
|
The non-consolidated financial statement above relates
only to the Subject. The group consolidated financial statement above relates
to the Subject's Ultimate Holding Company Knorr-Bremse AG. and all its
subsidiaries. |
BUSINESS DETAILS
|
Operational
Details |
|
Main activities |
|
Purchases |
|
|
International |
|
Sales |
|
Local |
International |
|
|
|
Key events |
|
Business
Facilities and Assets |
|
Premises |
Branches |
SUMMARIZED COUNTRY RISK
|
Gross
Domestic Products (GDP) and Economic Overview |
|
Central bank |
Public debt (general Government gross debt as percentage (%) of
GDP) |
|
Trade
and Competitiveness Overview |
|
Total exports |
Major export partners |
|
Country
and Population Overview |
|
Total population |
Currency |
PAYMENT OUTLOOK
|
Purchases
Term |
|
|
International |
|
Sales
Term |
|
Local |
International |
|
Trade
Reference / Payment Behaviour |
|
Comments |
|
|
Investigation
Note |
|
Sources |
KEY FINANCIAL RATIOS
|
For
financial year end |
31/12/13 |
31/12/12 |
. |
|
Profitability |
. |
. |
. |
|
Gross profit (loss) margin (%) |
37.44 |
66.58 |
|
|
Pre-tax profit (loss) margin (%) |
7.10 |
10.72 |
|
|
Net profit (loss) margin (%) |
4.87 |
7.23 |
|
|
Earnings per share (currency based on financial statement) |
0.68 |
1.03 |
|
|
Return
on Invested Capital |
. |
. |
. |
|
Return on assets (%) |
8.45 |
11.18 |
|
|
Return on equity (%) |
23.37 |
33.49 |
|
|
Liquidity |
. |
. |
. |
|
Current ratio |
1.29 |
1.21 |
|
|
Quick ratio |
1.03 |
0.95 |
|
|
Cash ratio |
0.16 |
0.27 |
|
|
Accounts receivable turnover ratio (times) |
3.97 |
5.01 |
|
|
Accounts payable turnover ratio (times) |
8.65 |
7.69 |
|
|
Collection period (days) |
91.97 |
72.88 |
|
|
Payment period (days) |
42.18 |
47.46 |
|
|
Inventory turnover ratio (times) |
11.37 |
9.21 |
|
|
Inventory conversion period (days) |
32.09 |
39.65 |
|
|
Asset
Management |
. |
. |
. |
|
Fixed asset turnover ratio (times) |
15.05 |
19.55 |
|
|
Asset turnover ratio (times) |
1.74 |
1.54 |
|
|
Capital
Structure and Solvency |
. |
. |
. |
|
Total debt to asset ratio (%) |
63.83 |
66.63 |
|
|
Total debt to equity ratio (%) |
176.44 |
199.67 |
|
|
Non-current debt to equity ratio (%) |
8.60 |
4.71 |
|
FOREIGN EXCHANGE RATES
|
Currency |
Unit
|
Indian Rupees |
|
US Dollar |
1 |
Rs.60.47 |
|
|
1 |
Rs.100.42 |
|
Euro |
1 |
Rs.79.39 |
INFORMATION DETAILS
|
Analysis Done by
: |
RAS |
|
|
|
|
Report Prepared
by : |
PDT |
RATING EXPLANATIONS
|
RATING |
STATUS |
PROPOSED CREDIT LINE |
|
|
|
>86 |
Aaa |
Possesses an extremely sound financial base with the strongest
capability for timely payment of interest and principal sums |
Unlimited |
|
|
71-85 |
Aa |
Possesses adequate working capital. No caution needed for credit
transaction. It has above average (strong) capability for payment of interest
and principal sums |
Large |
|
|
56-70 |
A |
Financial & operational base are regarded healthy. General
unfavourable factors will not cause fatal effect. Satisfactory capability for
payment of interest and principal sums |
Fairly Large |
|
|
41-55 |
Ba |
Overall operation is considered normal. Capable to meet normal
commitments. |
Satisfactory |
|
|
26-40 |
B |
Capability to overcome financial difficulties seems comparatively below
average. |
Small |
|
|
11-25 |
Ca |
Adverse factors are apparent. Repayment of interest and principal sums
in default or expected to be in default upon maturity |
Limited with
full security |
|
|
<10 |
C |
Absolute credit risk exists. Caution needed to be exercised |
Credit not
recommended |
|
|
-- |
NB |
New Business |
-- |
|
This score serves as a reference to assess SC’s credit risk and
to set the amount of credit to be extended. It is calculated from a composite
of weighted scores obtained from each of the major sections of this report. The
assessed factors and their relative weights (as indicated through %) are as
follows:
Financial
condition (40%) Ownership
background (20%) Payment
record (10%)
Credit history
(10%) Market trend
(10%) Operational
size (10%)
This report is issued at your request without any
risk and responsibility on the part of MIRA INFORM PRIVATE LIMITED (MIPL)
or its officials.