MIRA
INFORM REPORT
|
Report Date : |
05.09.2014 |
IDENTIFICATION DETAILS
|
Name : |
ALAM B.V. |
|
|
|
|
Registered Office : |
Standaardruiter 40 3905PZ Veenendaal |
|
|
|
|
Country : |
|
|
|
|
|
Financials (as on) : |
31.12.2012 |
|
|
|
|
Date of Incorporation : |
10.05.1989 |
|
|
|
|
Com. Reg. No.: |
30089588 |
|
|
|
|
Legal Form : |
Private Company |
|
|
|
|
Line of Business : |
Wholesale of clothing textiles and
haberdashery (46411) |
|
|
|
|
No. of Employees |
3 |
RATING & COMMENTS
|
MIRA’s Rating : |
Ca |
|
RATING |
STATUS |
PROPOSED CREDIT LINE |
|
|
11-25 |
Ca |
Adverse factors are apparent. Repayment of interest and principal sums
in default or expected to be in default upon maturity |
Limited with
full security |
|
Status : |
Moderate |
|
|
|
|
Payment Behaviour : |
Slow |
|
|
|
|
Litigation : |
Clear |
NOTES :
Any query related to this report can be made
on e-mail : infodept@mirainform.com
while quoting report number, name and date.
ECGC Country Risk Classification List – June 1, 2014
|
Country Name |
Previous Rating (31.03.2014) |
Current Rating (01.06.2014) |
|
Netherland |
A1 |
A1 |
|
Risk Category |
ECGC
Classification |
|
Insignificant |
A1 |
|
Low |
A2 |
|
Moderate |
B1 |
|
High |
B2 |
|
Very High |
C1 |
|
Restricted |
C2 |
|
Off-credit |
D |
NETHERLAND ECONOMIC OVERVIEW
|
Source
: CIA |
Summary
Company name ALAM B.V.
Operative address Standaardruiter 40
3905PZ Veenendaal
Legal form Private Company
Registration number 30089588
VAT-number 007943866
|
Year |
2012 |
Mutation |
2011 |
Mutation |
2010 |
|
Fixed
assets |
798.855 |
-0,95 |
806.526 |
-4,38 |
843.456 |
|
Total
receivables |
180.099 |
-90,08 |
1.815.919 |
625,32 |
250.360 |
|
Total equity |
-316.961 |
-25,68 |
-252.201 |
-94,41 |
-129.727 |
|
Short term
liabilities |
606.378 |
-31,13 |
880.524 |
4,44 |
843.085 |
|
Working
capital |
806.192 |
-13,81 |
935.395 |
2,13 |
915.880 |
|
Quick ratio |
0,30 |
-85,44 |
2,06 |
586,67 |
0,30 |
Contact information
Company name Alam B.V.
Trade names Alam B.V.
Chenab
Nishat
Operative address Standaardruiter 40
3905PZ Veenendaal
Correspondence address Standaardruiter 40
3905PZ Veenendaal
Telephone number 0318552901
Website www.dekbedovertrek.com
Registration
Registration number 30089588
Branch number 000002296268
VAT-number 007943866
Status Active
First registration company register 1989-06-23
Memorandum 1989-06-16
Establishment date 1989-05-10
Legal form Private Company
Last proposed admendment 1992-03-31
Activities
SBI Wholesale of clothing textiles and haberdashery (46411)
Exporter No
Importer No
Goal Textiel groothandel
Relations
Companies on same address Nastex B.V.
Registration number: 598317150000
Management
Active management A. Alam (Azeem)
Competence: Fully authorized
Function: Manager
Starting date: 1989-06-16
Date of birth: 1950-06-13, Naseera Gujrat, PK
A. Alam (Amir)
Competence: Fully authorized
Function: Manager
Starting date: 2004-01-01
Date of birth: 1973-11-06,
A.N. Alam - Khan
(Azra Nahid)
Competence: Fully authorized
Function: Manager
Starting date: 1989-06-16
Date of birth: 1952-03-15,
Employees
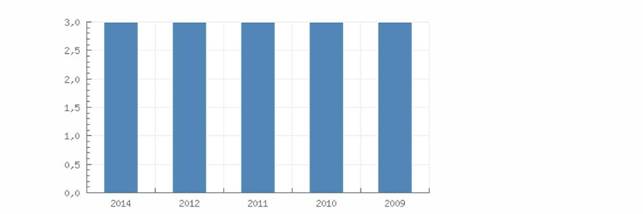
Total according to the Chamber of Commerce 3
Year 2014 2012
2011 2010 2009
Total 3
3 3 3 3
Payments
|
Score Description |
6,85 The payments are regular |
|
|
|
|
Key Figures
|
Year |
2012 |
2011 |
2010 |
2009 |
2008 |
|
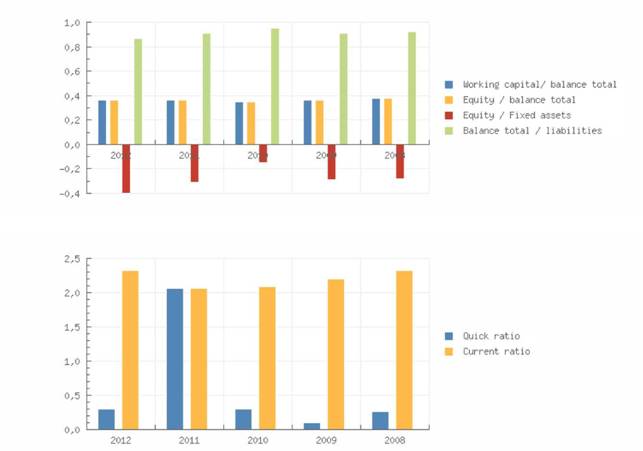
Quick ratio |
0,30 |
2,06 |
0,30 |
0,10 |
0,26 |
|
Current
ratio |
2,33 |
2,06 |
2,09 |
2,20 |
2,33 |
|
|
|||||
|
Working capital/
balance total |
0,36 |
0,36 |
0,35 |
0,36 |
0,38 |
|
Equity /
balance total |
-0,14 |
-0,10 |
-0,05 |
-0,10 |
-0,09 |
|
Equity /
Fixed assets |
-0,40 |
-0,31 |
-0,15 |
-0,29 |
-0,28 |
|
Equity /
liabilities |
-0,13 |
-0,09 |
-0,05 |
-0,09 |
-0,08 |
|
Balance
total / liabilities |
0,87 |
0,91 |
0,95 |
0,91 |
0,92 |
|
Year |
2012 |
2011 |
2010 |
2009 |
2008 |
|
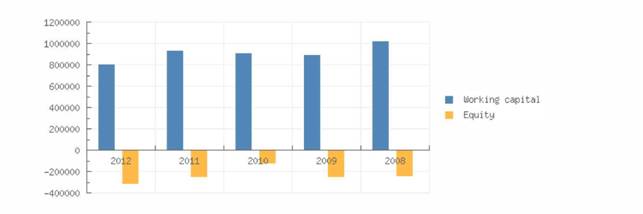
Working
capital |
806.192 |
935.395 |
915.880 |
894.265 |
1.027.897 |
|
Equity |
-316.961 |
-252.201 |
-129.727 |
-257.851 |
-246.641 |
|
Mutation
equity |
-25,68 |
-94,41 |
49,69 |
-4,55 |
17,42 |
|
Mutation
short term liabilities |
-31,13 |
4,44 |
12,82 |
-3,23 |
-22,63 |
Summary The 2012 financial result structure is a postive working captial of 806.192
euro, which is in agreement with 36 % of the total assets of the company.
The working
capital has diminished with -13.81 % compared to previous year. The ratio with
respect to the total assets of the company remains unchanged.
The deterioration
between 2011 and 2012 has mainly been caused by a reduction of the current
assets.
The current ratio
of the company in 2012 was 2.33. A company with a current ratio between 1.5 and
3.0 generally indicates good short-term financial strength.
The quick ratio in
2012 of the company was 0.3. A company with a Quick Ratio of less than 1 cannot
currently pay back its current liabilities.
The 2011 financial
result structure is a postive working captial of 935.395 euro, which is in
agreement with 36 % of the total assets of the company.
The working
capital has increased with 2.13 % compared to previous year. The ratio, with
respect to the total assets of the company has however, increased.
The improvement
between 2010 and 2011 has mainly been caused by a current liabilities
reduction.
The current ratio
of the company in 2011 was 2.06. A company with a current ratio between 1.5 and
3.0 generally indicates good short-term financial strength.
The quick ratio in
2011 of the company was 2.06. A company with a Quick Ratio of more than 1 can
currently pay back its current liabilities.
Financial statement
Remark annual account The company is obliged to file its financial statements.
Type of annual account Corporate
Annual account Alam B.V.
Standaardruiter 40
3905PZ Veenendaal
Registration number: 300895880000
Balance
|
Year |
2012 |
2011 |
2010 |
2009 |
2008 |
|
End date |
2012-12-31 |
2011-12-31 |
2010-12-31 |
2009-12-31 |
2008-12-31 |
|
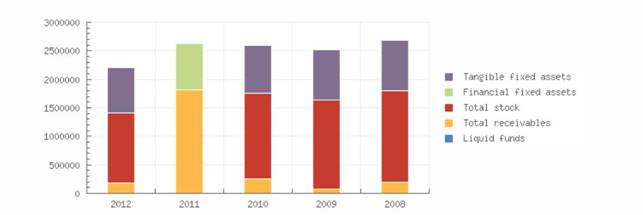
Tangible
fixed assets |
798.855 |
|
843.456 |
876.270 |
888.998 |
|
Financial
fixed assets |
|
806.526 |
|
||
|
Fixed
assets |
798.855 |
806.526 |
843.456 |
876.270 |
888.998 |
|
Total stock |
1.232.429 |
|
1.503.428 |
1.564.274 |
1.601.751 |
|
Total
receivables |
180.099 |
1.815.919 |
250.360 |
77.232 |
198.346 |
|
Liquid
funds |
42 |
|
5.177 |
28 |
28 |
|
Current
assets |
1.412.570 |
1.815.919 |
1.758.965 |
1.641.534 |
1.800.125 |
|
Total
assets |
2.211.425 |
2.622.445 |
2.602.421 |
2.517.804 |
2.689.123 |
|
|
|||||
|
Issued
capital |
18.151 |
18.151 |
18.151 |
18.151 |
18.151 |
|
Other
reserves |
-335.111 |
-270.351 |
-147.878 |
-276.002 |
-264.791 |
|
Total
reserves |
-335.111 |
-270.351 |
-147.878 |
-276.002 |
-264.791 |
|
Total
equity |
-316.961 |
-252.201 |
-129.727 |
-257.851 |
-246.641 |
|
|
|||||
|
Provisions |
79.858 |
79.858 |
79.858 |
79.858 |
79.858 |
|
Long term
interest yielding debt |
1.842.149 |
1.914.263 |
1.809.205 |
1.948.528 |
2.083.677 |
|
Long term
liabilities |
1.842.149 |
1.914.263 |
1.809.205 |
1.948.528 |
2.083.677 |
|
Short term liabilities |
606.378 |
880.524 |
843.085 |
747.269 |
772.228 |
|
Total short
and long term liabilities |
2.528.385 |
2.874.645 |
2.732.148 |
2.775.655 |
2.935.763 |
|
Total
liabilities |
2.211.425 |
2.622.445 |
2.602.421 |
2.517.804 |
2.689.123 |
Summary The total assets of the company decreased with -15.67 % between 2011 and
2012.
The total assets
are entirely composed of current assets.
Assets reduction
is explained by a Net Worth decrease of -25.68 %, and an indebtedness reduction
of -12.05 %.
In 2012 the assets
of the company were 36.12 % composed of fixed assets and 63.88 % by current
assets. The assets are being financed by an equity of -14.33 %, and total debt
of 114.33 %.
The total assets
remained the same between 2010 and 2011.
Despite the fact
that the total assets remained the same, the fixed assets decreased with -4.38
%.
Despite the
unchanged assets the net worth declined with -94.41 %, which has resulted in
the fact that the company's indebtedness increased with 5.22 %.
In 2011 the assets
of the company were 30.75 % composed of fixed assets and 69.25 % by current
assets. The assets are being financed by an equity of -9.62 %, and total debt
of 109.62 %.
Analysis
Branch (SBI) Wholesale trade (no motor vehicles and motorcycles) (46)
Region Oostelijk Utrecht
In the
In the region
Oostelijk Utrecht 4173 of the companies are registered with the SBI code 46
In the
In the region
Oostelijk Utrecht 61 of the bankruptcies are published within this sector
The risk of this
specific sector in the
The risk of this
specific sector in the region Oostelijk Utrecht is normal
Publications
Filings 13-08-2013: De jaarrekening over 2012 is gepubliceerd.
06-05-2013: De
jaarrekening over 2011 is gepubliceerd.
08-07-2011: De
jaarrekening over 2010 is gepubliceerd.
23-08-2010: De
jaarrekening over 2009 is gepubliceerd.
Functions 07-03-2013: Per 04-02-2013 is bestuurder Muhammed Naeem uit functie
getreden.
FOREIGN EXCHANGE RATES
|
Currency |
Unit
|
Indian Rupees |
|
US Dollar |
1 |
Rs.60.45 |
|
|
1 |
Rs.99.46 |
|
Euro |
1 |
Rs.79.46 |
INFORMATION DETAILS
|
Analysis Done by
: |
RAS |
|
|
|
|
Report Prepared
by : |
SDA |
RATING EXPLANATIONS
|
RATING |
STATUS |
PROPOSED CREDIT LINE |
|
|
|
>86 |
Aaa |
Possesses an extremely sound financial base with the strongest capability
for timely payment of interest and principal sums |
Unlimited |
|
|
71-85 |
Aa |
Possesses adequate working capital. No caution needed for credit
transaction. It has above average (strong) capability for payment of interest
and principal sums |
Large |
|
|
56-70 |
A |
Financial & operational base are regarded healthy. General
unfavourable factors will not cause fatal effect. Satisfactory capability for
payment of interest and principal sums |
Fairly Large |
|
|
41-55 |
Ba |
Overall operation is considered normal. Capable to meet normal
commitments. |
Satisfactory |
|
|
26-40 |
B |
Capability to overcome financial difficulties seems comparatively
below average. |
Small |
|
|
11-25 |
Ca |
Adverse factors are
apparent. Repayment of interest and principal sums in default or expected to
be in default upon maturity |
Limited with full security |
|
|
<10 |
C |
Absolute credit risk exists. Caution needed to be exercised |
Credit not
recommended |
|
|
-- |
NB |
New Business |
-- |
|
This score serves as a reference to assess SC’s credit risk
and to set the amount of credit to be extended. It is calculated from a
composite of weighted scores obtained from each of the major sections of this report.
The assessed factors and their relative weights (as indicated through %) are as
follows:
Financial
condition (40%) Ownership
background (20%) Payment
record (10%)
Credit history
(10%) Market trend
(10%) Operational
size (10%)
This report is issued at your request without any
risk and responsibility on the part of MIRA INFORM PRIVATE LIMITED (MIPL)
or its officials.