MIRA INFORM REPORT
|
Report Date : |
08.09.2014 |
IDENTIFICATION DETAILS
|
Name : |
NITIN SPINNERS LIMITED |
|
|
|
|
Registered
Office : |
16-17 K.M. Stone, |
|
|
|
|
Country : |
|
|
|
|
|
Financials (as
on) : |
31.03.2014 |
|
|
|
|
Date of
Incorporation : |
15.10.1992 |
|
|
|
|
Com. Reg. No.: |
17-006987 |
|
|
|
|
Capital
Investment / Paid-up Capital : |
Rs. 458.339 Millions |
|
|
|
|
CIN No.: [Company Identification
No.] |
L17111RJ1992PLC006987 |
|
|
|
|
TAN No.: [Tax Deduction &
Collection Account No.] |
JDHN01149B |
|
|
|
|
PAN No.: [Permanent Account No.] |
AAACN7529A |
|
|
|
|
Legal Form : |
A Public Limited Liability Company. The Company’s Shares are Listed on
the Stock Exchanges. |
|
|
|
|
Line of Business
: |
Manufacturing
of Cotton Yarn and Knitted Fabric. |
|
|
|
|
No. of Employees
: |
1549 (Approximately) |
RATING & COMMENTS
|
MIRA’s Rating : |
Ba (51) |
|
RATING |
STATUS |
PROPOSED CREDIT LINE |
|
|
41-55 |
Ba |
Overall operation is considered normal. Capable to meet normal
commitments. |
Satisfactory |
|
Maximum Credit Limit : |
USD 5260000 |
|
|
|
|
Status : |
Good |
|
|
|
|
Payment Behaviour : |
Regular |
|
|
|
|
Litigation : |
Clear |
|
|
|
|
Comments : |
Subject is an established company having fine track record. Financial position of the company seems to be decent. Trade relations are reported as fair. Business is active. Payment
terms reported to be regular and as per commitment. The company can be considered normal for business dealings at usual
trade terms and conditions. |
NOTES :
Any query related to this report can be made
on e-mail : infodept@mirainform.com
while quoting report number, name and date.
ECGC Country Risk Classification List – June 1, 2014
|
Country Name |
Previous Rating (31.03.2014) |
Current Rating (01.06.2014) |
|
India |
A1 |
A1 |
|
Risk Category |
ECGC Classification |
|
Insignificant |
A1 |
|
Low |
A2 |
|
Moderate |
B1 |
|
High |
B2 |
|
Very High |
C1 |
|
Restricted |
C2 |
|
Off-credit |
D |
INDIAN ECONOMIC OVERVIEW
N E W S
As per the latest IMF study, the total weigh of emerging markets in the
GDP of the world on a purchasing power parity basis has seen a sizeable shift.
It highlights how as against 51 % in 2005, the emerging economies now account
for close to 56 % of the global purchasing power GDP as per the latest survey.
And with the emerging economies growing at a faster rate than their developed
counterparts, there are every possibility that the their share goes up further
in the coming years. China may surpass the US over the next few years.
Politics and economics are very intricately connected. They tend to
influence each other in ways that could be very complex and far-reaching. The
prospects of the India’s economy have been seriously compromised due to
political corruption. High inflation, poor standard of living are to a great
extent a result of rampant corruption in the country. China on the other hand,
seems to be facing diametrically opposite challenge. American hedge fund
manager Jim Chanos has been keenly following the political and economic
development in the dragon economy and has figured out something that is quite
worrying. He is of the view that the Chinese economy could be heading toward
trouble on account of new Chinese President Xi Jingping’s very aggressive
anti-corruption drive. Chanos believes that many things such as apartment
sales, luxury products, etc. were largely bought with dirty money. And it is
now beginning to impact consumption. This may indeed be bad news for an economy
that is struggling to transition from an investment-driven export-oriented
economy to a domestic consumption-driven economy.
A study published by Firstpost has revealed that asset classes like real
estate and equities were the biggest beneficiaries of the liberalization policies.
A firm called Ciane Analytics studied returns from assets including
equities, gold, fixed deposits, G-Secs and real estate since 1991. Real estate
outperformed every other asset classes during the 23-year period with an
annualized return of 20 % ! Equities came in second with annualized return of
15.5 % ! However, while these returns may seem mouthwatering, the fact is that
the return from equities adjusted for inflation came down to just 7.1 %.
Some brief news are as under
. R-Power to buy Jaypee’s hydro assets
. Investors await justice in NSEL case
. India seeks MFN status from Pakistan ahead of meeting
. Ukrain’s clashes with rebels hinder MH17 crash investigation
. India exploring merger of state-owned hydro PSUs
..Higher costs weigh down profit growth to slowest in 9 quarters
..Wal-Mart to expand wholesale business in India
. GMR group moves to strengthen balance sheet
. Central Bank to sell 4 % stake to Life Insurance Corporation
. Tata Chemicals plans to raise up to Rs 10000 mn.
EXTERNAL AGENCY RATING
|
Rating Agency Name |
CARE |
|
Rating |
Long term bank facilities = BBB |
|
Rating Explanation |
Have moderate degree of safety and carry
moderate credit risk. |
|
Date |
August 14, 2014 |
|
Rating Agency Name |
CARE |
|
Rating |
Short term bank facilities = A3+ |
|
Rating Explanation |
Have moderate degree of safety and carry
higher credit risk. |
|
Date |
August 14, 2014 |
RBI DEFAULTERS’ LIST STATUS
Subject’s name is not enlisted as a defaulter in
the publicly available RBI Defaulters’ list.
EPF (Employee Provident Fund) DEFAULTERS’ LIST STATUS
Subject’s name is not enlisted as a defaulter
in the publicly available EPF (Employee Provident Fund) Defaulters’ list as of
31-03-2014.
INFORMATION DENIED
MANAGEMENT NON-COOPERATIVE
(CONTACT NO.: 91-1482-286110)
LOCATIONS
|
Registered Office/ Factory 1 : |
16-17 K.M. Stone, Chittor Road, Hamirgarh, Bhilwara - 311001,
Rajasthan, India |
|
Tel. No.: |
91- 1482-286110-113 |
|
Fax No.: |
91-1482-286114/286117 |
|
E-Mail : |
|
|
Website : |
|
|
|
|
|
Factory 2 : |
E-2/3
, Ansa Indussstrial Estate, Saki Vihar Road, Saki Naka, Andheri (East),
Mumbai – 400072, Maharashtra, India |
|
Tel. No.: |
91-22-28470652, 28470653 |
|
Fax No.: |
91-22-28475207 |
DIRECTORS
AS ON 31.03.2014
|
Name : |
Mr. R. L. Nolkha |
|
Designation : |
Chairman and Managing Director |
|
|
|
|
Name : |
Mr. Dinesh Nolkha |
|
Designation : |
Managing Director |
|
|
|
|
Name : |
Mr. Bhagwan Ram |
|
Designation : |
Director |
|
Date of Birth : |
03.08.1933 |
|
Date of Appointment
: |
15.05.2001 |
|
Qualifications : |
Graduate from University of Paris and University of Paris and Georgetown, PG Diploma in Economics and Finance IAS (Rtd.) |
|
|
|
|
Name : |
Mr. Y. R. Shah |
|
Designation : |
Director |
|
Date of Birth : |
31.08.1942 |
|
Date of Appointment
: |
24.02.2005 |
|
Qualifications : |
B.E.(Text) |
|
|
|
|
Name : |
Mr. Nitin Nolkha |
|
Designation : |
Executive Director |
|
|
|
|
Name : |
Mr. S. K. Chaturvedi (w.e.f. 29.06.2013) |
|
Designation : |
Nominee Director |
KEY EXECUTIVES
|
Name : |
Mr. Sudhir Garg |
|
Designation : |
Company Secretary and General Manager (Legal) |
|
|
|
|
Name : |
Mr. P. Maheshwari |
|
Designation : |
Vice President (Finance) |
|
|
|
|
Name : |
Mr. Sandeep Kumar |
|
Designation : |
Vice President (Technical) |
|
|
|
|
Name : |
Mr. K. L. Pareek |
|
Designation : |
General Manager (P and A) |
|
|
|
|
Name : |
Mr. Ratnesh Kumar |
|
Designation : |
General Manager (Rotor Spinning) |
|
|
|
|
Name : |
Mr. Tarun Sahu |
|
Designation : |
General Manager (Engineering) |
|
|
|
|
Name : |
Mr. Umesh Toshniwal |
|
Designation : |
General Manager (Marketing) |
|
|
|
|
Name : |
Mr. S. S. Ranka |
|
Designation : |
General Manager (TPP) |
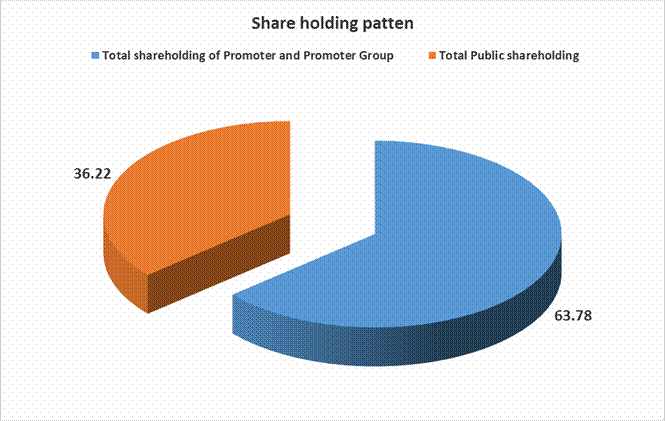
MAJOR SHAREHOLDERS / SHAREHOLDING PATTERN
AS ON 30.06.2014
|
Category of
Shareholder |
Total No. of Shares |
% of Total No. of Shares |
|
(A) Shareholding of Promoter
and Promoter Group |
|
|
|
|
|
|
|
|
12533827 |
27.35 |
|
|
16700000 |
36.44 |
|
|
29233827 |
63.78 |
|
|
|
|
|
Total shareholding of Promoter
and Promoter Group (A) |
29233827 |
63.78 |
|
(B) Public Shareholding |
|
|
|
|
|
|
|
|
393029 |
0.86 |
|
|
393029 |
0.86 |
|
|
|
|
|
|
2495170 |
5.44 |
|
|
|
|
|
|
8127705 |
17.73 |
|
|
5253669 |
11.46 |
|
|
330545 |
0.72 |
|
|
107497 |
0.23 |
|
|
221548 |
0.48 |
|
|
1500 |
0.00 |
|
|
16207089 |
35.36 |
|
Total Public shareholding (B) |
16600118 |
36.22 |
|
Total (A)+(B) |
45833945 |
100.00 |
|
(C) Shares held by Custodians
and against which Depository Receipts have been issued |
|
|
|
|
0 |
0.00 |
|
|
0 |
0.00 |
|
|
0 |
0.00 |
|
Total (A)+(B)+(C) |
45833945 |
100.00 |
BUSINESS DETAILS
|
Line of Business : |
Manufacturing
of Cotton Yarn and Knitted Fabric. |
|
|
|
|
Exports : |
Not
Divulged |
|
|
|
|
Imports : |
Not
Divulged |
PRODUCTION STATUS (AS ON 31.03.2014)
|
Particulars |
Unit |
Installed
Capacity |
|
Rotors
|
(Nos.) |
2936 |
|
Spindles
|
(Nos.) |
77616 |
|
Knitted Fabric |
(No.
of M/c’s) |
31 |
|
Particulars |
Unit |
Production
/ Purchase |
|
A. Yarn |
|
|
|
Own Manufacturing* |
In Tons |
21621.987 |
|
Trading |
In Tons |
490.115 |
|
B.
Fabric |
In Tons |
2706.659 |
|
C.
job Works and Others |
|
|
|
Fabrics |
In Tons |
454.945 |
* Production includes 2675.591 Tons. (Previous Year
1896.224 Tons.) Transferred for captive consumption
GENERAL INFORMATION
|
Suppliers : |
Not Divulged |
||||||||||||||||||||||||||||||
|
|
|
||||||||||||||||||||||||||||||
|
Customers : |
Not Divulged |
||||||||||||||||||||||||||||||
|
|
|
||||||||||||||||||||||||||||||
|
No. of Employees : |
1549 (Approximately) |
||||||||||||||||||||||||||||||
|
|
|
||||||||||||||||||||||||||||||
|
Bankers : |
v Oriental Bank of Commerce v Punjab National Bank v State Bank of India v Indian Overseas Bank v UCO Bank v Bank of Baroda v IDBI Bank Limited |
||||||||||||||||||||||||||||||
|
|
|
||||||||||||||||||||||||||||||
|
Facilities : |
LONG TERM
BORROWINGS 1. Security (a) Term Loans of Rs. 1338.549 Millions crores are secured by way of first charge on all immovable and movable fixed assets (both present and future) and second charge on current assets. The term loan of Rs. 283.125 Millions are secured by way of third charge on all immovable and movable fixed assets and current assets of the company. The term loans are also secured by personal guarantee of three directors (b) Vehicle Loan is secured by hypothecation of the specific vehicle 2. Terms of Repayment (a) Term loans of Rs. 91.066 millions are repayable in 9 variable quarterly instalments upto 30th June 2016, Rs. 1481.323 millions in 19 variable quarterly instalments upto 31st December 2018 and Rs. 49.285 millions in 23 equal quarterly instalments upto 31st December 2019. (b) Vehicle loan of Rs. 1.438 millions is repayable in 26 variable monthly instalments upto 7th May 2016, Rs. 2.228 millions in 27 variable monthly instalments upto 12th June 2016 and Rs. 11.71 Lacs in 36 variable monthly instalments upto 7th March 2017. SHORT TERM BORROWINGS The working capital loans are secured by way of hypothecation (both present and future) of stocks of raw material / component spares, stock in process, finished goods and book debts and a second charge on all immovable properties (both present and future) of the company. The working capital loans are also secured by personal guarantee of three directors. |
|
Banking
Relations : |
-- |
|
|
|
|
Financial Institution : |
· Daimler Financial Services India Private Limited Unit 202, 2nd Floor, Campus 3B, Rmz Millennia, Business Park, No.143, Dr. M.G.R. Road, Perungudi, Chennai - 600096, Tamilnadu, India |
|
|
|
|
Auditors : |
|
|
Name : |
R. S. Dani and Company Chartered Accountants |
|
Address : |
Bhilwara |
|
|
|
|
Associate : |
Redial Trading and Investment Private Limited |
CAPITAL STRUCTURE
AS ON 31.03.2014
Authorised Capital :
|
No. of Shares |
Type |
Value |
Amount |
|
|
|
|
|
|
46000000 |
Equity Shares |
Rs.10/- each |
Rs.460.000 Millions |
|
400000 |
Preference Shares |
Rs.100/- each |
Rs.40.000 Millions |
|
|
|
|
|
|
|
Total |
|
Rs.500.000
Millions |
Issued, Subscribed & Paid-up Capital :
|
No. of Shares |
Type |
Value |
Amount |
|
|
|
|
|
|
45833945 |
Equity Shares |
Rs.10/- each |
Rs.458.339 Millions |
|
|
|
|
|
Details of equity shares held by shareholders holding more than 5%
shares:
|
Name of
Shareholders |
Number
of Shares |
% holding |
|
Redial
Trading and Investment Private Limited, India |
16682934 |
36.40% |
|
Prasham
Corporate Services (India) Private Limited, India |
-- |
-- |
|
Ratan
Lal Nolkha |
5515000 |
12.03% |
|
Dolphin
Carrier Private Limited, India |
-- |
-- |
The
reconciliation of the number of shares outstanding is set out below:
|
Particulars |
Number of Shares |
|
Equity Shares at the beginning of the year |
45833945 |
|
Add : Shares issued during the year |
-- |
|
Equity Shares at the end of the year |
45833945 |
The company has not issued, any shares pursuant to contract without payment being received in cash, bonus Share and has not bought back any shares
FINANCIAL DATA
[all figures are
in Rupees Millions]
ABRIDGED BALANCE
SHEET
|
SOURCES OF FUNDS |
31.03.2014 |
31.03.2013 |
31.03.2012 |
|
I.
EQUITY
AND LIABILITIES |
|
|
|
|
(1)Shareholders'
Funds |
|
|
|
|
(a) Share Capital |
458.339 |
458.339 |
458.339 |
|
(b) Reserves & Surplus |
857.220 |
549.630 |
408.257 |
|
(c) Money
received against share warrants |
0.000 |
0.000 |
0.000 |
|
|
|
|
|
|
(2) Share Application money pending allotment |
0.000 |
0.000 |
0.000 |
|
Total
Shareholders’ Funds (1) + (2) |
1315.559 |
1007.969 |
866.596 |
|
|
|
|
|
|
(3) Non-Current Liabilities |
|
|
|
|
(a) long-term borrowings |
1307.059 |
1623.212 |
1836.830 |
|
(b) Deferred tax liabilities (Net) |
211.467 |
65.963 |
0.000 |
|
(c) Other long term liabilities |
23.560 |
14.534 |
0.000 |
|
(d) long-term provisions |
0.000 |
0.000 |
10.927 |
|
Total Non-current Liabilities (3) |
1542.086 |
1703.709 |
1847.757 |
|
|
|
|
|
|
(4) Current Liabilities |
|
|
|
|
(a) Short term borrowings |
134.670 |
168.596 |
401.238 |
|
(b) Trade payables |
106.993 |
53.982 |
40.608 |
|
(c) Other current
liabilities |
388.822 |
512.885 |
309.048 |
|
(d) Short-term provisions |
51.717 |
10.145 |
7.736 |
|
Total Current Liabilities (4) |
682.202 |
745.608 |
758.630 |
|
|
|
|
|
|
TOTAL |
3539.847 |
3457.286 |
3472.983 |
|
|
|
|
|
|
II.
ASSETS |
|
|
|
|
(1) Non-current assets |
|
|
|
|
(a) Fixed Assets |
|
|
|
|
(i) Tangible assets |
1912.143 |
2129.852 |
2280.889 |
|
(ii) Intangible Assets |
0.000 |
0.000 |
0.000 |
|
(iii) Capital work-in-progress |
211.764 |
0.000 |
33.803 |
|
(iv)
Intangible assets under development |
0.000 |
0.000 |
0.000 |
|
(b) Non-current Investments |
0.000 |
0.000 |
0.000 |
|
(c) Deferred tax assets (net) |
0.000 |
0.000 |
2.422 |
|
(d) Long-term Loan and Advances |
299.765 |
65.034 |
47.628 |
|
(e) Other Non-current assets |
0.000 |
0.000 |
0.000 |
|
Total Non-Current Assets |
2423.672 |
2194.886 |
2364.742 |
|
|
|
|
|
|
(2) Current assets |
|
|
|
|
(a) Current investments |
0.000 |
0.000 |
0.000 |
|
(b) Inventories |
706.984 |
818.970 |
771.240 |
|
(c) Trade receivables |
248.931 |
280.397 |
185.015 |
|
(d) Cash and cash
equivalents |
0.637 |
2.759 |
0.847 |
|
(e) Short-term loans and
advances |
46.915 |
50.999 |
17.500 |
|
(f) Other current assets |
112.708 |
109.275 |
133.639 |
|
Total Current Assets |
1116.175 |
1262.400 |
1108.241 |
|
|
|
|
|
|
TOTAL |
3539.847 |
3457.286 |
3472.983 |
PROFIT & LOSS
ACCOUNT
|
|
PARTICULARS |
31.03.2014 |
31.03.2013 |
31.03.2012 |
|
|
|
SALES |
|
|
|
|
|
|
|
Income |
4883.402 |
4460.536 |
4283.003 |
|
|
|
Other Income |
3.476 |
3.029 |
1.267 |
|
|
|
TOTAL |
4886.878 |
4463.565 |
4284.270 |
|
|
|
|
|
|
|
|
Less |
EXPENSES |
|
|
|
|
|
|
|
Cost of Materials Consumed |
2935.421 |
2495.843 |
2800.369 |
|
|
|
Purchases of Stock-in-Trade |
102.360 |
146.063 |
62.674 |
|
|
|
Changes in inventories of finished goods, work-in-progress
and Stock-in-Trade |
(59.213) |
(1.895) |
104.282 |
|
|
|
Employees benefits expense |
246.021 |
199.360 |
164.949 |
|
|
|
Other expenses |
719.449 |
749.008 |
700.280 |
|
|
|
TOTAL |
3944.038 |
3588.379 |
3832.554 |
|
|
|
|
|
|
|
|
|
PROFIT/
(LOSS) BEFORE INTEREST, TAX, DEPRECIATION
AND AMORTISATION |
942.840 |
875.186 |
451.716 |
|
|
|
|
|
|
|
|
|
Less |
FINANCIAL
EXPENSES |
174.635 |
273.058 |
208.956 |
|
|
|
|
|
|
|
|
|
|
PROFIT
/ (LOSS) BEFORE TAX, DEPRECIATION AND AMORTISATION |
768.205 |
602.128 |
242.760 |
|
|
|
|
|
|
|
|
|
Less/ Add |
DEPRECIATION/
AMORTISATION |
248.658 |
244.987 |
239.755 |
|
|
|
|
|
|
|
|
|
|
PROFIT/
(LOSS) BEFORE TAX |
519.547 |
357.141 |
3.005 |
|
|
|
|
|
|
|
|
|
Less |
TAX |
171.740 |
215.768 |
(0.026) |
|
|
|
|
|
|
|
|
|
|
PROFIT/
(LOSS) AFTER TAX |
347.807 |
141.373 |
3.031 |
|
|
|
|
|
|
|
|
|
Add |
PREVIOUS
YEARS’ BALANCE BROUGHT FORWARD |
218.575 |
77.202 |
74.171 |
|
|
|
|
|
|
|
|
|
Less |
APPROPRIATIONS |
|
|
|
|
|
|
|
Transfer to General Reserve |
35.618 |
0.000 |
0.000 |
|
|
|
Dividend |
34.375 |
0.000 |
0.000 |
|
|
|
Tax on Dividend |
5.842 |
0.000 |
0.000 |
|
|
BALANCE CARRIED
TO THE B/S |
490.547 |
218.575 |
77.202 |
|
|
|
|
|
|
|
|
|
|
EARNINGS IN FOREIGN
CURRENCY |
|
|
|
|
|
|
|
Export of Goods at FOB value |
3161.991 |
3278.700 |
2798.433 |
|
|
|
|
|
|
|
|
|
IMPORTS |
|
|
|
|
|
|
|
Components and Spare Parts including Packing Materials |
52.354 |
51.293 |
48.711 |
|
|
|
Raw Material |
138.136 |
225.809 |
4.268 |
|
|
|
Capital Goods |
24.185 |
48.632 |
18.781 |
|
|
TOTAL IMPORTS |
214.675 |
325.734 |
71.760 |
|
|
|
|
|
|
|
|
|
|
Earnings /
(Loss) Per Share (Rs.) |
7.59 |
3.08 |
0.07 |
|
KEY RATIOS
|
PARTICULARS |
|
31.03.2014 |
31.03.2013 |
31.03.2012 |
|
PAT / Total Income |
(%) |
7.12 |
3.17 |
0.07 |
|
|
|
|
|
|
|
Net Profit Margin (PBT/Sales) |
(%) |
10.64 |
8.01 |
0.07 |
|
|
|
|
|
|
|
Return on Total Assets (PBT/Total Assets} |
(%) |
15.61 |
10.33 |
0.09 |
|
|
|
|
|
|
|
Return on Investment (ROI) (PBT/Networth) |
|
0.39 |
0.35 |
0.00 |
|
|
|
|
|
|
|
Debt Equity Ratio (Total Debt/Networth) |
|
1.10 |
1.78 |
2.58 |
|
|
|
|
|
|
|
Current Ratio (Current Asset/Current Liability) |
|
1.64 |
1.69 |
1.46 |
FINANCIAL ANALYSIS
[all figures are
in Rupees Millions]
DEBT EQUITY RATIO
|
Particular |
31.03.2012 |
31.03.2013 |
31.03.2014 |
|
|
(Rs. In Millions) |
(Rs. In Millions) |
(Rs. In Millions) |
|
Share Capital |
458.339 |
458.339 |
458.339 |
|
Reserves & Surplus |
408.257 |
549.630 |
857.220 |
|
Net worth |
866.596 |
1007.969 |
1315.559 |
|
|
|
|
|
|
long-term borrowings |
1836.830 |
1623.212 |
1307.059 |
|
Short term borrowings |
401.238 |
168.596 |
134.670 |
|
Total borrowings |
2238.068 |
1791.808 |
1441.729 |
|
Debt/Equity ratio |
2.583 |
1.778 |
1.096 |
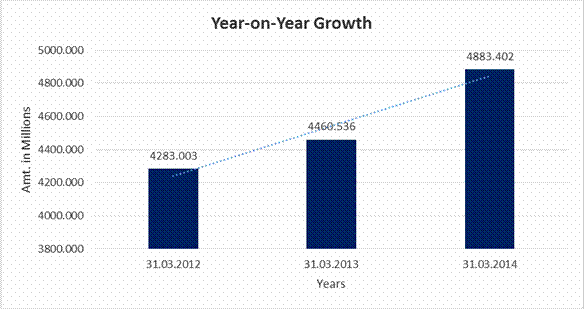
YEAR-ON-YEAR GROWTH
|
Year on Year Growth |
31.03.2012 |
31.03.2013 |
31.03.2014 |
|
|
(Rs. In Millions) |
(Rs. In Millions) |
(Rs. In Millions) |
|
Revenue from Operations |
4283.003 |
4460.536 |
4883.402 |
|
|
|
4.145 |
9.480 |
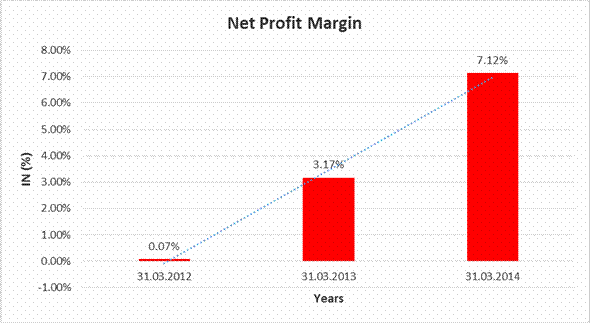
NET PROFIT MARGIN
|
Net Profit Margin |
31.03.2012 |
31.03.2013 |
31.03.2014 |
|
|
(Rs. In Millions) |
(Rs. In Millions) |
(Rs. In Millions) |
|
Revenue from Operations |
4283.003 |
4460.536 |
4883.402 |
|
Profit |
3.031 |
141.373 |
347.807 |
|
|
0.07% |
3.17% |
7.12% |
LOCAL AGENCY FURTHER INFORMATION
|
Sr. No. |
Check List by Info Agents |
Available in
Report (Yes / No) |
|
1] |
Year of Establishment |
Yes |
|
2] |
Locality of the firm |
Yes |
|
3] |
Constitutions of the firm |
Yes |
|
4] |
Premises details |
No |
|
5] |
Type of Business |
Yes |
|
6] |
Line of Business |
Yes |
|
7] |
Promoter's background |
Yes |
|
8] |
No. of employees |
Yes |
|
9] |
Name of person contacted |
No |
|
10] |
Designation of contact
person |
No |
|
11] |
Turnover of firm for last
three years |
Yes |
|
12] |
Profitability for last
three years |
Yes |
|
13] |
Reasons for variation
<> 20% |
----- |
|
14] |
Estimation for coming
financial year |
No |
|
15] |
Capital in the business |
Yes |
|
16] |
Details of sister
concerns |
Yes |
|
17] |
Major suppliers |
No |
|
18] |
Major customers |
No |
|
19] |
Payments terms |
No |
|
20] |
Export / Import details
(if applicable) |
No |
|
21] |
Market information |
----- |
|
22] |
Litigations that the firm
/ promoter involved in |
----- |
|
23] |
Banking Details |
Yes |
|
24] |
Banking facility details |
Yes |
|
25] |
Conduct of the banking
account |
----- |
|
26] |
Buyer visit details |
----- |
|
27] |
Financials, if provided |
Yes |
|
28] |
Incorporation details, if
applicable |
Yes |
|
29] |
Last accounts filed at
ROC |
Yes |
|
30] |
Major Shareholders, if
available |
Yes |
|
31] |
Date of Birth of
Proprietor/Partner/Director, if available |
Yes |
|
32] |
PAN of
Proprietor/Partner/Director, if available |
No |
|
33] |
Voter ID No of Proprietor/Partner/Director,
if available |
No |
|
34] |
External Agency Rating,
if available |
Yes |
INDEX OF CHARGES
|
S.NO. |
CHARGE ID |
DATE OF CHARGE CREATION/MODIFICATION |
CHARGE AMOUNT SECURED |
CHARGE HOLDER |
ADDRESS |
SERVICE REQUEST NUMBER (SRN) |
|
1 |
10510756 |
30/05/2014 |
550,000.00 |
HDFC BANK
LIMITED |
HDFC BANK HOUSE
SENAPATI BAPAT MARG, LOWER PAREL |
C12884300 |
|
2 |
10509374 |
30/05/2014 |
750,000.00 |
HDFC BANK
LIMITED |
HDFC BANK HOUSE
SENAPATI BAPAT MARG, LOWER PAREL |
C11556859 |
|
3 |
10508355 |
16/05/2014 |
500,000.00 |
HDFC BANK
LIMITED |
HDFC BANK HOUSE
SENAPATI BAPAT MARG, LOWER PAREL |
C10805521 |
|
4 |
10508364 |
16/05/2014 |
500,000.00 |
HDFC BANK
LIMITED |
HDFC BANK HOUSE
SENAPATI BAPAT MARG, LOWER PAREL |
C10808558 |
|
5 |
10508534 |
16/05/2014 |
500,000.00 |
HDFC BANK
LIMITED |
HDFC BANK HOUSE
SENAPATI BAPAT MARG, LOWER PAREL |
C10941391 |
|
6 |
10508108 |
16/05/2014 |
525,000.00 |
HDFC BANK
LIMITED |
HDFC BANK HOUSE,
SENAPATI BAPAT MARG, LOWER PAREL W, MUMBAI, MAHARASHTRA - 400013, INDIA |
C10583870 |
|
7 |
10508352 |
16/05/2014 |
525,000.00 |
HDFC BANK
LIMITED |
HDFC BANK HOUSE
SENAPATI BAPAT MARG, LOWER PAREL |
C10804219 |
|
8 |
10508368 |
16/05/2014 |
525,000.00 |
HDFC BANK
LIMITED |
HDFC BANK HOUSE
SENAPATI BAPAT MARG, LOWER PAREL |
C10810604 |
|
9 |
10508359 |
16/05/2014 |
625,000.00 |
HDFC BANK
LIMITED |
HDFC BANK HOUSE SENAPATI
BAPAT MARG, LOWER PAREL |
C10806966 |
|
10 |
10491148 |
10/03/2014 |
1,200,000.00 |
HDFC BANK
LIMITED |
HDFC BANK HOUSE
SENAPATI BAPAT MARG, LOWER PAREL |
C03615176 |
|
11 |
10473519 |
24/06/2014 * |
2,000,000,000.00 |
PUNJAB NATIONA
BANK |
BHOPAL GANJ,
BHILWARA, RAJASTHAN - 311001, INDIA |
C09754854 |
|
12 |
10443047 |
09/07/2013 |
3,000,000.00 |
DAIMLER
FINANCIAL SERVICES INDIA PRIVATE LIMITED |
UNIT 202, 2ND FLOOR,
CAMPUS 3B,RMZ MILLENNIA, BUSINESS PARK, NO.143, DR. M.G.R. ROAD, PERUNGUDI,
CHENNAI, TAMILNADU - 600096, INDIA |
B82023581 |
|
13 |
10343563 |
24/06/2014 * |
45,000,000.00 |
INDIAN OVERSEAS
BANK |
1-5, AAKAR TOWER,,
OLD RTO ROAD, GANDHI NAGAR, BHILWARA, RAJASTHAN - 311001, INDIA |
C11679719 |
|
14 |
10342519 |
24/06/2014 * |
45,000,000.00 |
PUNJAB NATIONAL
BANK |
BHOPAL GANJ,
BHILWARA, RAJASTHAN - 311001, INDIA |
C09756099 |
|
15 |
10184525 |
12/10/2009 |
215,000,000.00 |
ICICI BANK
LIMITED |
LANDMARKRACE
COURCE CIRCLE, ALKAPURI, BARODA, GUJARAT - 390015, INDIA |
A73099848 |
|
16 |
10167302 |
15/07/2009 |
65,000,000.00 |
PUNJAB NATIONAL
BANK |
BHOPAL GANJ,
BHILWARA, RAJASTHAN - 311001, INDIA |
A66114034 |
|
17 |
10165556 |
12/10/2009 * |
160,000,000.00 |
ICICI BANK
LIMITED |
LANDMARKRACE
COURCE CIRCLE, ALKAPURI, BARODA, GUJARAT - 390015, INDIA |
A72522949 |
|
18 |
10106054 |
19/06/2008 |
220,000,000.00 |
3I INFOTECH
TRUSTEESHIP SERVICES LIMITED |
3RD TO 6TH FLOOR,
INTERNATIONAL INFOTECH PARK, TOWER NO.5, VASHI RAILWAY STATION COMPLEX,
VASHI, NAVI MUMBAI, MAHARASHTRA - 400703, INDIA |
A39851340 |
|
19 |
10074418 |
22/07/2008 * |
350,000,000.00 |
STATE BANK OF
INDIA |
COMMERCIAL
BRANCH, PUR ROAD, BHILWARA, RAJASTHAN - 311001, INDIA |
A42506360 |
|
20 |
10036397 |
24/06/2014 * |
260,000,000.00 |
UCO BANK |
NAGORI GARDEN,
BHILWARA, RAJASTHAN - 311001, INDIA |
C09910928 |
|
21 |
10009866 |
24/06/2014 * |
50,000,000.00 |
BANK OF BARODA |
NAGORI GARDEN, BHILWARA,
RAJASTHAN - 311001, INDIA |
C10349470 |
|
22 |
10006965 |
24/06/2014 * |
500,000,000.00 |
STATE BANK OF
INDIA |
PALM COURT
BUILDING, 6TH FLOOR,, MEHRAULI ROAD,, |
C11611357 |
|
23 |
10004846 |
24/06/2014 * |
150,000,000.00 |
INDIAN OVERSEAS
BANK |
1-5, AAKAR
TOWER, OLD RTO ROAD, GANDHI NAGAR, BHILWARA, RAJASTHAN - 311001, INDIA |
C11677192 |
|
24 |
10004301 |
24/06/2014 * |
250,000,000.00 |
ORIENTAL BANK OF
COMMERCE |
SHANTI BHAWAN, BHILWARA,
RAJASTHAN - 311001, INDIA |
C10317337 |
|
25 |
10003658 |
24/06/2014 * |
400,000,000.00 |
PUNJAB NATIONAL
BANK |
BHOPAL GANJ,
BHILWARA, RAJASTHAN - 311001, INDIA |
C09801911 |
|
26 |
80010865 |
24/06/2014 * |
40,000,000.00 |
ORIENTAL BANK OF
COMMERCE |
SHANTI BHAWAN,
BHILWARA, RAJASTHAN - 311001, INDIA |
C10317816 |
|
27 |
80019915 |
24/06/2014 * |
60,000,000.00 |
IDBI BANK
LIMITED |
IDBI TOWER, WTC
COMPLEX, CUFFE PARADE, MUMBAI, MAHARASHTRA - 400005, INDIA |
C11054327 |
|
28 |
80010845 |
24/06/2014 * |
70,000,000.00 |
INDIAN OVERSEAS
BANK |
1-5, AAKAR
TOWER, OLD RTO ROAD, GANDHI NAGAR, BHILWARA, RAJASTHAN - 311001, INDIA |
C11676152 |
|
29 |
90113571 |
24/06/2014 * |
75,000,000.00 |
PUNJAB NATIONAL
BANK |
BHOPAL GANJ, BHILWARA,
RAJASTHAN - 311002, INDIA |
C09755513 |
|
30 |
80019916 |
24/09/2013 * |
1,140,000,000.00 |
ORIENTAL BANK OF
COMMERCE |
SHANTI BHAWAN,
BHILWARA, RAJASTHAN - 311001, INDIA |
B86069655 |
|
31 |
90113552 |
19/07/2012 * |
190,000,000.00 |
PUNJAB NATIONAL
BANK |
BHOPAL GANJ,
BHILWARA, RAJASTHAN - 311001, INDIA |
B45373800 |
|
32 |
90113286 |
19/07/2012 * |
190,000,000.00 |
INDIAN OVERSEAS
BANK |
1-5, AAKAR
TOWER, OLD RTO ROAD, GANDHI NAGAR, BHILWARA, RAJASTHAN - 311001, INDIA |
B45411329 |
|
33 |
90113277 |
08/10/2013 * |
605,000,000.00 |
ORIENTAL BANK OF
COMMERCE |
SHANTI BHAWAN,
BHILWARA, RAJASTHAN - 311001, INDIA |
B87734455 |
* Date of charge modification
UNSECURED LOANS
|
PARTICULARS |
31.03.2014 (Rs.
In Millions) |
31.03.2013 (Rs.
In Millions) |
|
SHORT TERM
BORROWINGS |
|
|
|
Security Deposits |
0.435 |
0.485 |
|
|
|
|
|
Total |
0.435 |
0.485 |
OPERATIONAL REVIEW
This was a remarkable year for the Company as it has achieved highest ever turnover as well as profitability. During the year turnover has increased to Rs. 4883.400 millions from Rs. 4460.500 millions representing an increase of 9.48% over previous year. There is significant increase in the turnover of Knitted Fabric from Rs. 452.000 millions in the previous year to Rs. 701.500 millions during the current year registering an increase of 55.20% over the previous year. The export turnover marginally decreased from Rs. 3409.000 millions in the previous year to Rs. 3320.500 Millions in the current year. The export turnover constitutes 68% of the total turnover.
Stable cotton price, consistent demand of Cotton Yarn from Domestic as well as International markets and favorable foreign exchange rates resulted in increased operating profit (EBIDTA) from Rs 875.200 millions in previous year to Rs. 942.800 millions in current year registering an increase of 7.72% over previous year. The Company has achieved Net Profit (PAT) of Rs. 347.800 millions registering an increase of around 250% from Rs.141.400 millions in the previous year and Earning Per Share of Rs. 7.59 for current year against Rs. 3.08 in the previous year. The Board of Directors expect to repeat the same performance in the current Financial Year -2014 15
MANAGEMENT DISCUSSIONS AND ANALYSIS
INDUSTRY OUTLOOK
The Growth in GDP of their country during the year 2013-14 is pegged at 4.90%s as compared to the Growth rate of 4.50% in the year 2012-13 indicating that slowdown in their country has bottomed out. The Textile Sector comprising Cotton, Man-made Fibers, Jute, Sericulture & Silk Wool, Handlooms and handicrafts play a key role in the Indian economy by way of significant contribution to GDP, manufacturing output, employment generation and export earnings. The Cotton Textile sector continued to be largest sector with around 75% share of the total Indian Textile sector.
In the diverse economic and manufacturing activities of India, cotton growing, processing and trading occupy a predominant position and act as one of the strong competitive base for textile and clothing production. India is one of the largest producers and exporters of cotton and an influencing player in global cotton economy. A significant amount of cotton was being imported for spinning industry till 2004-05, a year later, India became a net exporter in cotton and holds this position till now after meeting the domestic requirement. India has occupied the 2nd slot in world’s cotton production, consumption and export. In the current season 2013-14 cotton crop is estimated at 375 lacs bales against 340 lacs bales during previous season. The Cotton Textile Industry performed well during the current year and production of Cotton Yarn in their country has increased by about 10% and Exports nearly 32%. The cotton prices remained stable during the year. Stable Cotton price, consistent demand of Cotton Yarn from Domestic as well as International Markets and favorasspble foreign exchange rates have resulted into a landmark year for the Cotton Spinning Industry and the company has also witnessed phenomenal growth in operating and cash margins.
UNAUDITED RESULTS FOR THE QUARTER AND ENDED ON 30TH JUNE,
2014
(RS.
IN MILLIONS)
|
|
|
PARTICULARS |
Quarter
ended 30.06.2014 |
|
1 |
Income from Operations |
|
|
|
|
a) Net Sales/Income from Operations (net of excise duty) |
1326.366 |
|
|
|
b) Other Operating Income |
0.688 |
|
|
|
Total Income from Operations (Net) |
1327.054 |
|
|
2 |
Expenses |
|
|
|
|
a) |
Cost of Materials consumed |
765.854 |
|
|
b) |
Purchase of stock in-trade |
17.396 |
|
|
c) |
Changes in inventories of finished goods, work-in-progress and
stock-in-trade |
48.914 |
|
|
d) |
Employee benefit expenses |
69.229 |
|
|
e) |
Depreciation and amortization expense |
62.835 |
|
|
f) |
Power & Fuel |
105.407 |
|
|
g) |
Other expenses |
95.762 |
|
|
Total Expenses |
1165.397 |
|
|
3 |
|
Profit /(Loss) from operations
before other income, finance costs and exceptional items (1-2) |
1.657 |
|
4 |
Other Income |
7.670 |
|
|
5 |
|
Profit /(Loss) from
ordinary activities before finance costs and exceptional items (3+4) |
169.327 |
|
6 |
Finance Costs |
49.616 |
|
|
7 |
|
Profit /(Loss) from
ordinary activities after finance costs but before exceptional items (5-6) |
119.711 |
|
8 |
Exceptional Items |
-- |
|
|
9 |
Profit /(Loss) from ordinary activities before tax |
119.711 |
|
|
10 |
Tax Expense |
|
|
|
|
-
Current
Tax |
-- |
|
|
|
-
Deferred
Tax |
32.046 |
|
|
11 |
Net Profit /(Loss) from ordinary activities after tax
(9-10) |
87.665 |
|
|
12 |
Extraordinary items (net
of tax expense) |
-- |
|
|
13 |
Net Profit /(Loss) for the period (11-12) |
87.665 |
|
|
14 |
Paid up equity share
capital (Eq. shares of Rs.10/- each) |
458.339 |
|
|
15 |
Reserve excluding
revaluation reserves |
|
|
|
16 |
|
Earnings per share
(before/after extraordinary items) of
Rs.10/- each |
|
|
|
|
Basic |
1.91 |
|
|
|
Diluted |
1.91 |
|
A |
|
PARTICULARS OF
SHAREHOLDING |
|
|
1 |
|
Public Shareholding |
|
|
|
|
- No. of Shares |
16600118 |
|
|
|
- Percentage of
Shareholding |
36.22% |
|
2 |
|
Promoters and promoter group shareholding |
|
|
|
|
a) Pledged/Encumbered |
|
|
|
|
- Number of shares |
-- |
|
|
|
- Percentage of shares (
as a % of the total shareholding of the promoter and promoter group) |
-- |
|
|
|
- Percentage of shares
(as a % of the total share capital of the Company) |
-- |
|
|
|
b) Non- encumbered |
|
|
|
|
- Number of shares |
29233827 |
|
|
|
- Percentage of shares (
as a % of the total shareholding of the promoter and promoter group) |
100.00% |
|
|
|
- Percentage of shares
(as a % of the total share capital of the Company) |
6378% |
NOTES:
1. The expansion Project of Spinning and Knitting facilities involving capital expenditure of RS. 28.600 million is being implemented as per schedule.
2. The Provision of Current Tax is net of MAT credit entitlement of RS. 25.092 millions.
3. No investor’s complaint was pending at the beginning and end of the quarter and no complaint was received during the quarter.
4. The company business activities falls within a single business segment (Textile), in terms of accounting standard – 17 of ICAI.
5. The figures of the quarter ended 31st March, 2014 are the balancing figures between the audited figures in respect of full financial year ended on 31st March, 2014 and unaudited published figures upto the quarter ended 31st December, 2013. The figures of previous year/quarter have been regrouped/rearranged, wherever required.
6. The above financial results have been approved by the audit committee and board of Directors at their meeting held on 29th July, 2014.
CONTINGENT LIABILITIES AND COMMITMENTS
i)
CONTINGENT
LIABILITIES NOT PROVIDED FOR :
|
Particulars |
31.03.2014 (Rs. In Millions) |
31.03.2013 (Rs. In Millions) |
|
Disputed Liabilities not acknowledged as
debts |
|
|
|
- Cenvat, Service Tax and Custom Duty |
80.491 |
81.499 |
|
Guarantees |
|
|
|
- Outstanding Bank Guarantees |
31.559 |
12.959 |
|
Other money for which the company is
contingently liable |
|
|
|
- Bill Discounted with Bank |
466.793 |
421.032 |
ii) Commitments
a) Estimated amount of contracts remaining to be executed on capital account and not provided for (Net of Advances) Rs. 1803.870 millions (Previous Year – Rs. 1.593 millions).
b) The company has an outstanding export obligation of appox. Rs. 113.664 millions. (Previous Year – Rs. 256.707 millions), in respect of capital goods imported at the concessional rate of duty under Export Promotion Capital Goods Scheme, which is required to be met at different dates on or before 31.03.2020.
FIXED ASSETS
œ Freehold Land
œ Buildings
œ Plant and Machinery
œ Electric Installation
œ Furniture and Fixtures
œ Office Equipment’s
œ Vehicles
CMT REPORT (Corruption, Money Laundering & Terrorism]
The Public Notice information has been collected from various sources including
but not limited to: The Courts,
1] INFORMATION ON
DESIGNATED PARTY
No exist designating subject or any of its beneficial owners,
controlling shareholders or senior officers as terrorist or terrorist
organization or whom notice had been received that all financial transactions
involving their assets have been blocked or convicted, found guilty or against
whom a judgement or order had been entered in a proceedings for violating
money-laundering, anti-corruption or bribery or international economic or
anti-terrorism sanction laws or whose assets were seized, blocked, frozen or
ordered forfeited for violation of money laundering or international
anti-terrorism laws.
2] Court Declaration :
No exist to suggest that subject is or was
the subject of any formal or informal allegations, prosecutions or other
official proceeding for making any prohibited payments or other improper
payments to government officials for engaging in prohibited transactions or
with designated parties.
3] Asset Declaration :
No records exist to suggest that the property or assets of the subject
are derived from criminal conduct or a prohibited transaction.
4] Record on Financial
Crime :
Charges or conviction registered
against subject: None
5] Records on Violation of
Anti-Corruption Laws :
Charges or
investigation registered against subject: None
6] Records on Int’l
Anti-Money Laundering Laws/Standards :
Charges or
investigation registered against subject: None
7] Criminal Records
No
available information exist that suggest that subject or any of its principals
have been formally charged or convicted by a competent governmental authority
for any financial crime or under any formal investigation by a competent
government authority for any violation of anti-corruption laws or international
anti-money laundering laws or standard.
8] Affiliation with
Government :
No record
exists to suggest that any director or indirect owners, controlling shareholders,
director, officer or employee of the company is a government official or a
family member or close business associate of a Government official.
9] Compensation Package :
Our market
survey revealed that the amount of compensation sought by the subject is fair
and reasonable and comparable to compensation paid to others for similar
services.
10] Press Report :
No press reports / filings exists on
the subject.
CORPORATE GOVERNANCE
MIRA INFORM as part of its Due Diligence do provide comments on Corporate
Governance to identify management and governance. These factors often have been
predictive and in some cases have created vulnerabilities to credit
deterioration.
Our Governance Assessment focuses principally on the interactions
between a company’s management, its Board of Directors, Shareholders and other
financial stakeholders.
CONTRAVENTION
Subject is not known to have contravened any existing local laws,
regulations or policies that prohibit, restrict or otherwise affect the terms
and conditions that could be included in the agreement with the subject.
FOREIGN EXCHANGE RATES
|
Currency |
Unit
|
Indian Rupees |
|
US Dollar |
1 |
Rs. 60.44 |
|
|
1 |
Rs. 98.64 |
|
Euro |
1 |
Rs. 78.20 |
INFORMATION DETAILS
|
Information Gathered
by : |
NYA |
|
|
|
|
Analysis Done by
: |
RAS |
|
|
|
|
Report Prepared
by : |
BVA |
SCORE & RATING EXPLANATIONS
|
SCORE FACTORS |
RANGE |
POINTS |
|
HISTORY |
1~10 |
6 |
|
PAID-UP CAPITAL |
1~10 |
5 |
|
OPERATING SCALE |
1~10 |
6 |
|
FINANCIAL CONDITION |
|
|
|
--BUSINESS SCALE |
1~10 |
6 |
|
--PROFITABILIRY |
1~10 |
6 |
|
--LIQUIDITY |
1~10 |
5 |
|
--LEVERAGE |
1~10 |
5 |
|
--RESERVES |
1~10 |
6 |
|
--CREDIT LINES |
1~10 |
6 |
|
--MARGINS |
-5~5 |
-- |
|
DEMERIT POINTS |
|
|
|
--BANK CHARGES |
YES/NO |
YES |
|
--LITIGATION |
YES/NO |
NO |
|
--OTHER ADVERSE INFORMATION |
YES/NO |
NO |
|
MERIT POINTS |
|
|
|
--SOLE DISTRIBUTORSHIP |
YES/NO |
NO |
|
--EXPORT ACTIVITIES |
YES/NO |
NO |
|
--AFFILIATION |
YES/NO |
YES |
|
--LISTED |
YES/NO |
YES |
|
--OTHER MERIT FACTORS |
YES/NO |
YES |
|
DEFAULTER |
|
|
|
--RBI |
YES/NO |
NO |
|
--EPF |
YES/NO |
NO |
|
TOTAL |
|
51 |
This score serves as a reference to assess SC’s credit risk and
to set the amount of credit to be extended. It is calculated from a composite
of weighted scores obtained from each of the major sections of this report. The
assessed factors and their relative weights (as indicated through %) are as
follows:
Financial
condition (40%) Ownership
background (20%) Payment
record (10%)
Credit history
(10%) Market trend
(10%) Operational
size (10%)
RATING EXPLANATIONS
|
RATING |
STATUS |
PROPOSED CREDIT LINE |
|
|
>86 |
Aaa |
Possesses an extremely sound financial base with the strongest
capability for timely payment of interest and principal sums |
Unlimited |
|
71-85 |
Aa |
Possesses adequate working capital. No caution needed for credit
transaction. It has above average (strong) capability for payment of interest
and principal sums |
Large |
|
56-70 |
A |
Financial & operational base are regarded healthy. General
unfavourable factors will not cause fatal effect. Satisfactory capability for
payment of interest and principal sums |
Fairly Large |
|
41-55 |
Ba |
Overall operation is considered normal. Capable to meet normal
commitments. |
Satisfactory |
|
26-40 |
B |
Capability to overcome financial difficulties seems comparatively below
average. |
Small |
|
11-25 |
Ca |
Adverse factors are apparent. Repayment of interest and principal sums
in default or expected to be in default upon maturity |
Limited with
full security |
|
<10 |
C |
Absolute credit risk exists. Caution needed to be exercised |
Credit not
recommended |
|
-- |
NB |
New Business |
-- |
This report is issued at your request without any
risk and responsibility on the part of MIRA INFORM PRIVATE LIMITED (MIPL)
or its officials.