MIRA
INFORM REPORT
|
Report Date : |
13.09.2014 |
IDENTIFICATION DETAILS
|
Name : |
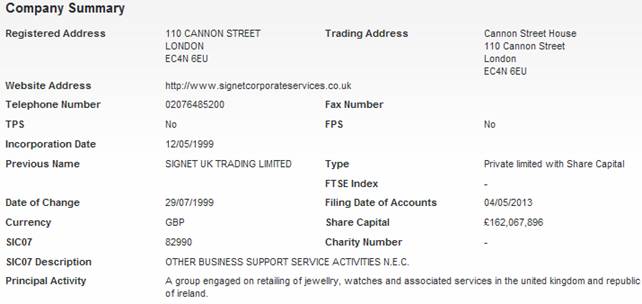
SIGNET TRADING LIMITED |
|
|
|
|
Formerly Known As : |
SIGNET |
|
|
|
|
Registered Office : |
110, |
|
|
|
|
Country : |
|
|
|
|
|
Financials (as on) : |
02.02.2013 |
|
|
|
|
Date of Incorporation : |
12.05.1999 |
|
|
|
|
Legal Form : |
Private Limited with Share Capital |
|
|
|
|
Line of Business : |
Subject is engaged in Retailing of Jewellery, Watches and Associates
Services. |
|
|
|
|
No of Employees : |
3156 |
RATING & COMMENTS
|
MIRA’s Rating : |
Ba |
|
RATING |
STATUS |
PROPOSED CREDIT LINE |
|
|
41-55 |
Ba |
Overall operation is considered normal. Capable to meet normal
commitments. |
Satisfactory |
|
Status : |
Satisfactory |
|
|
|
|
Payment Behaviour : |
Slow but correct |
|
|
|
|
Litigation : |
Clear |
NOTES:
Any query related to this report can be made
on e-mail: infodept@mirainform.com
while quoting report number, name and date.
ECGC Country Risk Classification List – June 01, 2014
|
Country Name |
Previous Rating (31.03.2014) |
Current Rating (01.06.2014) |
|
|
A1 |
A1 |
|
Risk Category |
ECGC
Classification |
|
Insignificant |
A1 |
|
Low Risk |
A2 |
|
Moderate Low Risk |
B1 |
|
Moderate Risk |
B2 |
|
Moderate High Risk |
C1 |
|
High Risk |
C2 |
|
Very High Risk |
D |
The
|
Source
: CIA |
REGISTERED NAME & COMPANY
SUMMARY
SIGNET TRADING LIMITED
Office Address
Hunters Road Hockley,
DIRECTORS/MANAGEMENT
Current Directors
|
Name |
Mark Andrew
Jenkins |
Date of Birth |
15/11/1957 |
|
Officers Title |
Mr |
Nationality |
British |
|
Present Appointments |
78 |
Function |
Director |
|
Appointment Date |
25/06/2007 |
|
|
|
Address |
|
||
|
Name |
Shaun David Carney |
Date of Birth |
13/10/1966 |
|
Officers Title |
Mr |
Nationality |
British |
|
Present Appointments |
7 |
Function |
Director |
|
Appointment Date |
01/02/2014 |
|
|
|
Address |
|
||
Current Company
Secretary
|
Name |
Mark Andrew
Jenkins |
Date of Birth |
15/11/1957 |
|
Officers Title |
Mr |
Nationality |
British |
|
Present Appointments |
78 |
Function |
Company Secretary |
|
Appointment Date |
01/03/2004 |
|
|
|
Address |
|
||
Previous
Director/Company Secretaries
|
Name |
Current Directorships |
Previous Directorships |
|
Walker Gordon Boyd |
34 |
30 |
|
Simon Lee Cashman |
27 |
27 |
|
Timothy John
Jackson |
1 |
19 |
|
INSTANT COMPANIES
LIMITED |
2431 |
120340 |
|
SWIFT
INCORPORATIONS LIMITED |
2579 |
263489 |
|
Kenneth Charles Pratt |
0 |
43 |
|
Michael Phillip
Povall |
0 |
6 |
NEGATIVE INFORMATION
Mortgage Summary
Total Mortgage 0
Outstanding 0
Satisfied 0
Trade Debtors / Bad Debt Summary
Total Number of Documented
Trade 0
Total Value of Documented
Trade £0
CCJ
|
Total Number of Exact
CCJs - |
Total Value of Exact
CCJs - |
||
|
Total Number of Possible
CCJs - |
Total Value of Possible
CCJs - |
||
|
Total Number of
Satisfied CCJs - |
Total Value of Satisfied
CCJs - |
||
|
Total Number of Writs - |
- |
|
|
Exact CCJ Details
|
No CCJs found. |
Possible CCJs Details
|
There are no possible
CCJ details. |
Writ Details
|
No writs found. |
SHARE & SHARE CAPITAL
INFORMATION
Top 20 Shareholders
|
Name |
Currency |
Share Count |
Share Type |
Nominal Value |
% of Total Share Count |
|
SIGNET HOLDINGS LTD |
GBP |
162,067,896 |
ORDINARY |
1 |
100 |
PAYMENT INFORMATION
|
Average Invoice Value |
£2050.86 |
|
Invoices available |
118 |
|
Paid |
98 |
|
Outstanding |
20 |
|
Trade Payment Data is
information that we collect from selected third party partners who send us
information about their whole sales ledger. |
|
|
Within Terms |
0-30 Days |
31-60 Days |
61-90 Days |
91+ Days |
|
Paid |
44 |
15 |
3 |
1 |
35 |
|
Outstanding |
1 |
0 |
5 |
7 |
7 |
GROUP STRUCTURE & AFFILIATED
COMPANIES
N/A
FINANCIAL INFORMATION
Profit & Loss
|
Date Of Accounts |
02/02/13 |
(%) |
28/01/12 |
(%) |
29/01/11 |
(%) |
30/01/10 |
(%) |
31/01/09 |
|
Weeks |
53 |
(%) |
52 |
(%) |
52 |
(%) |
52 |
(%) |
52 |
|
Currency |
GBP |
(%) |
GBP |
(%) |
GBP |
(%) |
GBP |
(%) |
GBP |
|
Consolidated A/cs |
Y |
(%) |
Y |
(%) |
Y |
(%) |
N |
(%) |
N |
|
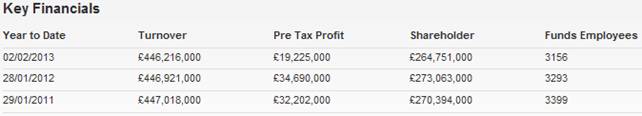
Turnover |
£446,216,000 |
-0.2% |
£446,921,000 |
0% |
£447,018,000 |
278.5% |
£118,114,000 |
4.8% |
£112,707,000 |
|
Export |
- |
- |
- |
- |
- |
- |
- |
- |
- |
|
Cost of Sales |
£386,699,000 |
2.8% |
£376,274,000 |
0.2% |
£375,669,000 |
239.6% |
£110,614,000 |
24.5% |
£88,820,000 |
|
Gross Profit |
£59,517,000 |
-15.8% |
£70,647,000 |
-1% |
£71,349,000 |
851.3% |
£7,500,000 |
-68.6% |
£23,887,000 |
|
Wages & Salaries |
£90,248,000 |
0.5% |
£89,766,000 |
0% |
£89,802,000 |
-2.2% |
£91,797,000 |
2.7% |
£89,369,000 |
|
Directors Emoluments |
£774,000 |
69.7% |
£456,000 |
25.6% |
£363,000 |
25.6% |
£289,000 |
- |
- |
|
Operating Profit |
£20,446,000 |
-40.2% |
£34,203,000 |
7.2% |
£31,896,000 |
330% |
£7,417,000 |
-69.3% |
£24,188,000 |
|
Depreciation |
£14,853,000 |
1.7% |
£14,602,000 |
32.3% |
£11,038,000 |
156% |
£4,311,000 |
8.5% |
£3,973,000 |
|
Audit Fees |
£230,000 |
-0.9% |
£232,000 |
- |
£232,000 |
- |
£232,000 |
4.5% |
£222,000 |
|
Interest Payments |
£2,399,000 |
-37% |
£3,809,000 |
-1.3% |
£3,861,000 |
-61.1% |
£9,936,000 |
-46.7% |
£18,657,000 |
|
Pre Tax Profit |
£19,225,000 |
-44.6% |
£34,690,000 |
7.7% |
£32,202,000 |
107% |
£15,560,000 |
-87.5% |
£124,536,000 |
|
Taxation |
-£3,703,000 |
52.6% |
-£7,818,000 |
-3.3% |
-£7,571,000 |
-649% |
£1,379,000 |
119% |
-£7,243,000 |
|
Profit After Tax |
£15,522,000 |
-42.2% |
£26,872,000 |
9.1% |
£24,631,000 |
45.4% |
£16,939,000 |
-85.6% |
£117,293,000 |
|
Dividends Payable |
- |
- |
- |
- |
- |
-100% |
£12,500,000 |
-84.4% |
£80,000,000 |
|
Retained Profit |
£15,522,000 |
-42.2% |
£26,872,000 |
9.1% |
£24,631,000 |
454.9% |
£4,439,000 |
-88.1% |
£37,293,000 |
Balance Sheet
|
Date Of Accounts |
02/02/13 |
(%) |
28/01/12 |
(%) |
29/01/11 |
(%) |
30/01/10 |
(%) |
31/01/09 |
|
Tangible Assets |
£63,459,000 |
-8.8% |
£69,545,000 |
0.7% |
£69,076,000 |
-70.4% |
£233,121,000 |
-0.4% |
£233,988,000 |
|
Intangible Assets |
£36,474,000 |
-5% |
£38,379,000 |
-4.7% |
£40,284,000 |
- |
0 |
- |
0 |
|
Total Fixed Assets |
£99,933,000 |
-7.4% |
£107,924,000 |
-1.3% |
£109,360,000 |
-53.1% |
£233,121,000 |
-0.4% |
£233,988,000 |
|
Stock |
£167,137,000 |
3.1% |
£162,114,000 |
8.7% |
£149,123,000 |
999.9% |
£5,904,000 |
35.5% |
£4,358,000 |
|
Trade Debtors |
£7,910,000 |
15% |
£6,878,000 |
34.1% |
£5,128,000 |
99.4% |
£2,572,000 |
-9.4% |
£2,839,000 |
|
Cash |
£14,200,000 |
25.3% |
£11,335,000 |
45.2% |
£7,808,000 |
-41.8% |
£13,410,000 |
609.1% |
£1,891,000 |
|
Other Debtors |
£109,290,000 |
-18.2% |
£133,640,000 |
9% |
£122,559,000 |
-43.5% |
£216,757,000 |
0.1% |
£216,563,000 |
|
Miscellaneous Current
Assets |
0 |
- |
0 |
- |
0 |
- |
0 |
- |
0 |
|
Total Current Assets |
£298,537,000 |
-4.9% |
£313,967,000 |
10.3% |
£284,618,000 |
19.3% |
£238,643,000 |
5.8% |
£225,651,000 |
|
Trade Creditors |
£8,904,000 |
-54.3% |
£19,488,000 |
11.8% |
£17,432,000 |
253.2% |
£4,935,000 |
-69.5% |
£16,165,000 |
|
Bank Loans &
Overdrafts |
0 |
-100% |
£6,336,000 |
-50.5% |
£12,806,000 |
-22.6% |
£16,541,000 |
999.9% |
£22,000 |
|
Other Short Term Finance |
£61,312,000 |
3% |
£59,525,000 |
91.2% |
£31,135,000 |
-84.7% |
£203,348,000 |
5.2% |
£193,338,000 |
|
Miscellaneous Current
Liabilities |
£61,691,000 |
0.3% |
£61,477,000 |
1.7% |
£60,422,000 |
97.2% |
£30,646,000 |
19% |
£25,761,000 |
|
Total Current
Liabilities |
£131,907,000 |
-10.2% |
£146,826,000 |
20.6% |
£121,795,000 |
-52.3% |
£255,470,000 |
8.6% |
£235,286,000 |
|
Bank Loans &
Overdrafts and LTL |
£1,812,000 |
-78.3% |
£8,338,000 |
-42.9% |
£14,595,000 |
-25.4% |
£19,569,000 |
112.3% |
£9,216,000 |
|
Other Long Term Finance |
0 |
- |
0 |
- |
0 |
- |
0 |
- |
0 |
|
Total Long Term
Liabilities |
£1,812,000 |
-9.5% |
£2,002,000 |
11.9% |
£1,789,000 |
-40.9% |
£3,028,000 |
-67.1% |
£9,194,000 |
.
Capital & Reserves
|
Date Of Accounts |
02/02/13 |
(%) |
28/01/12 |
(%) |
29/01/11 |
(%) |
30/01/10 |
(%) |
31/01/09 |
|
Called Up Share Capital |
£162,068,000 |
- |
£162,068,000 |
- |
£162,068,000 |
- |
£162,068,000 |
- |
£162,068,000 |
|
P & L Account
Reserve |
£90,990,000 |
-6.8% |
£97,577,000 |
-1.2% |
£98,716,000 |
119.4% |
£44,997,000 |
11.1% |
£40,513,000 |
|
Revaluation Reserve |
£3,047,000 |
-1% |
£3,077,000 |
-1% |
£3,107,000 |
- |
- |
- |
- |
|
Sundry Reserves |
£8,646,000 |
-16.4% |
£10,341,000 |
59% |
£6,503,000 |
4.9% |
£6,201,000 |
-50.7% |
£12,578,000 |
|
Shareholder Funds |
£264,751,000 |
-3% |
£273,063,000 |
1% |
£270,394,000 |
26.8% |
£213,266,000 |
-0.9% |
£215,159,000 |
Other Financial Items
|
Date Of Accounts |
02/02/13 |
(%) |
28/01/12 |
(%) |
29/01/11 |
(%) |
30/01/10 |
(%) |
31/01/09 |
|
Net Worth |
£228,277,000 |
-2.7% |
£234,684,000 |
2% |
£230,110,000 |
7.9% |
£213,266,000 |
-0.9% |
£215,159,000 |
|
Working Capital |
£166,630,000 |
-0.3% |
£167,141,000 |
2.7% |
£162,823,000 |
999.9% |
-£16,827,000 |
-74.6% |
-£9,635,000 |
|
Total Assets |
£398,470,000 |
-5.6% |
£421,891,000 |
7.1% |
£393,978,000 |
-16.5% |
£471,764,000 |
2.6% |
£459,639,000 |
|
Total Liabilities |
£133,719,000 |
-10.2% |
£148,828,000 |
20.4% |
£123,584,000 |
-52.2% |
£258,498,000 |
5.7% |
£244,480,000 |
|
Net Assets |
£264,751,000 |
-3% |
£273,063,000 |
1% |
£270,394,000 |
26.8% |
£213,266,000 |
-0.9% |
£215,159,000 |
Miscellaneous
|
Date Of Accounts |
02/02/13 |
(%) |
28/01/12 |
(%) |
29/01/11 |
(%) |
30/01/10 |
(%) |
31/01/09 |
|
Contingent Liability |
NO |
- |
NO |
- |
NO |
- |
YES |
- |
YES |
|
Capital Employed |
£266,563,000 |
-3.1% |
£275,065,000 |
1.1% |
£272,183,000 |
25.8% |
£216,294,000 |
-3.6% |
£224,353,000 |
|
Number of Employees |
3156 |
-4.2% |
3293 |
-3.1% |
3399 |
-7% |
3656 |
0.8% |
3627 |
|
Auditors |
KPMG AUDIT PLC |
||||||||
|
Auditor Comments |
The audit report
contains no adverse comments |
||||||||
|
Bankers |
BARCLAYS BANK PLC |
||||||||
|
Bank Branch Code |
|
||||||||
Ratios
|
Date Of Accounts |
02/02/13 |
28/01/12 |
29/01/11 |
30/01/10 |
31/01/09 |
|
Pre-tax profit margin % |
4.31 |
7.76 |
7.20 |
13.17 |
110.50 |
|
Current ratio |
2.26 |
2.14 |
2.34 |
0.93 |
0.96 |
|
Sales/Net Working
Capital |
2.68 |
2.67 |
2.75 |
-7.02 |
-11.70 |
|
Gearing % |
0.70 |
3.10 |
5.40 |
9.20 |
4.30 |
|
Equity in % |
73.10 |
71.20 |
76.40 |
45.20 |
46.80 |
|
Creditor Days |
7.40 |
15.87 |
14.19 |
15.20 |
52.20 |
|
Debtor Days |
6.57 |
5.60 |
4.17 |
7.92 |
9.16 |
|
Liquidity/Acid Test |
0.99 |
1.03 |
1.11 |
0.91 |
0.94 |
|
Return On Capital
Employed % |
7.21 |
12.61 |
11.83 |
7.19 |
55.50 |
|
Return On Total Assets
Employed % |
4.82 |
8.22 |
8.17 |
3.29 |
27.09 |
|
Current Debt Ratio |
0.49 |
0.53 |
0.45 |
1.19 |
1.09 |
|
Total Debt Ratio |
0.50 |
0.54 |
0.45 |
1.21 |
1.13 |
|
Stock Turnover Ratio % |
37.45 |
36.27 |
33.35 |
4.99 |
3.86 |
|
Return on Net Assets
Employed % |
7.26 |
12.70 |
11.90 |
7.29 |
57.88 |
FOREIGN EXCHANGE RATES
N/A
ADDITIONAL INFORMATION
Status History
|
No Status History found. |
Event History
|
Date |
Description |
|
05/02/2014 |
Mr M.P. Povall has left the board |
|
05/02/2014 |
New Board Member Mr S.D. Carney appointed |
|
10/09/2013 |
Annual Returns |
|
20/05/2013 |
New Accounts Filed |
|
20/05/2013 |
New Accounts Filed |
|
09/05/2013 |
Mr K.C. Pratt has left the board |
|
09/05/2013 |
New Board Member Mr M.P. Povall appointed |
|
25/01/2013 |
Change in Reg.Office |
|
25/01/2013 |
Change of Company Postcode |
|
28/09/2012 |
New Accounts Filed |
|
28/09/2012 |
New Accounts Filed |
|
17/09/2012 |
Annual Returns |
|
10/09/2011 |
Annual Returns |
|
19/08/2011 |
New Accounts Filed |
|
23/07/2011 |
New Accounts Filed |
Previous Company Names
|
Date |
Previous Name |
|
29/07/1999 |
SIGNET |
|
17/06/1999 |
SIGNET UK JEWELLERY LIMITED |
NOTES & COMMENTS
Commentary
|
CCJ recorded against the
company. |
|
The company saw an
increase in their Cash Balance of 25.3% during the latest trading period. |
|
The audit report
contains no adverse comments. |
|
The company has
undergone recent changes in its directorships. |
|
Sales in the latest
trading period decreased 0.2% on the previous trading period. |
|
Net Worth decreased by
2.7% during the latest trading period. |
|
A 5.6% decline in Total
Assets occurred during the latest trading period. |
|
Pre-tax profits decreased
by 44.6% compared to the previous trading period. |
|
The company is part of a
group. |
|
The company has changed
its registered address recently. |
|
The company was
established over 15 years ago. |
FOREIGN EXCHANGE RATES
|
Currency |
Unit
|
Indian Rupees |
|
US Dollar |
1 |
Rs.60.84 |
|
|
1 |
Rs.98.73 |
|
Euro |
1 |
Rs.78.64 |
INFORMATION DETAILS
|
Analysis Done by
: |
SUM |
|
|
|
|
Report Prepared
by : |
NIT |
RATING EXPLANATIONS
|
RATING |
STATUS |
PROPOSED CREDIT LINE |
|
|
>86 |
Aaa |
Possesses an extremely sound financial base with the strongest
capability for timely payment of interest and principal sums |
Unlimited |
|
71-85 |
Aa |
Possesses adequate working capital. No caution needed for credit transaction.
It has above average (strong) capability for payment of interest and
principal sums |
Large |
|
56-70 |
A |
Financial & operational base are regarded healthy. General unfavourable
factors will not cause fatal effect. Satisfactory capability for payment of
interest and principal sums |
Fairly Large |
|
41-55 |
Ba |
Overall operation is considered normal. Capable to meet normal
commitments. |
Satisfactory |
|
26-40 |
B |
Capability to overcome financial difficulties seems comparatively
below average. |
Small |
|
11-25 |
Ca |
Adverse factors are apparent. Repayment of interest and principal sums
in default or expected to be in default upon maturity |
Limited with full
security |
|
<10 |
C |
Absolute credit risk exists. Caution needed to be exercised |
Credit not
recommended |
|
-- |
NB |
New Business |
-- |
This score serves as a reference to assess SC’s credit risk and
to set the amount of credit to be extended. It is calculated from a composite
of weighted scores obtained from each of the major sections of this report. The
assessed factors and their relative weights (as indicated through %) are as
follows:
Financial
condition (40%) Ownership
background (20%) Payment
record (10%)
Credit history
(10%) Market trend
(10%) Operational
size (10%)
This report is issued at your request without any
risk and responsibility on the part of MIRA INFORM PRIVATE LIMITED (MIPL)
or its officials.