MIRA
INFORM REPORT
|
Report Date : |
13.09.2014 |
IDENTIFICATION DETAILS
|
Name : |
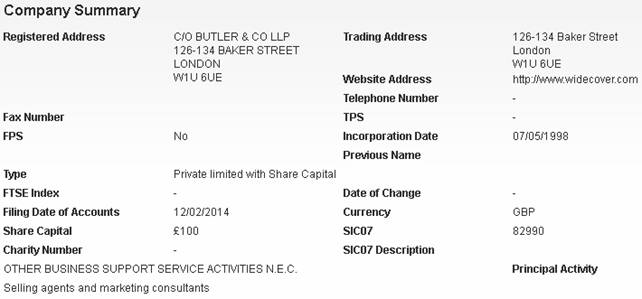
WIDECOVER LIMITED |
|
|
|
|
Registered Office : |
C/O Butler & Co. LLP 126-134, |
|
|
|
|
Country : |
|
|
|
|
|
Financials (as on) : |
31.05.2013 |
|
|
|
|
Date of Incorporation : |
07.05.1998 |
|
|
|
|
Legal Form : |
Private Limited With Share Capital |
|
|
|
|
Line of Business : |
Selling Agents and Marketing Consultants. |
|
|
|
|
No of Employees : |
Not Available |
RATING & COMMENTS
|
MIRA’s Rating : |
Ba |
|
RATING |
STATUS |
PROPOSED CREDIT LINE |
|
|
41-55 |
Ba |
Overall operation is considered normal. Capable to meet normal
commitments. |
Satisfactory |
|
Status : |
Satisfactory |
|
Payment Behaviour : |
No Complaints |
|
Litigation : |
Clear |
NOTES :
Any query related to this report can be made
on e-mail : infodept@mirainform.com
while quoting report number, name and date.
ECGC Country Risk Classification List – June 01, 2014
|
Country Name |
Previous Rating (31.03.2014) |
Current Rating (01.06.2014) |
|
|
A1 |
A1 |
|
Risk Category |
ECGC
Classification |
|
Insignificant |
A1 |
|
Low Risk |
A2 |
|
Moderate Low Risk |
B1 |
|
Moderate Risk |
B2 |
|
Moderate High Risk |
C1 |
|
High Risk |
C2 |
|
Very High Risk |
D |
The
|
Source
: CIA |
REGISTERED NAME & COMPANY
SUMMARY
WIDECOVER LIMITED
Office Address
DIRECTORS/MANAGEMENT
CURRENT DIRECTORS
|
Name |
Gurvinder Singh |
Date of Birth |
05/05/1963 |
|
Officers Title |
Mr |
Nationality |
British |
|
Present Appointments |
1 |
Function |
Director |
|
Appointment Date |
01/06/1998 |
|
|
|
Address |
126 - 134, |
||
|
Name |
Monica Walia |
Date of Birth |
15/12/1968 |
|
Officers Title |
Mrs |
Nationality |
British |
|
Present Appointments |
2 |
Function |
Director |
|
Appointment Date |
22/03/2004 |
|
|
|
Address |
126 - 134, |
||
CURRENT COMPANY
SECRETARY
|
Name |
Monica Walia |
Date of Birth |
15/12/1968 |
|
Officers Title |
Mrs |
Nationality |
British |
|
Present Appointments |
2 |
Function |
Company Secretary |
|
Appointment Date |
01/06/1998 |
|
|
|
Address |
126 - 134, |
||
PREVIOUS
DIRECTOR/COMPANY SECRETARIES
|
Name |
Current Directorships |
Previous Directorships |
|
BONUSWORTH LIMITED |
152 |
4869 |
|
RWL REGISTRARS LIMITED |
484 |
13046 |
NEGATIVE INFORMATION
Mortgage Summary
Total Mortgage 2
Outstanding 1
Satisfied 1
Trade Debtors / Bad Debt Summary
Total Number of Documented Trade
0
Total Value of Documented Trade
£0
CCJ
|
Total Number of Exact CCJs - |
0 |
Total Value of Exact CCJs - |
|
|
Total Number of Possible CCJs - |
0 |
Total Value of Possible CCJs - |
|
|
Total Number of Satisfied CCJs - |
0 |
Total Value of Satisfied CCJs - |
|
|
Total Number of Writs - |
- |
|
|
EXACT CCJ DETAILS
|
No CCJs found. |
POSSIBLE CCJS
DETAILS
|
There are no possible CCJ details. |
WRIT DETAILS
|
No writs found. |
MORTGAGE DETAILS
|
Mortgage Type: |
DEBENTURE |
||
|
Date Charge Created: |
06/02/09 |
|
|
|
Date Charge Registered: |
12/02/09 |
|
|
|
Date Charge Satisfied: |
- |
|
|
|
Status: |
OUTSTANDING |
|
|
|
Person(s) Entitled: |
HSBC BANK PLC |
||
|
Amount Secured: |
ALL MONIES DUE OR TO BECOME DUE FROM THE COMPANY TO THE CHARGEE ON ANY
ACCOUNT WHATSOEVER |
||
|
Details: |
FIXED AND FLOATING CHARGE OVER THE UNDERTAKING AND ALL PROPERTY AND
ASSETS PRESENT AND FUTURE, INCLUDING GOODWILL, BOOKDEBTS, UNCALLED CAPITAL, BUILDINGS,
FIXTURES, FIXED PLANT & MACHINERY |
||
|
Mortgage Type: |
DEBENTURE |
||
|
Date Charge Created: |
10/07/08 |
|
|
|
Date Charge Registered: |
15/07/08 |
|
|
|
Date Charge Satisfied: |
06/03/10 |
|
|
|
Status: |
SATISFIED |
|
|
|
Person(s) Entitled: |
BARCLAYS BANK PLC |
||
|
Amount Secured: |
ALL MONIES DUE OR TO BECOME DUE FROM THE COMPANY TO THE CHARGEE ON ANY
ACCOUNT WHATSOEVER |
||
|
Details: |
FIXED AND FLOATING CHARGE OVER THE UNDERTAKING AND ALL PROPERTY AND ASSETS
PRESENT AND FUTURE, INCLUDING GOODWILL, BOOKDEBTS, UNCALLED CAPITAL,
BUILDINGS, FIXTURES, FIXED PLANT & MACHINERY |
||
SHARE & SHARE CAPITAL
INFORMATION
TOP 20
SHAREHOLDERS
|
Name |
Currency |
Share Count |
Share Type |
Nominal Value |
% of Total Share Count |
|
MRS MONICA WALIA |
GBP |
50 |
ORDINARY |
1 |
50 |
|
GURVINDER SINGH |
GBP |
50 |
ORDINARY |
1 |
50 |
GROUP STRUCTURE & AFFILIATED
COMPANIES
GROUP STRUCTURE
|
FINANCIAL INFORMATION
PROFIT & LOSS
|
Date Of Accounts |
31/05/13 |
(%) |
31/05/12 |
(%) |
31/05/11 |
(%) |
31/05/10 |
(%) |
31/05/09 |
|
Weeks |
52 |
(%) |
52 |
(%) |
52 |
(%) |
52 |
(%) |
52 |
|
Currency |
GBP |
(%) |
GBP |
(%) |
GBP |
(%) |
GBP |
(%) |
GBP |
|
Consolidated A/cs |
N |
(%) |
N |
(%) |
N |
(%) |
N |
(%) |
N |
|
Turnover |
- |
- |
- |
- |
- |
- |
- |
- |
- |
|
Export |
- |
- |
- |
- |
- |
- |
- |
- |
- |
|
Cost of Sales |
- |
- |
- |
- |
- |
- |
- |
- |
- |
|
Gross Profit |
- |
- |
- |
- |
- |
- |
- |
- |
- |
|
Wages & Salaries |
- |
- |
- |
- |
- |
- |
- |
- |
- |
|
Directors Emoluments |
- |
- |
- |
- |
- |
- |
- |
- |
- |
|
Operating Profit |
- |
- |
- |
- |
- |
- |
- |
- |
- |
|
Depreciation |
£207 |
0.5% |
£206 |
-81.5% |
£1,112 |
2.2% |
£1,088 |
-18.6% |
£1,336 |
|
Audit Fees |
- |
- |
- |
- |
- |
- |
- |
- |
- |
|
Interest Payments |
- |
- |
- |
- |
- |
- |
- |
- |
- |
|
Pre Tax Profit |
- |
- |
- |
- |
- |
- |
- |
- |
- |
|
Taxation |
- |
- |
- |
- |
- |
- |
- |
- |
- |
|
Profit After Tax |
- |
- |
- |
- |
- |
- |
- |
- |
- |
|
Dividends Payable |
- |
- |
- |
- |
- |
- |
- |
- |
- |
|
Retained Profit |
- |
- |
- |
- |
- |
- |
- |
- |
- |
BALANCE SHEET
|
Date Of Accounts |
31/05/13 |
(%) |
31/05/12 |
(%) |
31/05/11 |
(%) |
31/05/10 |
(%) |
31/05/09 |
|
Tangible Assets |
£1,575 |
-11.6% |
£1,782 |
187.4% |
£620 |
-31.5% |
£905 |
-54.6% |
£1,993 |
|
Intangible Assets |
0 |
- |
0 |
- |
0 |
- |
0 |
- |
0 |
|
Total Fixed Assets |
£1,575 |
-11.6% |
£1,782 |
187.4% |
£620 |
-31.5% |
£905 |
-54.6% |
£1,993 |
|
Stock |
£187,519 |
-68.1% |
£588,752 |
2.8% |
£572,705 |
-14.1% |
£667,025 |
303.3% |
£165,409 |
|
Trade Debtors |
£989,079 |
-20.9% |
£1,250,412 |
-23.1% |
£1,625,784 |
3.1% |
£1,577,203 |
179.9% |
£563,528 |
|
Cash |
£773,235 |
380.2% |
£161,007 |
-70.6% |
£547,661 |
71.6% |
£319,201 |
-68% |
£998,732 |
|
Other Debtors |
0 |
- |
0 |
- |
0 |
- |
0 |
- |
0 |
|
Miscellaneous Current Assets |
0 |
- |
0 |
- |
0 |
-100% |
£50,000 |
-39.7% |
£82,984 |
|
Total Current Assets |
£1,949,833 |
-2.5% |
£2,000,171 |
-27.2% |
£2,746,150 |
5.1% |
£2,613,429 |
44.3% |
£1,810,653 |
|
Trade Creditors |
£1,397,420 |
-7.8% |
£1,514,880 |
-33% |
£2,259,941 |
3.8% |
£2,176,468 |
50.6% |
£1,445,577 |
|
Bank Loans & Overdrafts |
0 |
- |
0 |
- |
0 |
- |
0 |
- |
0 |
|
Other Short Term Finance |
0 |
- |
0 |
- |
0 |
- |
0 |
- |
0 |
|
Miscellaneous Current Liabilities |
0 |
- |
0 |
- |
0 |
- |
0 |
- |
0 |
|
Total Current Liabilities |
£1,397,420 |
-7.8% |
£1,514,880 |
-33% |
£2,259,941 |
3.8% |
£2,176,468 |
50.6% |
£1,445,577 |
|
Bank Loans & Overdrafts and LTL |
0 |
- |
0 |
- |
0 |
- |
0 |
- |
0 |
|
Other Long Term Finance |
0 |
- |
0 |
- |
0 |
- |
0 |
- |
0 |
|
Total Long Term Liabilities |
0 |
- |
0 |
- |
0 |
- |
0 |
- |
0 |
CAPITAL &
RESERVES
|
Date Of Accounts |
31/05/13 |
(%) |
31/05/12 |
(%) |
31/05/11 |
(%) |
31/05/10 |
(%) |
31/05/09 |
|
Called Up Share Capital |
£100 |
- |
£100 |
- |
£100 |
- |
£100 |
- |
£100 |
|
P & L Account Reserve |
£553,888 |
13.7% |
£486,973 |
0.1% |
£486,729 |
11.2% |
£437,766 |
19.3% |
£366,969 |
|
Revaluation Reserve |
- |
- |
- |
- |
- |
- |
- |
- |
- |
|
Sundry Reserves |
- |
- |
- |
- |
- |
- |
- |
- |
- |
|
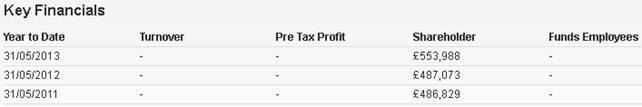
Shareholder Funds |
£553,988 |
13.7% |
£487,073 |
0.1% |
£486,829 |
11.2% |
£437,866 |
19.3% |
£367,069 |
OTHER FINANCIAL
ITEMS
|
Date Of Accounts |
31/05/13 |
(%) |
31/05/12 |
(%) |
31/05/11 |
(%) |
31/05/10 |
(%) |
31/05/09 |
|
Net Worth |
£553,988 |
13.7% |
£487,073 |
0.1% |
£486,829 |
11.2% |
£437,866 |
19.3% |
£367,069 |
|
Working Capital |
£552,413 |
13.8% |
£485,291 |
-0.2% |
£486,209 |
11.3% |
£436,961 |
19.7% |
£365,076 |
|
Total Assets |
£1,951,408 |
-2.5% |
£2,001,953 |
-27.1% |
£2,746,770 |
5.1% |
£2,614,334 |
44.2% |
£1,812,646 |
|
Total Liabilities |
£1,397,420 |
-7.8% |
£1,514,880 |
-33% |
£2,259,941 |
3.8% |
£2,176,468 |
50.6% |
£1,445,577 |
|
Net Assets |
£553,988 |
13.7% |
£487,073 |
0.1% |
£486,829 |
11.2% |
£437,866 |
19.3% |
£367,069 |
CASH FLOW
|
Date Of Accounts |
31/05/13 |
(%) |
31/05/12 |
(%) |
31/05/11 |
(%) |
31/05/10 |
(%) |
31/05/09 |
|
Net Cashflow from Operations |
- |
- |
- |
- |
- |
- |
- |
- |
- |
|
Net Cashflow before Financing |
- |
- |
- |
- |
- |
- |
- |
- |
- |
|
Net Cashflow from Financing |
- |
- |
- |
- |
- |
- |
- |
- |
- |
|
Increase in Cash |
- |
- |
- |
- |
- |
- |
- |
- |
- |
MISCELLANEOUS
|
Date Of Accounts |
31/05/13 |
(%) |
31/05/12 |
(%) |
31/05/11 |
(%) |
31/05/10 |
(%) |
31/05/09 |
|
Contingent Liability |
NO |
- |
NO |
- |
NO |
- |
NO |
- |
NO |
|
Capital Employed |
£553,988 |
13.7% |
£487,073 |
0.1% |
£486,829 |
11.2% |
£437,866 |
19.3% |
£367,069 |
|
Number of Employees |
- |
- |
- |
- |
- |
- |
- |
- |
- |
|
Auditors |
|
||||||||
|
Auditor Comments |
The company is exempt from audit |
||||||||
|
Bankers |
|
||||||||
|
Bank Branch Code |
|
||||||||
RATIOS
|
Date Of Accounts |
31/05/13 |
31/05/12 |
31/05/11 |
31/05/10 |
31/05/09 |
|
Pre-tax profit margin % |
- |
- |
- |
- |
- |
|
Current ratio |
1.40 |
1.32 |
1.22 |
1.20 |
1.25 |
|
Sales/Net Working Capital |
- |
- |
- |
- |
- |
|
Gearing % |
0 |
0 |
0 |
0 |
0 |
|
Equity in % |
28.40 |
24.30 |
17.70 |
16.70 |
20.30 |
|
Creditor Days |
- |
- |
- |
- |
- |
|
Debtor Days |
- |
- |
- |
- |
- |
|
Liquidity/Acid Test |
1.26 |
0.93 |
0.96 |
0.89 |
1.13 |
|
Return On Capital Employed % |
- |
- |
- |
- |
- |
|
Return On Total Assets Employed % |
- |
- |
- |
- |
- |
|
Current Debt Ratio |
2.52 |
3.11 |
4.64 |
4.97 |
3.93 |
|
Total Debt Ratio |
2.52 |
3.11 |
4.64 |
4.97 |
3.93 |
|
Stock Turnover Ratio % |
- |
- |
- |
- |
- |
|
Return on Net Assets Employed % |
- |
- |
- |
- |
- |
FOREIGN EXCHANGE RATES
N/A
ADDITIONAL INFORMATION
Status History
|
No Status History found. |
PREVIOUS COMPANY
NAMES
|
No Previous Names found. |
NOTES & COMMENTS
COMMENTARY
|
No exact match CCJs are recorded against the company. |
|
|
Net Worth increased by 13.7% during the latest trading period. |
|
|
The company saw an increase in their Cash Balance of 380.2% during the
latest trading period. |
|
|
The movement in accumulated earnings would indicate that the company
made a profit after tax and other appropriations, including dividends. |
|
|
There has been no significant change in the company's credit rating. |
|
|
There is insufficient data to indicate a change in this company's
percentage of sales. |
|
|
A 2.5% decline in Total Assets occurred during the latest trading
period. |
|
|
There is insufficient data to indicate a change in this company's
pre-tax profit. |
|
|
The company is exempt from audit. |
|
|
No recent changes in directorship are recorded. |
|
|
The company is not part of a group. |
|
|
The company was established over 16 years ago. |
|
FOREIGN EXCHANGE RATES
|
Currency |
Unit
|
Indian Rupees |
|
US Dollar |
1 |
Rs.60.91 |
|
|
1 |
Rs.98.65 |
|
Euro |
1 |
Rs.78.64 |
INFORMATION DETAILS
|
Analysis Done by
: |
SUM |
|
|
|
|
Report Prepared
by : |
TPT |
RATING EXPLANATIONS
|
RATING |
STATUS |
PROPOSED CREDIT LINE |
|
|
>86 |
Aaa |
Possesses an extremely sound financial base with the strongest
capability for timely payment of interest and principal sums |
Unlimited |
|
71-85 |
Aa |
Possesses adequate working capital. No caution needed for credit
transaction. It has above average (strong) capability for payment of interest
and principal sums |
Large |
|
56-70 |
A |
Financial & operational base are regarded healthy. General
unfavourable factors will not cause fatal effect. Satisfactory capability for
payment of interest and principal sums |
Fairly Large |
|
41-55 |
Ba |
Overall
operation is considered normal. Capable to meet normal commitments. |
Satisfactory |
|
26-40 |
B |
Capability to overcome financial difficulties seems comparatively below
average. |
Small |
|
11-25 |
Ca |
Adverse factors are apparent. Repayment of interest and principal sums
in default or expected to be in default upon maturity |
Limited with
full security |
|
<10 |
C |
Absolute credit risk exists. Caution needed to be exercised |
Credit not
recommended |
|
-- |
NB |
New Business |
-- |
This score serves as a reference to assess SC’s credit risk and
to set the amount of credit to be extended. It is calculated from a composite
of weighted scores obtained from each of the major sections of this report. The
assessed factors and their relative weights (as indicated through %) are as
follows:
Financial
condition (40%) Ownership
background (20%) Payment
record (10%)
Credit history
(10%) Market trend
(10%) Operational
size (10%)
This report is issued at your request without any
risk and responsibility on the part of MIRA INFORM PRIVATE LIMITED (MIPL)
or its officials.