![]()
MIRA INFORM REPORT
|
Report Date : |
16.09.2014 |
IDENTIFICATION DETAILS
|
Name : |
EMERSON PROCESS MANAGEMENT FLOW B.V. |
|
|
|
|
Registered Office : |
Neonstraat 1 6718WX |
|
|
|
|
Country : |
|
|
|
|
|
Financials (as on) : |
2012 |
|
|
|
|
Date of Incorporation : |
15.06.2004 |
|
|
|
|
Com. Reg. No.: |
30196818 |
|
|
|
|
Legal Form : |
Private Company |
|
|
|
|
Line of Business : |
Manufacture of instruments for measuring, testing, navigation and controlling (2651) |
|
|
|
|
No. of Employees |
178 |
RATING & COMMENTS
|
MIRA’s Rating : |
Ba |
|
RATING |
STATUS |
PROPOSED CREDIT LINE |
|
|
41-55 |
Ba |
Overall operation is considered normal. Capable to meet normal
commitments. |
Satisfactory |
|
Status : |
Satisfactory |
|
|
|
|
Payment Behaviour : |
Slow but Correct |
|
|
|
|
Litigation : |
Clear |
NOTES :
Any query related to this report can be made
on e-mail : infodept@mirainform.com
while quoting report number, name and date.
ECGC Country Risk Classification List – June 1, 2014
|
Country Name |
Previous Rating (31.03.2014) |
Current Rating (01.06.2014) |
|
|
A1 |
A1 |
|
Risk Category |
ECGC Classification |
|
Insignificant |
A1 |
|
Low |
A2 |
|
Moderate |
B1 |
|
High |
B2 |
|
Very High |
C1 |
|
Restricted |
C2 |
|
Off-credit |
D |
|
Source
: CIA |
Summary
Company name EMERSON PROCESS MANAGEMENT FLOW B.V.
Operative address Neonstraat 1
6718WX
Legal form Private Company
Registration number 30196818
VAT-number 813279276
|
Year |
2012 |
|
Mutation |
2011 |
|
Mutation |
2010 |
|
Fixed
assets |
563.409.000 |
|
-4,79 |
591.780.000 |
|
-4,98 |
622.812.000 |
|
Total
receivables |
289.941.000 |
|
19,41 |
242.812.000 |
|
9,99 |
220.761.000 |
|
|
|||||||
|
Total
equity |
189.139.000 |
|
-22,34 |
243.556.000 |
t |
26,53 |
192.495.000 |
|
Short
term liabilities |
790.501.000 |
|
14,15 |
692.481.000 |
|
-2,05 |
706.975.000 |
|
|
|||||||
|
Net
result |
42.675.000 |
% |
-15,57 |
50.547.000 |
t |
141,01 |
20.973.000 |
|
|
|||||||
|
Working
capital |
-263.086.000 |
% |
-18,65 |
-221.731.000 |
|
23,26 |
-288.920.000 |
|
Quick
ratio |
0,49 |
% |
-2,00 |
0,50 |
|
19,05 |
0,42 |
Contact information
Company name Emerson Process Management Flow B.V.
Trade names Emerson Process Management Flow B.V.
Operative address Neonstraat 1
6718WX
Correspondence address Postbus 286
6710BG
Telephone number 0318495555
Fax number 0318495556
Website www.emersonproces.eu
Registration
Registration number 30196818
Branch number 000017771382
VAT-number 813279276
Status Active
First registration company register 2004-07-06
Memorandum 2004-06-25
Establishment date 2004-06-15
Legal form Private Company
Legal person since 2004-06-26
Activities
SBI Machining (2562)
Manufacture of instruments for measuring, testing, navigation and controlling (2651)
Exporter No
Importer No
Goal The welding process connections, assembling, configuring and calibrating and trading, flow meters, and to undertake marketing and sales activities for the previously reported actions.
Relations
Shareholders EMRSN HLDG B.V.
Teleportboulevard 140
1043EJ
Registration number: 300342890000
Percentage: 100%
Companies on same address Personeelsvereniging 'Emerson'
Registration number: 091920430000
Liability statements Emerson Electric Nederland B.V.
Teleportboulevard 140
1043EJ
Registration number: 310399390000
date of issue: 2004-10-29
Starting date: 2004-10-26
Management
Active management P.J.M.M. Peters (Petrus Joannes Martinus Maria)
Competence: Fully authorized
Function: Manager
Starting date: 2009-08-01
Date of birth: 1957-06-29, Overasselt, NL
H. van Doornspeek (Hijmen)
Competence: Fully authorized
Function: Manager
Starting date: 2010-10-01
Date of birth: 1962-11-22, Rhenen, NL
G.J. Bouw (Gerhard Jan)
Competence: Fully authorized
Function: Manager
Starting date: 2010-10-01
Date of birth: 1975-05-23,
P.J.H. van Gastel (Petrus Joannes Henricus)
Competence: Fully authorized
Function: Manager
Starting date: 2012-12-01
Date of birth: 1965-10-02, Veldhoven, NL
J. van den Brink (Johanna)
Competence: Limited authorization
Function: Proxy
Starting date: 2012-08-01
Date of birth: 1966-10-08, Barneveld, NL
J.J.K. Pieters - Oosterbeek (Jolanda Jeanette Klasina)
Competence: Limited authorization
Function: Proxy
Starting date: 2013-10-01
Date of birth: 1968-07-07,
Competence: Limited authorization
Function: Proxy
Starting date: 2013-10-01
Date of birth: 1981-05-06,
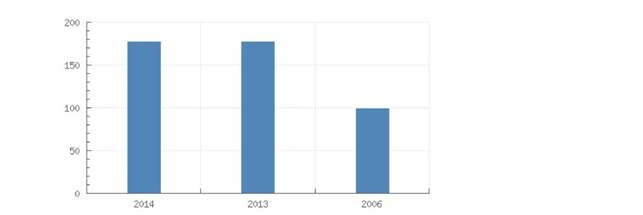
Employees
Total according to the Chamber of Commerce 178
|
Year |
2014 |
2013 |
2006 |
|
Total |
178 |
178 |
100 |
Payments
Description Payments made under regular condition
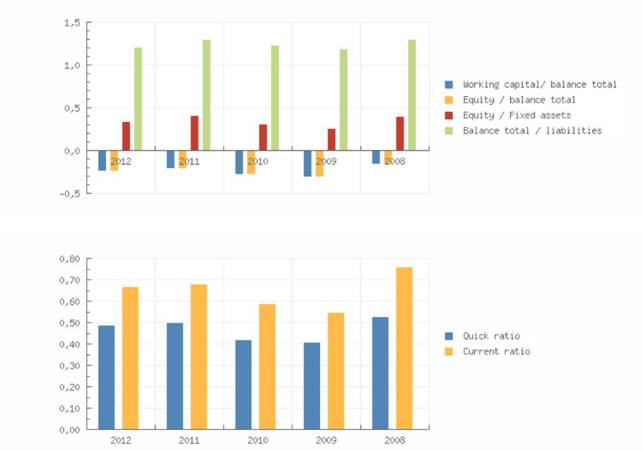
Key figures
|
Year |
2012 |
2011 |
2010 |
2009 |
2008 |
|
Quick
ratio |
0,49 |
0,50 |
0,42 |
0,41 |
0,53 |
|
Current
ratio |
0,67 |
0,68 |
0,59 |
0,55 |
0,76 |
|
|
|||||
|
Working
capital/ balance total |
-0,24 |
-0,21 |
-0,28 |
-0,31 |
-0,16 |
|
Equity
/ balance total |
0,17 |
0,23 |
0,18 |
0,16 |
0,19 |
|
Equity
/ Fixed assets |
0,34 |
0,41 |
0,31 |
0,26 |
0,40 |
|
Equity
/ liabilities |
0,21 |
0,30 |
0,23 |
0,19 |
0,25 |
|
Balance
total / liabilities |
1,21 |
1,30 |
1,23 |
1,19 |
1,30 |
|
|
|||||
|
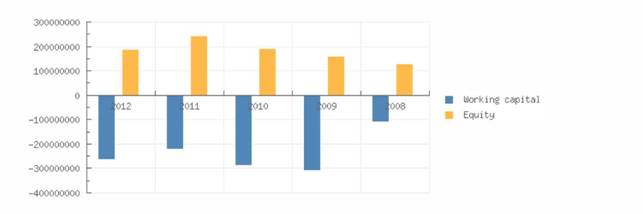
Working
capital |
-263.086.000 |
-221.731.000 |
-288.920.000 |
-308.420.000 |
-109.203.000 |
|
Equity |
189.139.000 |
243.556.000 |
192.495.000 |
160.003.000 |
129.034.000 |
|
Mutation
equity |
-22,34 |
26,53 |
20,31 |
24,00 |
31,80 |
|
Mutation
short term liabilities |
14,15 |
-2,05 |
3,12 |
50,16 |
7,36 |
|
|
|||||
|
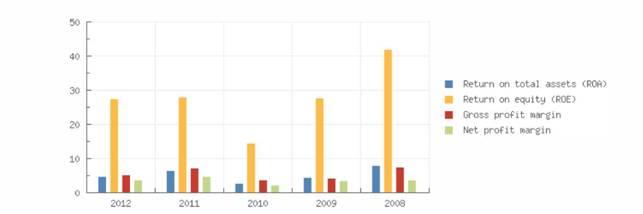
Return
on total assets (ROA) |
4,75 |
6,42 |
2,70 |
4,43 |
8,11 |
|
Return
on equity (ROE) |
27,40 |
28,01 |
14,58 |
27,69 |
41,97 |
|
Gross
profit margin |
5,37 |
7,18 |
3,63 |
4,24 |
7,57 |
|
Net
profit margin |
3,87 |
4,66 |
2,15 |
3,52 |
3,68 |
|
|
|||||
|
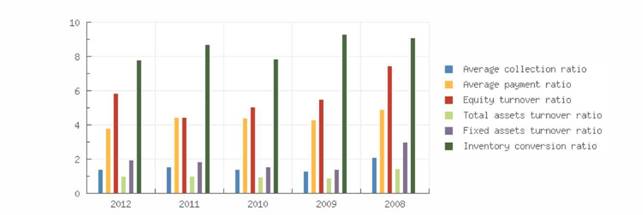
Average
collection ratio |
1,39 |
1,57 |
1,38 |
1,28 |
2,10 |
|
Average
payment ratio |
3,80 |
4,46 |
4,42 |
4,30 |
4,89 |
|
Equity
turnover ratio |
5,83 |
4,45 |
5,06 |
5,50 |
7,43 |
|
Total
assets turnover ratio |
1,01 |
1,02 |
0,94 |
0,88 |
1,44 |
|
Fixed
assets turnover ratio |
1,96 |
1,83 |
1,57 |
1,41 |
2,99 |
|
Inventory
conversion ratio |
7,82 |
8,72 |
7,85 |
9,28 |
9,09 |
|
|
|||||
|
Turnover |
1.102.050.000 |
1.083.838.000 |
974.975.000 |
879.782.000 |
959.337.000 |
|
Year |
2012 |
2011 |
2010 |
2009 |
2008 |
|
Gross
margin |
369.501.000 |
340.162.000 |
309.858.000 |
261.786.000 |
|
|
Operating
result |
59.233.000 |
77.839.000 |
35.368.000 |
37.321.000 |
72.603.000 |
|
Net
result after taxes |
42.675.000 |
50.547.000 |
20.973.000 |
30.960.000 |
35.330.000 |
|
|
|||||
|
Gross
profit |
|
|
|
|
959.337.000 |
|
EBIT |
59.233.000 |
77.839.000 |
35.368.000 |
37.321.000 |
72.603.000 |
Summary The 2012 financial result structure is a negative working captial of
-263.086.000 euro, which is in agreement with -24 % of the total assets of the
company.
The working capital
has diminished with -18.65 % compared to previous year. The ratio, with respect
to the total assets of the company has however, declined.
The deterioration
between 2011 and 2012 has mainly been caused by an increase of the current
liabilities.
The current ratio
of the company in 2012 was 0.67. When the current ratio is below 1.5, the
company may have problems meeting its short-term obligations.
The quick ratio in
2012 of the company was 0.49. A company with a Quick Ratio of less than 1
cannot currently pay back its current liabilities.
The 2011 financial
result structure is a negative working captial of -221.731.000 euro, which is
in agreement with -21 % of the total assets of the company.
The working
capital has increased with 23.26 % compared to previous year. The ratio, with
respect to the total assets of the company has however, increased.
The improvement
between 2010 and 2011 has mainly been caused by an increase of the current
assets.
The current ratio
of the company in 2011 was 0.68. When the current ratio is below 1.5, the
company may have problems meeting its short-term obligations.
The quick ratio in
2011 of the company was 0.5. A company with a Quick Ratio of less than 1 cannot
currently pay back its current liabilities.
Financial statement
Remark annual
account The financial
statements shown in the report relate to the consolidated financial statements
of the group.
Type of annual account Consolidated
Annual account Emerson
Electric
Teleportboulevard
140
1043EJ
Registration number: 310399390000
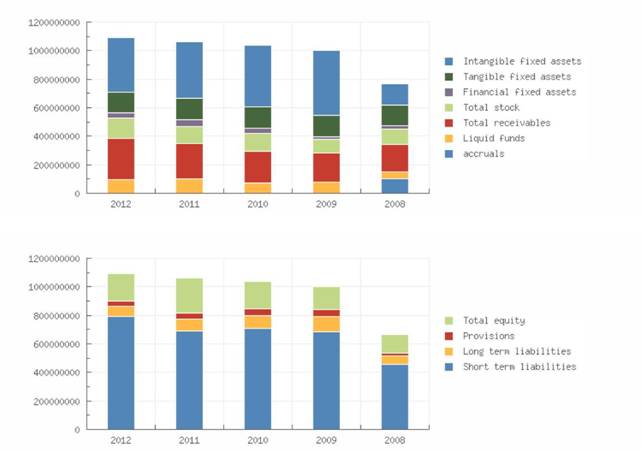
Balance
|
Year |
2012 |
2011 |
2010 |
2009 |
2008 |
|
End
date |
2012-09-30 |
2011-09-30 |
2010-09-30 |
2009-09-30 |
2008-09-30 |
|
Intangible
fixed assets |
383.519.000 |
396.044.000 |
432.135.000 |
450.607.000 |
151.217.000 |
|
Other
tangible fixed assets |
|
|
|
|
146.862.000 |
|
Tangible
fixed assets |
142.469.000 |
150.237.000 |
152.053.000 |
153.421.000 |
146.862.000 |
|
Other
financial fixed assets |
|
|
|
|
22.656.000 |
|
Financial
fixed assets |
37.421.000 |
45.499.000 |
38.624.000 |
18.089.000 |
22.656.000 |
|
Fixed
assets |
563.409.000 |
591.780.000 |
622.812.000 |
622.117.000 |
320.735.000 |
|
|
|||||
|
Other
stock |
|
|
|
|
105.518.000 |
|
Total
stock |
141.016.000 |
124.341.000 |
124.277.000 |
94.794.000 |
105.518.000 |
|
Accounts
receivable |
116.204.000 |
120.711.000 |
120.022.000 |
104.955.000 |
94.230.000 |
|
Other
receivables |
173.737.000 |
122.101.000 |
100.739.000 |
99.629.000 |
102.041.000 |
|
Total
receivables |
289.941.000 |
242.812.000 |
220.761.000 |
204.584.000 |
196.271.000 |
|
Liquid
funds |
96.458.000 |
103.597.000 |
73.017.000 |
77.786.000 |
45.588.000 |
|
accruals |
|
|
|
|
102.041.000 |
|
Current
assets |
527.415.000 |
470.750.000 |
418.055.000 |
377.164.000 |
347.377.000 |
|
Total
assets |
1.090.824.000 |
1.062.530.000 |
1.040.867.000 |
999.281.000 |
668.112.000 |
|
|
|||||
|
Other
reserves |
|
|
|
|
129.034.000 |
|
Total
reserves |
|
|
|
|
129.034.000 |
|
Minority
interests |
|
|
|
|
3.055.000 |
|
Total
equity |
189.139.000 |
243.556.000 |
192.495.000 |
160.003.000 |
129.034.000 |
|
|
|||||
|
Provisions |
35.776.000 |
45.735.000 |
49.800.000 |
46.906.000 |
21.932.000 |
|
Long
term interest yielding debt |
75.408.000 |
80.758.000 |
91.597.000 |
106.788.000 |
|
|
Other
long term liabilities |
|
|
|
|
57.511.000 |
|
Long
term liabilities |
75.408.000 |
80.758.000 |
91.597.000 |
106.788.000 |
57.511.000 |
|
Accounts
payable |
|
104.926.000 |
|
|
|
|
Other
short term liabilities |
|
587.555.000 |
|
|
456.580.000 |
|
Short
term liabilities |
790.501.000 |
692.481.000 |
706.975.000 |
685.584.000 |
456.580.000 |
|
Total
short and long term liabilities |
901.685.000 |
818.974.000 |
848.372.000 |
839.278.000 |
514.091.000 |
|
Total
liabilities |
1.090.824.000 |
1.062.530.000 |
1.040.867.000 |
999.281.000 |
668.112.000 |
Summary The total assets of the company increased with 2.66 % between 2011 and
2012.
Despite the assets
growth, the non current assets decreased with -4.79 %.
Asset growth is in
contrasts with the net worth decline of -22.34 %. The company's indebtedness
has, therefore, increased with 10.1 %.
In 2012 the assets
of the company were 51.65 % composed of fixed assets and 48.35 % by current
assets. The assets are being financed by an equity of 17.34 %, and total debt
of 82.66 %.
The total assets
of the company increased with 2.08 % between 2010 and 2011.
Despite the assets
growth, the non current assets decreased with -4.98 %.
The assets growth
has been financed by a Net Worth increase of 26.53 %. The company's net
increase has also covered a reduction of -3.47 % of the company's indebtedness.
In 2011 the assets
of the company were 55.7 % composed of fixed assets and 44.3 % by current
assets. The assets are being financed by an equity of 22.92 %, and total debt
of 77.08 %.
|
Year |
2012 |
2011 |
2010 |
2009 |
2008 |
|
Revenues |
1.102.050.000 |
1.083.838.000 |
974.975.000 |
879.782.000 |
959.337.000 |
|
Net
turnover |
1.102.050.000 |
1.083.838.000 |
974.975.000 |
879.782.000 |
959.337.000 |
|
|
|||||
|
Gross
margin |
369.501.000 |
340.162.000 |
309.858.000 |
261.786.000 |
|
|
|
|||||
|
Wages
and salaries |
200.632.000 |
160.761.000 |
157.827.000 |
154.085.000 |
127.065.000 |
|
Sales |
732.549.000 |
743.676.000 |
665.117.000 |
617.996.000 |
|
|
other
operating costs |
109.636.000 |
101.562.000 |
116.663.000 |
70.380.000 |
68.207.000 |
|
Raw
materials and consumables |
|
|
|
|
691.462.000 |
|
Operating
expenses |
1.042.817.000 |
1.005.999.000 |
939.607.000 |
842.461.000 |
886.734.000 |
|
Operating
result |
59.233.000 |
77.839.000 |
35.368.000 |
37.321.000 |
72.603.000 |
|
Year |
2012 |
2011 |
2010 |
2009 |
2008 |
|
Financial
income |
7.911.000 |
4.319.000 |
3.225.000 |
24.978.000 |
4.082.000 |
|
Financial
expenses |
15.322.000 |
13.943.000 |
10.528.000 |
17.992.000 |
22.532.000 |
|
Financial
result |
-7.411.000 |
-9.624.000 |
-7.303.000 |
6.986.000 |
-18.450.000 |
|
Result
on ordinary operations before taxes |
51.822.000 |
68.215.000 |
28.065.000 |
44.307.000 |
54.153.000 |
|
|
|||||
|
Taxation
on the result of ordinary activities |
9.147.000 |
17.668.000 |
7.092.000 |
13.347.000 |
22.762.000 |
|
Result
of ordinary activities after taxes |
42.675.000 |
50.547.000 |
20.973.000 |
30.960.000 |
31.391.000 |
|
|
|||||
|
Extraordinary
income |
|
|
|
|
5.232.000 |
|
Extraordinary
result after taxation |
|
|
|
|
5.232.000 |
|
Net
result |
42.675.000 |
50.547.000 |
20.973.000 |
30.960.000 |
35.330.000 |
|
|
|||||
|
Attributable
to third parties |
|
|
|
|
-1.293.000 |
Summary The turnover of the company grew with 1.68 % between 2011 and 2012.
The gross profit
of the company grew with 8.63 % between 2011 and 2012.
The operating
result of the company declined with -23.9 % between 2011 and 2012. This
evolution implies an decrease of the company's economic profitability.
The result of
these changes is a reduction of the company's Economic Profitability of -26.01
% of the analysed period, being equal to 2011 % in the year 2012.
Despite the
decline the assets turnover did not change, the index remained the same at
1.01.
The Net Result of
the company increased by -15.57 % between 2011 and 2012.
The company's
Financial Profitability has been negatively affected by the financial
activities in comparison to the EBITs behaviour. The result of these variations
is a profitability reduction of -2.18 % of the analysed period, being 27.4 % in
the year 2012.
The company's
financial profitability has been positively affected by its financial
structure.
The turnover of
the company grew with 11.17 % between 2010 and 2011.
The gross profit
of the company grew with 9.78 % between 2010 and 2011.
The operating
result of the company grew with 120.08 % between 2010 and 2011. This evolution
implies an increase of the company's economic profitability.
The result of
these changes is an increase of the company's Economic Profitability of 137.78
% of the analysed period, being equal to 2010 % in the year 2011.
This growth has
contributed to the increase in assets turnover, increasing by 8.51 % reaching
1.02.
The Net Result of
the company decreased by 141.01 % between 2010 and 2011.
The company's
Financial Profitability has been negatively affected by the financial
activities in comparison to the EBITs behaviour. The result of these variations
is a profitability reduction of 92.11 % of the analysed period, being 28.01 %
in the year 2011.
The company's
financial structure has slowed down its financial profitability.
Analysis
Branch (SBI) Manufacture of fabricated metal products, except machinery and equipment
(25)
Region Veluwe
In the
In the region
Veluwe 520 of the companies are registered with the SBI code 25
In the
In the region Veluwe
7 of the bankruptcies are published within this sector
The risk of this
specific sector in the
The risk of this
specific sector in the region Veluwe is normal
Publications
Consent statements 20-06-2014: Voor boekjaar 2012 is een instemmingsverklaring gedeponeerd.
28-09-2012: Voor
boekjaar 2011 is een instemmingsverklaring gedeponeerd.
02-12-2010: Voor
boekjaar 2009 is een instemmingsverklaring gedeponeerd.
Functions 19-11-2013: Per 01-12-2012 is bestuurder Petrus Joannes Henricus van
Gastel in
Functie getreden.
19-11-2013: Per
01-10-2013 is gevolmachtigde Lars Adriaan Brouwers in functie getreden.
19-11-2013: Per
01-10-2013 is gevolmachtigde Jolanda Jeanette Klasina Pieters-Oosterbeek
in functie
getreden.
19-11-2013: Per 01-06-2013
is gevolmachtigde Hendricus van de Bovenkamp uit functie
getreden.
19-11-2013: Per
01-06-2013 is gevolmachtigde Gerrigje van Nieuw-Amerongen-van Schagen
uit functie
getreden.
27-08-2012: Per
01-08-2012 is gevolmachtigde Johanna van den Brink in functie getreden.
24-11-2010: Per
01-11-2010 is gevolmachtigde Benno Henk Klomp uit functie getreden.
27-10-2010: Per
01-10-2010 is bestuurder Willem Cornelis Hendrik Verweerd uit functie
getreden.
07-10-2010: Per
01-10-2010 is bestuurder Gerhard Jan Bouw in functie getreden.
01-10-2010: Per
01-10-2010 is bestuurder Hijmen van Doornspeek in functie getreden.
Amendments 24-11-2010: Per 1-10-2010 is de bevoegdheid van Bestuurder Gerhard Jan
Bouw gewijzigd.
Company structure
Relations 13
Emerson Electric Co.
Registration number: 0000
- Emerson
Electric
Teleportboulevard
140
1043EJ
Registration
number: 310399390000
- EMRSN HLDG
B.V.
Teleportboulevard
140
1043EJ
Registration
number: 300342890000
- Emerson
Process Management Flow B.V.
Neonstraat 1
6718WX
Registration
number: 301968180000
FOREIGN EXCHANGE RATES
|
Currency |
Unit
|
Indian Rupees |
|
US Dollar |
1 |
Rs.60.99 |
|
|
1 |
Rs.99.10 |
|
Euro |
1 |
Rs.79.03 |
INFORMATION DETAILS
|
Analysis Done by
: |
DIV |
|
|
|
|
Report Prepared
by : |
SDA |
RATING EXPLANATIONS
|
RATING |
STATUS |
PROPOSED CREDIT LINE |
|
|
|
>86 |
Aaa |
Possesses an extremely sound financial base with the strongest capability
for timely payment of interest and principal sums |
Unlimited |
|
|
71-85 |
Aa |
Possesses adequate working capital. No caution needed for credit
transaction. It has above average (strong) capability for payment of interest
and principal sums |
Large |
|
|
56-70 |
A |
Financial & operational base are regarded healthy. General
unfavourable factors will not cause fatal effect. Satisfactory capability for
payment of interest and principal sums |
Fairly Large |
|
|
41-55 |
Ba |
Overall operation
is considered normal. Capable to meet normal commitments. |
Satisfactory |
|
|
26-40 |
B |
Capability to overcome financial difficulties seems comparatively
below average. |
Small |
|
|
11-25 |
Ca |
Adverse factors are apparent. Repayment of interest and principal sums
in default or expected to be in default upon maturity |
Limited with
full security |
|
|
<10 |
C |
Absolute credit risk exists. Caution needed to be exercised |
Credit not
recommended |
|
|
-- |
NB |
New Business |
-- |
|
This score serves as a reference to assess
SC’s credit risk and to set the amount of credit to be extended. It is
calculated from a composite of weighted scores obtained from each of the major
sections of this report. The assessed factors and their relative weights (as
indicated through %) are as follows:
Financial
condition (40%) Ownership
background (20%) Payment
record (10%)
Credit history
(10%) Market trend (10%) Operational size
(10%)
This report is issued at your request without any
risk and responsibility on the part of MIRA INFORM PRIVATE LIMITED (MIPL)
or its officials.