MIRA
INFORM REPORT
|
Report Date : |
17.09.2014 |
IDENTIFICATION DETAILS
|
Name : |
EFI CRETAPRINT SL |
|
|
|
|
Registered Office : |
P.I. Ramonet, Crta. N340, Km 970. Almazora/Almassora, Castellon Postal Code 12550 |
|
|
|
|
Country : |
|
|
|
|
|
Financials (as on) : |
2012 |
|
|
|
|
Date of Incorporation : |
21.01.2000 |
|
|
|
|
Legal Form : |
Private Company |
|
|
|
|
Line of Business : |
·
Wholesaler
of other office machinery and equipment consisting of industrial inkjet printers and inks, powerful
digital front ends, precise color management tools, eCommerce, web-to-print and
productivity software for business automation, and mobile and cloud printing
products. engaged in manufacturing and marketing
of machinery |
|
|
|
|
No. of Employees |
Not Available |
RATING & COMMENTS
|
MIRA’s Rating : |
Ca |
|
RATING |
STATUS |
PROPOSED CREDIT LINE |
|
|
11-25 |
Ca |
Adverse factors are apparent. Repayment of interest and principal sums
in default or expected to be in default upon maturity |
Limited with
full security |
|
Status : |
Moderate |
|
|
|
|
Payment Behaviour : |
Slow |
|
|
|
|
Litigation : |
Clear |
NOTES :
Any query related to this report can be made
on e-mail : infodept@mirainform.com
while quoting report number, name and date.
ECGC Country Risk Classification List – June 1, 2014
|
Country Name |
Previous Rating (31.03.2014) |
Current Rating (01.06.2014) |
|
Spain |
A2 |
A2 |
|
Risk Category |
ECGC
Classification |
|
Insignificant |
A1 |
|
Low |
A2 |
|
Moderate |
B1 |
|
High |
B2 |
|
Very High |
C1 |
|
Restricted |
C2 |
|
Off-credit |
D |
Spain
experienced a prolonged recession in the wake of the global financial crisis. GDP
contracted by 3.7% in 2009, ending a 16-year growth trend, and continued
contracting through most of 2013. Economic growth resumed in late 2013, albeit
only modestly, as credit contraction in the private sector, fiscal austerity,
and high unemployment continued to weigh on domestic consumption and
investment. Exports, however, have been resilient throughout the economic
downturn, partially offsetting declines in domestic consumption and helped to
bring Spain's current account into surplus in 2013 for the first time since
1986. The unemployment rate rose from a low of about 8% in 2007 to more than
26% in 2013, straining Spain's public finances as spending on social benefits
increased while tax revenues fell. Spain's budget deficit peaked at 11.1% of
GDP in 2009. Spain gradually reduced the deficit to 6.8% of GDP in 2013,
slightly above the 6.5% target negotiated between Spain and the EU. Public debt
has increased substantially - from 70.4% in 2010 to 93.7% in 2013. Rising labor
productivity, moderating labor costs, and lower inflation have helped to
improve foreign investor interest in the economy and to reduce government
borrowing costs. The government's ongoing efforts to implement reforms - labor,
pension, health, tax, and education - are aimed at supporting investor
sentiment. The government also has shored up struggling banks exposed to
Spain's depressed domestic construction and real estate sectors by successfully
completing an EU-funded restructuring and recapitalization program in December
2013.
|
Source
: CIA |
EXECUTIVE
SUMMARY
|
Name: |
EFI CRETAPRINT SL |
||||
|
NIF
/ Fiscal code: |
B82480377 |
||||
|
Status: |
ACTIVE |
||||
|
Incorporation
Date: |
21/01/2000 |
||||
|
Register
Data |
Register
Section 8 Sheet 34979 |
||||
|
Last
Publication in BORME: |
28/02/2014
[Appointments] |
||||
|
Last
Published Account Deposit: |
2012 |
||||
|
Share
Capital: |
3.005,06 |
||||
|
|
|||||
|
Localization: |
P.I.
RAMONET, CRTA. N340, KM 970. - ALMAZORA/ALMASSORA - 12550 - CASTELLON |
||||
|
Telephone
- Fax - Email - Website: |
Ph.:.
964340264 Website. www.cretaprint.com
|
||||
|
|
|||||
|
Activity: |
|
||||
|
NACE: |
Wholesaler of
other office machinery and equipment consisting of industrial inkjet printers and inks, powerful
digital front ends, precise color management tools, eCommerce, web-to-print
and productivity software for business automation, and mobile and cloud
printing products. |
||||
|
Registered
Trademarks: |
|
||||
|
Audited
/ Opinion: |
No |
||||
|
Tenders
and Awards: |
0
for a total cost of 0 |
||||
|
Subsidies: |
0
for a total cost of 0 |
||||
|
Quality
Certificate: |
No |
||||
|
|
|||||
|
Defaults,
Legal Claims and Insolvency Proceedings : |
|||||
|
|
|
Number |
Amount
(€) |
Most
Recent Entry |
|
|
Insolvency
Proceedings, Bankruptcy and Suspension of Payments |
|
Unpublished |
--- |
--- |
|
|
Defaults
on debt with Financial Institutions and Large Companies |
|
None |
--- |
--- |
|
|
Judicial
Claims (Notices, Executive Proceedings, Attachments, Auctions, Bad Debt) |
|
1 |
0 |
--- |
|
|
Proceedings
heard by the Civil Court |
|
Unpublished |
0 |
--- |
|
|
Proceedings
heard by the Labour Court |
|
Unpublished |
0 |
--- |
|
|
Partners: |
||
|
ELECTRONICS
FOR IMAGING (LUXEMBOURG) SARL |
100
% |
|
|
Shares: |
2 |
|
|
Other
Links: |
3 |
|
|
No.
of Active Corporate Bodies: |
JOINT
MANAGER 2 |
|
|
Guarantees: |
|
|
Properties
Registered: |
Company
NO, Administrator NO |
|
Financing
/ Guarantee Sources : |
Sources
NO, Guarantees NO |
INVESTIGATION SUMMARY
|
Founded in 2000, at the start of the year 2013, the subject absorbed the activities of the company RETAPRINT SL (VAT number B96668140) so it is now in a restructuring process. During 2012 the company acted as a holding company which explains the economical and financial structure showed by its balance sheet during this year. Cretaprint SL (VAT number B96668140) had a turnover in 2012, of 30 millions of euros, with a profit of 4 and an asset with 29,5 millions of Euros The subject usually meets its financial obligations. |
Identification
|
|
|
Social
Denomination: |
EFI CRETAPRINT SL |
|
NIF
/ Fiscal code: |
B82480377 |
|
Corporate
Status: |
ACTIVE |
|
Start
of activity: |
2000 |
|
Registered
Office: |
P.I. RAMONET, CRTA. N340,
KM 970. |
|
Locality: |
ALMAZORA/ALMASSORA |
|
Province: |
CASTELLON |
|
Postal
Code: |
12550 |
|
Telephone: |
964340264 |
|
Website: |
|
Activity
|
|
|
NACE: |
4666 |
|
CNAE
Obtaining Source: |
4666 |
|
Additional
Information: |
The subject is engaged in manufacturing and marketing of machinery. In the start of the year 2013 the subject absorbed the activities of the company CRETA PRINT SL (VAT number B96668140).During 2012, the subject acted as a holding company. |
|
Product Details |
Digital Production Printing Enterprise Products Inkjet Printing Jetrion Digital Label Printers Cretaprint Ceramic Tile Printers |
|
Additional
Address: |
Registered office, warehouse, offices, workshop, shed, all premises rented by the company, are located in P.I. RAMONET, CRTA. N340, KM 970. 12550 ALMAZORA ( CASTELLON ). |
|
Import
/ export: |
DOES NOT IMPORT / DOES NOT
EXPORT |
|
Future
Perspective: |
Consolidation |
|
Industry
situation: |
Maturity |
Chronological
Summary
|
|
|
|
|
Year |
Act |
|
|
2000 |
Appointments/ Re-elections
(3) Cessations/ Resignations/ Reversals (2) Company Formation (1) Other
Concepts/ Events (1) |
|
|
2002 |
Accounts deposit (ejer.
2000) |
|
|
2003 |
Accounts deposit (ejer.
2001, 2002) Appointments/ Re-elections (1) Cessations/ Resignations/
Reversals (1) Declaration of Sole Propietorship (1) Loss of the sole
propietorship condition (1) Other Concepts/ Events (1) |
|
|
2004 |
Accounts deposit (ejer.
2003) |
|
|
2005 |
Accounts deposit (ejer.
2004) |
|
|
2006 |
Accounts deposit (ejer.
2005) Appointments/ Re-elections (1) Cessations/ Resignations/ Reversals (1)
Change of Social address (1) Declaration of Sole Propietorship (1) Loss of the
sole propietorship condition (1) Other Concepts/ Events (1) |
|
|
2007 |
Accounts deposit (ejer.
2006) |
|
|
2010 |
Accounts deposit (ejer.
2007, 2008) Cessations/ Resignations/ Reversals (1) Change of Social address
(2) |
|
|
2011 |
Accounts deposit (ejer.
2009) Appointments/ Re-elections (1) Cessations/ Resignations/ Reversals (1)
Change of Social address (1) |
|
|
2012 |
Accounts deposit (ejer.
2010, 2011) Appointments/ Re-elections (3) Statutory Modifications (2) Take-over
Merger (4) |
|
|
2013 |
Accounts deposit (ejer.
2012) Appointments/ Re-elections (3) Cessations/ Resignations/ Reversals (1)
Change of Social Denomination (1) Change of Social Purpose (1) Change of Social
address (1) Statutory Modifications (2) |
|
|
2014 |
Appointments/ Re-elections
(1) Cessations/ Resignations/ Reversals (1) |
|
Main
Historic Changes
|
|||
|
|
|
|
|
|
Concept |
Publication |
Act |
Date |
|
Corporate Purpose Changes: |
LA DISTRIBUCION, VENTA,
COMPRA Y PROMOCION PARA LA VENTA DE CUALQUIER TIPO DE SOFTWARE, HARDWARE O
CUALQUIER OTRO TIPO DE MATERIAL INFORMATICO |
Company Formation |
28/03/2000 |
Breakdown
of Owners' Equity
|
|
|
Registered
Capital: |
3.005,06 |
|
Paid
up capital: |
3.005,06 |
Updated
Evolution of the Subscribed and Paid-in Capital
|
|||||
|
|
|
|
|
|
|
|
Publishing Date |
Registration Type |
Capital Subscribed |
Paid up capital |
Underwritten result |
Disbursed Result |
|
14/03/2000 |
Company Formation |
3.005 |
3.005 |
3.005 |
3.005 |
Active
Social Bodies
|
Post published |
Social Body's Name |
Appointment Date |
Other Positions in this
Company |
|
SINGLE PARTNER |
ELECTRONICS FOR IMAGING
LUXEMBOURG SARL |
20/11/2006 |
1 |
|
JOINT MANAGER |
GREEN BRANDON WEGNER |
30/01/2013 |
2 |
|
|
KO BRYAN SEUK |
30/01/2013 |
1 |
|
COMBINED PROXY |
CEPRIA CARLAMPIO SERGIO |
09/07/2013 |
2 |
|
|
AGUDO CARDO EVA |
09/07/2013 |
1 |
|
JOINT ATTORNEY |
DEL CAMPO LOPEZ INMACULADA |
15/03/2013 |
1 |
|
|
DE CUETO MORENO MANUEL |
16/08/2012 |
1 |
|
|
NAVARRO MARTINEZ AVIAL
GONZALO |
16/08/2012 |
1 |
|
|
GOMEZ CUETARA MARTINEZ
ISABEL |
16/08/2012 |
1 |
|
|
ROMERO CABELLO DE ALBA
MANUEL |
16/08/2012 |
1 |
|
|
MOLINA CUBILLO BELEN |
16/08/2012 |
1 |
|
JOINT ATTORNEY/COMBINED
PROXY |
BLASCO CLARET VICTOR
IGNACIO |
09/07/2013 |
1 |
|
|
MATAMOROS UZ IGNACIO |
09/07/2013 |
3 |
|
PROXY |
ELECTRONICS FOR IMAGING
INC |
02/01/2012 |
2 |
|
|
GREEN BRANDON WEGNER |
02/01/2012 |
2 |
|
|
WESSEL JOHANNES CORNELIS |
02/01/2012 |
1 |
|
|
DEN HARTOG DE REUS
MARJOLIJN JANNETTE |
02/01/2012 |
1 |
|
|
MEIJER MIA KRISTIN |
02/01/2012 |
1 |
|
|
CRIPPS JR PAUL ARNOLD |
02/01/2012 |
1 |
|
|
PILETTE VINCENT JEAN
CLAUDE |
02/01/2012 |
1 |
|
|
GRANT THORNTON ASESORES SL |
27/07/2011 |
1 |
|
|
LOPEZ PELEGRIN DE SIMON
ALFONSO |
27/07/2011 |
1 |
|
ACCOUNTS' AUDITOR / HOLDER |
PRICEWATERHOUSECOOPERS
AUDITORES SL |
21/02/2014 |
1 |
Historical
Social Bodies
|
|
|
|
|
|
Social Body's Name |
Post published |
End Date |
Other Positions in this
Company |
|
AEC AUDITORES SLP |
ACCOUNTS' AUDITOR / HOLDER |
21/02/2014 |
1 |
|
ARNALDO ALBUJAR JOSE
ANTONIO |
JOINT ATTORNEY |
27/07/2011 |
1 |
|
BORRALLO PEREZ COCA
PAULINO |
PROXY |
16/10/2006 |
1 |
|
CEPRIA CARLAMPIO SERGIO |
JOINT ATTORNEY |
09/07/2013 |
2 |
|
CEREZO MIRANDA PALOMA
ISABEL |
PROXY |
16/10/2006 |
1 |
|
CUTTS JOE |
JOINT MANAGER |
19/08/2010 |
1 |
|
ELECTRONICS FOR IMAGING
INC |
SINGLE PARTNER |
11/11/2003 |
2 |
|
ELECTRONICS FOR IMAGING
INVESTMENTS BV |
SINGLE PARTNER |
20/11/2006 |
1 |
|
FISCHER ROBERT |
PROXY |
27/07/2011 |
1 |
|
FISHER KLAUS BERND |
PROXY |
27/07/2011 |
1 |
|
LEE MARK |
SINGLE ADMINISTRATOR |
06/06/2000 |
1 |
|
LOJO ELCID AGUSTIN |
PROXY |
16/10/2006 |
1 |
|
MALLOZZI FRANK |
JOINT MANAGER |
30/01/2013 |
1 |
|
MATAMOROS UZ IGNACIO |
PROXY |
15/03/2013 |
3 |
|
|
JOINT ATTORNEY |
09/07/2013 |
|
|
MORENO GARCIA LUISA |
PROXY |
19/11/2003 |
1 |
|
OLIVIER PIERRE |
PROXY |
27/07/2011 |
1 |
|
ROSENZWEIG FRED |
SINGLE ADMINISTRATOR |
27/11/2000 |
2 |
|
|
JOINT MANAGER |
30/01/2013 |
|
|
SANCHEZ HIJANO MARIA DE
LAS MERCEDES |
JOINT ATTORNEY |
27/07/2011 |
1 |
|
VILA HERRERO ALBERTO
FERNANDO |
PROXY |
19/11/2003 |
1 |
|
Executive board
|
||
|
Post |
NIF |
Name |
|
ADMINISTRATOR |
|
KO BRYAN SEUK |
|
D efaults, Legal Claims and Insolvency Proceedings |
Section enabling assessment
of the degree of compliance of the company queried with its payment obligations.
It provides information on the existence and nature of all stages of Insolvency
and Legal Proceedings published with reference to the Company in the country's
various Official Bulletins and national newspapers, as well Defaults Registered
in the main national credit bureaus (ASNEF Industrial and RAI ).
> Summary
Chronological summary
|
|
|
Number
of Publications |
Amount
(_) |
Start
date |
End
date |
|
Insolvency
Proceedings, Bankruptcy and Suspension of Payments |
|
Unpublished |
--- |
--- |
--- |
|
Request/Declaration |
|
0 |
--- |
date |
|
|
Proceedings |
|
--- |
--- |
|
--- |
|
Resolution |
|
--- |
--- |
|
--- |
|
Defaults
on debt with Financial Institutions and Large Companies |
Bank and Commercial Delinquency |
None |
0 |
|
|
|
Status:
Friendly |
|
--- |
|
|
|
|
Status:
Pre-Litigation |
|
--- |
|
|
|
|
Status:
Litigation |
|
--- |
|
|
|
|
Status:
Non-performing |
|
--- |
|
|
|
|
Status:
insolvency proceedings, bankruptcy and suspension of payments |
|
--- |
|
|
|
|
Other
status |
|
--- |
|
|
|
|
Legal
and Administrative Proceedings |
|
1 |
--- |
30/09/2013 |
30/09/2013 |
|
Notices
of defaults and enforcement |
|
1 |
--- |
|
--- |
|
Seizures |
|
--- |
--- |
|
--- |
|
Auctions |
|
--- |
--- |
|
--- |
|
Declarations
of insolvency and bad debt |
|
--- |
--- |
|
--- |
|
Proceedings
heard by the Civil Court |
|
Unpublished |
--- |
|
|
|
Proceedings
heard by the Labour Court |
|
Unpublished |
--- |
|
|
Probability of default
> Probabilidad Estimada de Impago para los próximos 12 meses:
18.957 %
> Latest Rating Changes :
|
Sector
in which comparison is carried out : 466 Wholesale
of other machinery, equipment and supplies |
|
|
Relative
Position:
|
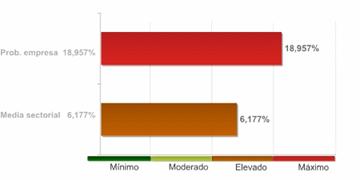
The company's comparative analysis with the rest of the companies that comprise the sector, shows the company holds a worse position with regard to the probability of non-compliance.
The 3.00% of the companies of the sector EFI CRETAPRINT SL belongs to shows a lower probability of non-compliance.
The probability of the company's non-compliance with its payment obligations within deadlines estimated by our qualifications models is 18.96%.
In the event they fail to comply with the payment, the seriousness of the loss will depend on factors such as the promptness of the commencement of the charging management, the existence of executive documents which match the credit or the existence of guarantees and free debt assets under the name of the debtor. Therefore, the probability of non-compliance should not be solely interpreted as the total loss of the owed amount.
Result of query
submitted to the R.A.I.
(Spanish Bad Debt
Register) on
|
LEGAL CLAIMS |
|
Summary of Judicial Claims |
|
|
|
|
|
|
|
|
||
|
|
|
No se han publicado |
|
|
|
|
No se han publicado |
|
|
INCIDENCES WITH THE PUBLIC ADMINISTRATIONS |
|
||
|
|
|
No se han publicado |
|
|
|
|
No se han publicado |
|
|
|
|
No se han publicado |
|
|
|
|
|
|
|
|
|
||
|
|
|
No se han publicado |
|
|
|
|
No se han publicado |
|
|
|
|
||
|
|
|
No se han publicado |
|
|
Incidences
Detailed |
|
Incidences
with the Local Administration |
|
PROCESSED
BY THE LOCAL GOVERNMENT DE MADRID - Date 30/09/2013 |
|
Last
Published Stage: |
SEIZURE |
|
Record
Number: |
13263041312 |
|
Amount
of the incidence: |
0,00
E |
|
Requested
by: |
ADMINISTRACION
LOCAL |
|
Published
domicile: |
(DESCONOCIDA) |
|
Source: |
BOLETIN
OFICIAL DEL AYUNTAMIENTO DE MADRID Nº7020, 2013 PAGINA 300 |
Link
List
|
ABSORBS TO: |
1 Entities |
|
HAS IN ITS ADMINISTRATION
BOARD TO: |
1 Entities |
|
IS RELATED WITH: |
1 Entities |
|
PARTICIPATES IN: |
2 Entities |
|
SHAREHOLDERS: |
1 Entities |
> Shareholders
|
Relationship |
Entity |
Province |
Shareholding stake |
|
SHAREHOLDERS |
ELECTRONICS FOR IMAGING
(LUXEMBOURG) SARL |
|
100 |
|
PARTICIPATES IN |
CRETA PRINT SL |
CASTELLON |
100 |
|
|
EFI-CRETAPRINT DEVELOPMENT
SL |
CASTELLON |
100 |
> Other relationships
|
Relationship |
Entity |
Province |
Shareholding stake |
|
IS RELATED WITH |
ELECTRONICS FOR IMAGING BV
(HOLANDA) |
|
|
|
ABSORBS TO |
CRETA PRINT SL |
CASTELLON |
|
|
HAS IN ITS ADMINISTRATION
BOARD TO |
GRANT THORNTON ASESORES
SLP |
BARCELONA |
|
|
Turnover
|
|
|
Total
Sales 2013 |
950.000 |
Financial Accounts and Balance Sheets
Financial Years Presented
|
Ejercicio |
Tipo
de Cuentas Anuales |
Fecha
Presentacion |
|
2012 |
Normales |
January
2013 |
|
2011 |
Normales |
August
2012 |
|
2010 |
Normales |
January
2012 |
|
2009 |
Normales |
May
2011 |
|
2008 |
Normales |
July
2010 |
|
2007 |
Normales |
July
2010 |
|
2006 |
Normales |
November
2007 |
|
2005 |
Normales |
November
2006 |
|
2004 |
Normales |
July
2005 |
|
2003 |
Normales |
September
2004 |
|
2002 |
Normales |
December
2003 |
|
2001 |
Normales |
October
2003 |
|
2000 |
Normales |
October
2001 |
|
2000 |
Normales |
October
2003 |
The data in the report regarding the last Company Accounts submitted by the company is taken from the TRADE REGISTER serving the region in which the company's address is located 31/07/2012
> Balance en formato Abreviado de acuerdo al Nuevo Plan General Contable 2007
Information corresponding to the fiscal year 2012 2011 2010 is taken from information submitted to the TRADE REGISTER. Data corresponding to fiscal years before 2012 2011 2010 has been compiled based on the equivalence criteria stipulated in Act JUS/206/2009.
|
|
ORIGINAL |
ORIGINAL |
ORIGINAL |
EQUIVALENCIA |
EQUIVALENCIA |
|
|
Assets |
2012 |
2011 |
2010 |
2002 |
2001 |
|
|
A)
NON-CURRENT ASSETS: 11000 |
38.249.136,00 |
2.284,00 |
0,00 |
4.053,00 |
9.273,00 |
|
|
I. Intangible fixed assets : 11100 |
0,00 |
0,00 |
0,00 |
0,00 |
0,00 |
|
|
II. Tangible fixed assets : 11200 |
761,00 |
2.284,00 |
0,00 |
4.053,00 |
9.273,00 |
|
|
III. Real estate investment: 11300 |
0,00 |
0,00 |
0,00 |
0,00 |
0,00 |
|
|
IV. Long-term investments in Group companies and associates :
11400 |
38.248.375,00 |
0,00 |
0,00 |
0,00 |
0,00 |
|
|
V. Long-term financial investments: 11500 |
0,00 |
0,00 |
0,00 |
0,00 |
0,00 |
|
|
VI. Assets for deferred tax : 11600 |
0,00 |
0,00 |
0,00 |
0,00 |
0,00 |
|
|
VII. Non-current trade debtors : 11700 |
0,00 |
0,00 |
0,00 |
0,00 |
0,00 |
|
|
B)
CURRENT ASSETS: 12000 |
46.174,00 |
497.258,00 |
447.646,00 |
77.641,00 |
99.366,00 |
|
|
I. Non-current assets held for sale : 12100 |
0,00 |
0,00 |
0,00 |
0,00 |
0,00 |
|
|
II. Stocks: 12200 |
0,00 |
0,00 |
0,00 |
0,00 |
0,00 |
|
|
III. Trade debtors and others receivable accounts: 12300 |
11.708,00 |
278.672,00 |
186.597,00 |
0,00 |
76.047,00 |
|
|
1.- Customers for sales and provisions of
services : 12380 |
0,00 |
0,00 |
0,00 |
0,00 |
76.047,00 |
|
|
a) Long-term
receivables from sales and services supplied: 12381 |
0,00 |
0,00 |
0,00 |
0,00 |
76.047,00 |
|
|
b) Customers for
sales and provisions of services : 12382 |
0,00 |
0,00 |
0,00 |
0,00 |
0,00 |
|
|
2.- Called up share capital : 12370 |
0,00 |
0,00 |
0,00 |
0,00 |
0,00 |
|
|
3.- Other accounts receivable :
12390 |
0,00 |
278.672,00 |
186.597,00 |
0,00 |
0,00 |
|
|
IV. Short-term investments in Group companies and associates:
12400 |
0,00 |
0,00 |
0,00 |
0,00 |
0,00 |
|
|
V. Short-term financial investments : 12500 |
0,00 |
0,00 |
0,00 |
0,00 |
0,00 |
|
|
VI. Short-term accruals: 12600 |
11.708,00 |
17.164,00 |
51.864,00 |
16.274,00 |
0,00 |
|
|
VII. Cash and other equivalent liquid assets : 12700 |
34.467,00 |
201.422,00 |
209.185,00 |
61.366,00 |
23.319,00 |
|
|
TOTAL
ASSETS (A + B) : 10000 |
38.295.311,00 |
499.542,00 |
447.646,00 |
81.694,00 |
108.639,00 |
|
|
|
ORIGINAL |
ORIGINAL |
ORIGINAL |
EQUIVALENCIA |
EQUIVALENCIA |
|
|
Liabilities
and Net Worth |
2012 |
2011 |
2010 |
2002 |
2001 |
|
|
A)
NET WORTH: 20000 |
-930.192,00 |
330.742,00 |
293.239,00 |
47.108,00 |
36.325,00 |
|
|
A1) Shareholders' equity : 21000 |
-930.192,00 |
330.742,00 |
293.239,00 |
47.108,00 |
36.325,00 |
|
|
I. Capital: 21100 |
3.005,00 |
3.005,00 |
3.005,00 |
3.010,00 |
3.010,00 |
|
|
1.- Registered
capital: 21110 |
3.005,00 |
3.005,00 |
3.005,00 |
3.010,00 |
3.010,00 |
|
|
2.- (Uncalled
capital) : 21120 |
0,00 |
0,00 |
0,00 |
0,00 |
0,00 |
|
|
II. Share premium: 21200 |
0,00 |
0,00 |
0,00 |
0,00 |
0,00 |
|
|
III. Reserves: 21300 |
217.335,00 |
301,00 |
301,00 |
30.283,00 |
9.834,00 |
|
|
IV. (Common stock equity): 21400 |
0,00 |
0,00 |
0,00 |
0,00 |
0,00 |
|
|
V. Profit or loss brought forward:
21500 |
0,00 |
222.418,00 |
210.591,00 |
0,00 |
0,00 |
|
|
VI. Other shareholders'
contributions: 21600 |
112.117,00 |
110.402,00 |
67.515,00 |
0,00 |
0,00 |
|
|
VII. Result of the period: 21700 |
-1.262.649,00 |
-5.384,00 |
11.828,00 |
13.815,00 |
23.480,00 |
|
|
VIII. (Interim dividend): 21800 |
0,00 |
0,00 |
0,00 |
0,00 |
0,00 |
|
|
IX. Other net worth instruments:
21900 |
0,00 |
0,00 |
0,00 |
0,00 |
0,00 |
|
|
A2) Adjustments due to changes in value : 22000 |
0,00 |
0,00 |
0,00 |
0,00 |
0,00 |
|
|
A-3) Received subsidies, donations and legacies: 23000 |
0,00 |
0,00 |
0,00 |
0,00 |
0,00 |
|
|
B)
NON-CURRENT LIABILITIES: 31000 |
7.136.607,00 |
0,00 |
0,00 |
0,00 |
0,00 |
|
|
I. Long-term provisions: 31100 |
7.136.607,00 |
0,00 |
0,00 |
0,00 |
0,00 |
|
|
II. Long-term creditors : 31200 |
0,00 |
0,00 |
0,00 |
0,00 |
0,00 |
|
|
1.- Amounts owed to credit institutions:
31220 |
0,00 |
0,00 |
0,00 |
0,00 |
0,00 |
|
|
2.- Creditors from financial leasing :
31230 |
0,00 |
0,00 |
0,00 |
0,00 |
0,00 |
|
|
3.- Other long-term creditors :
31290 |
0,00 |
0,00 |
0,00 |
0,00 |
0,00 |
|
|
III. Long-term debts with Group companies and associates:
31300 |
0,00 |
0,00 |
0,00 |
0,00 |
0,00 |
|
|
IV. Liabilities for deferred tax: 31400 |
0,00 |
0,00 |
0,00 |
0,00 |
0,00 |
|
|
V. Long-term accruals: 31500 |
0,00 |
0,00 |
0,00 |
0,00 |
0,00 |
|
|
VI. Non-current trade creditors : 31600 |
0,00 |
0,00 |
0,00 |
0,00 |
0,00 |
|
|
VII. Special long-term debts : 31700 |
0,00 |
0,00 |
0,00 |
0,00 |
0,00 |
|
|
C)
CURRENT LIABILITIES : 32000 |
32.088.896,00 |
168.800,00 |
154.406,00 |
34.585,00 |
72.314,00 |
|
|
I. Liabilities linked to non-current assets held for sale :
32100 |
0,00 |
0,00 |
0,00 |
0,00 |
0,00 |
|
|
II. Short-term provisions: 32200 |
7.493.437,00 |
0,00 |
0,00 |
0,00 |
0,00 |
|
|
III. Short-term creditors : 32300 |
0,00 |
0,00 |
0,00 |
34.585,00 |
72.314,00 |
|
|
1.- Amounts owed to credit institutions:
32320 |
0,00 |
0,00 |
0,00 |
34.585,00 |
72.314,00 |
|
|
2.- Creditors from financial leasing :
32330 |
0,00 |
0,00 |
0,00 |
0,00 |
0,00 |
|
|
3.- Other short-term creditors :
32390 |
0,00 |
0,00 |
0,00 |
0,00 |
0,00 |
|
|
IV. Short-term debts with Group companies and associates:
32400 |
24.443.213,00 |
0,00 |
0,00 |
0,00 |
0,00 |
|
|
V. Trade creditors and other accounts payable: 32500 |
152.245,00 |
168.800,00 |
154.406,00 |
0,00 |
0,00 |
|
|
1.- Suppliers: 32580 |
0,00 |
0,00 |
0,00 |
0,00 |
0,00 |
|
|
a) Long-term debts :
32581 |
0,00 |
0,00 |
0,00 |
0,00 |
0,00 |
|
|
b) Short-term debts :
32582 |
0,00 |
0,00 |
0,00 |
0,00 |
0,00 |
|
|
2.- Other creditors : 32590 |
152.245,00 |
168.800,00 |
154.406,00 |
0,00 |
0,00 |
|
|
VI. Short-term accruals: 32600 |
0,00 |
0,00 |
0,00 |
0,00 |
0,00 |
|
|
VII. Special short-term debts : 32700 |
0,00 |
0,00 |
0,00 |
0,00 |
0,00 |
|
|
TOTAL
NET WORTH AND LIABILITIES (A + B + C) : 30000 |
38.295.311,00 |
499.542,00 |
447.646,00 |
81.694,00 |
108.639,00 |
|
|
|
ORIGINAL |
ORIGINAL |
ORIGINAL |
EQUIVALENCIA |
EQUIVALENCIA |
|
|
Profit
and Loss |
2012 |
2011 |
2010 |
2002 |
2001 |
|
|
1. Net turnover: 40100 |
770.185,00 |
1.187.980,00 |
984.774,00 |
407.994,00 |
466.233,00 |
|
|
2. Changes in stocks of finished goods and work in progress:
40200 |
0,00 |
0,00 |
0,00 |
0,00 |
0,00 |
|
|
3. Works carried out by the company for its assets: 40300 |
0,00 |
0,00 |
0,00 |
0,00 |
0,00 |
|
|
4. Supplies : 40400 |
0,00 |
0,00 |
0,00 |
0,00 |
0,00 |
|
|
5. Other operating income: 40500 |
0,00 |
0,00 |
0,00 |
0,00 |
0,00 |
|
|
6. Personnel costs: 40600 |
-523.314,00 |
-828.886,00 |
-656.835,00 |
-185.773,00 |
-227.271,00 |
|
|
7. Other operating costs: 40700 |
-673.434,00 |
-356.289,00 |
-294.080,00 |
-188.536,00 |
-201.496,00 |
|
|
8. Amortisation of fixed assets: 40800 |
-1.523,00 |
0,00 |
-143,00 |
-5.220,00 |
-4.937,00 |
|
|
9. Allocation of subsidies of non-financial fixed assets and
other: 40900 |
0,00 |
0,00 |
0,00 |
0,00 |
0,00 |
|
|
10. Excess provisions : 41000 |
0,00 |
0,00 |
0,00 |
0,00 |
0,00 |
|
|
11. Impairment and result of transfers of fixed assets:
41100 |
0,00 |
0,00 |
0,00 |
0,00 |
0,00 |
|
|
12. Negative difference in combined businesses: 41200 |
0,00 |
0,00 |
0,00 |
0,00 |
0,00 |
|
|
13. Other results : 41300 |
0,00 |
0,00 |
0,00 |
0,00 |
3.571,00 |
|
|
A)
OPERATING INCOME (1 + 2 + 3 + 4 + 5 + 6 + 7 + 8 + 9 + 10 + 11 + 12 + 13) :
49100 |
-428.086,00 |
2.804,00 |
33.715,00 |
28.465,00 |
36.099,00 |
|
|
14. Financial income : 41400 |
0,00 |
1.905,00 |
0,00 |
1,00 |
25,00 |
|
|
a) Allocation of financial subsidies,
donations and legacies: 41430 |
0,00 |
0,00 |
0,00 |
0,00 |
0,00 |
|
|
b) Other financial income: 41490 |
0,00 |
1.905,00 |
0,00 |
1,00 |
25,00 |
|
|
15. Financial expenditure: 41500 |
-835.500,00 |
0,00 |
0,00 |
0,00 |
0,00 |
|
|
16. Changes in fair value of financial instruments :
41600 |
0,00 |
0,00 |
0,00 |
0,00 |
0,00 |
|
|
17. Exchange rate differences : 41700 |
937,00 |
13.681,00 |
-7.344,00 |
-7.187,00 |
0,00 |
|
|
18. Impairment and result for transfers of financial
instruments: 41800 |
0,00 |
0,00 |
0,00 |
0,00 |
0,00 |
|
|
19. Other financial income and expenditure: 42100 |
0,00 |
0,00 |
0,00 |
0,00 |
0,00 |
|
|
a) Incorporation of financial expenditure
to assets: 42110 |
0,00 |
0,00 |
0,00 |
0,00 |
0,00 |
|
|
b) Financial income from arrangement with
creditors: 42120 |
0,00 |
0,00 |
0,00 |
0,00 |
0,00 |
|
|
c) Other income and expenditure:
42130 |
0,00 |
0,00 |
0,00 |
0,00 |
0,00 |
|
|
B)
FINANCIAL REVENUE (14 + 15 + 16 + 17 + 18 + 19) : 49200 |
-834.563,00 |
15.586,00 |
-7.344,00 |
-7.186,00 |
25,00 |
|
|
C)
NET RESULT BEFORE TAXES (A + B) : 49300 |
-1.262.649,00 |
18.390,00 |
26.371,00 |
21.279,00 |
36.123,00 |
|
|
20. Income taxes: 41900 |
0,00 |
-23.774,00 |
-14.544,00 |
-7.464,00 |
-12.643,00 |
|
|
D)
RESULT OF THE PERIOD (C + 20) : 49500 |
-1.262.649,00 |
-5.384,00 |
11.828,00 |
13.815,00 |
23.480,00 |
|
>
Normal Balance Sheet under the rules of the 1990 General Accounting Plan
(repealed since 1st January of 2008)
Information corresponding to the fiscal year 2012 2011 2010 has been compiled based on the equivalence criteria stipulated in Act JUS/206/2009.
|
|
EQUIVALENCIA |
EQUIVALENCIA |
EQUIVALENCIA |
ORIGINAL |
ORIGINAL |
|
|
ASSETS |
2012 |
2011 |
2010 |
2002 |
2001 |
|
|
A)
SHAREHOLDERS (PARTNERS) BY UNCALLED SUSCRIBED CAPITAL: |
0,00 |
0,00 |
0,00 |
0,00 |
0,00 |
|
|
B)
FIXED ASSETS: |
38.249.136,00 |
2.284,00 |
0,00 |
4.053,00 |
9.273,00 |
|
|
I. Formation expenses: |
0,00 |
0,00 |
0,00 |
0,00 |
0,00 |
|
|
II. Intangible fixed assets: |
0,00 |
0,00 |
0,00 |
0,00 |
0,00 |
|
|
III. Tangible fixed assets: |
761,00 |
2.284,00 |
0,00 |
4.053,00 |
9.273,00 |
|
|
IV. Financial investments: |
38.248.375,00 |
0,00 |
0,00 |
0,00 |
0,00 |
|
|
V. Own shares: |
0,00 |
0,00 |
0,00 |
0,00 |
0,00 |
|
|
VI. Long-term trade receivables: |
0,00 |
0,00 |
0,00 |
0,00 |
0,00 |
|
|
C)
Deferred expenses: |
0,00 |
0,00 |
0,00 |
0,00 |
0,00 |
|
|
D)
CURRENT ASSETS: |
57.882,00 |
497.258,00 |
447.646,00 |
77.641,00 |
99.366,00 |
|
|
I. Called-up share capital (not paid): |
0,00 |
0,00 |
0,00 |
0,00 |
0,00 |
|
|
II. Stocks: |
0,00 |
0,00 |
0,00 |
0,00 |
0,00 |
|
|
III. Debtors: |
11.708,00 |
278.672,00 |
186.597,00 |
0,00 |
76.047,00 |
|
|
IV. Short-term investments: |
0,00 |
0,00 |
0,00 |
0,00 |
0,00 |
|
|
V. Short-term treasury shares: |
0,00 |
0,00 |
0,00 |
0,00 |
0,00 |
|
|
VI. Cash at bank and in hand: |
34.467,00 |
201.422,00 |
209.185,00 |
61.366,00 |
23.319,00 |
|
|
VII. Prepayments and accrued income: |
11.708,00 |
17.164,00 |
51.864,00 |
16.274,00 |
0,00 |
|
|
GENERAL
TOTAL (A + B + C + D): |
38.307.018,00 |
499.542,00 |
447.646,00 |
81.694,00 |
108.639,00 |
|
MERCANTILE
REGISTRY.
|
|
EQUIVALENCIA |
EQUIVALENCIA |
EQUIVALENCIA |
ORIGINAL |
ORIGINAL |
|
|
LIABILITIES |
2012 |
2011 |
2010 |
2002 |
2001 |
|
|
A)
EQUITY: |
-930.192,00 |
330.742,00 |
293.239,00 |
47.108,00 |
36.325,00 |
|
|
I. Subscribed capital: |
3.005,00 |
3.005,00 |
3.005,00 |
3.010,00 |
3.010,00 |
|
|
II. Share premium: |
0,00 |
0,00 |
0,00 |
0,00 |
0,00 |
|
|
III. Revaluation reserves: |
0,00 |
0,00 |
0,00 |
0,00 |
0,00 |
|
|
IV. Reserves: |
217.335,00 |
301,00 |
301,00 |
30.283,00 |
9.834,00 |
|
|
a) Differences for capital adjustment to
euros: |
0,00 |
0,00 |
0,00 |
0,00 |
0,00 |
|
|
b) Remaining Reserves: |
217.335,00 |
301,00 |
301,00 |
30.283,00 |
9.834,00 |
|
|
V. Profit or loss brought forward: |
112.117,00 |
332.820,00 |
278.106,00 |
0,00 |
0,00 |
|
|
VI. Profit or loss for the financial year: |
-1.262.649,00 |
-5.384,00 |
11.828,00 |
13.815,00 |
23.480,00 |
|
|
VII. Interim dividend paid: |
0,00 |
0,00 |
0,00 |
0,00 |
0,00 |
|
|
VIII. Own shares for capital reduction: |
0,00 |
0,00 |
0,00 |
0,00 |
0,00 |
|
|
B)
Deferred income: |
0,00 |
0,00 |
0,00 |
0,00 |
0,00 |
|
|
C)
PROVISIONS FOR LIABILITIES AND CHARGES: |
7.136.607,00 |
0,00 |
0,00 |
0,00 |
0,00 |
|
|
D)
LONG TERM LIABILITIES: |
0,00 |
0,00 |
0,00 |
0,00 |
0,00 |
|
|
E)
SHORT TERM CREDITORS: |
24.595.458,00 |
168.800,00 |
154.406,00 |
34.585,00 |
72.314,00 |
|
|
F)
SHORT-TERM PROVISIONS FOR LIABILITIES AND CHARGES: |
7.493.437,00 |
0,00 |
0,00 |
0,00 |
0,00 |
|
|
GENERAL
TOTAL (A + B + C + D + E + F): |
38.295.311,00 |
499.542,00 |
447.646,00 |
81.694,00 |
108.639,00 |
|
MERCANTILE
REGISTRY.
|
|
EQUIVALENCIA |
EQUIVALENCIA |
EQUIVALENCIA |
ORIGINAL |
ORIGINAL |
|
|
DEBIT |
2012 |
2011 |
2010 |
2002 |
2001 |
|
|
A)
CHARGES (A.1 to A.15): |
2.033.771,00 |
1.208.950,00 |
972.946,00 |
394.180,00 |
446.348,00 |
|
|
A.1. Operating consumption: |
0,00 |
0,00 |
0,00 |
0,00 |
0,00 |
|
|
A.2. Staff Costs: |
523.314,00 |
828.886,00 |
656.835,00 |
185.773,00 |
227.271,00 |
|
|
a) Wages, salaries et
al.: |
0,00 |
0,00 |
0,00 |
164.922,00 |
167.045,00 |
|
|
b) Social security
costs: |
523.314,00 |
828.886,00 |
656.835,00 |
20.851,00 |
60.226,00 |
|
|
A.3. Depreciation expense: |
1.523,00 |
0,00 |
143,00 |
5.220,00 |
4.937,00 |
|
|
A.4. Variation of trade provisions and losses
of unrecovered receivables: |
0,00 |
0,00 |
0,00 |
0,00 |
0,00 |
|
|
A.5. Other operating charges: |
673.434,00 |
356.289,00 |
294.080,00 |
188.536,00 |
201.496,00 |
|
|
A.I. OPERATING BENEFITS (B.1-A.1-A.2-A.3-A.4-A.5): |
0,00 |
2.804,00 |
33.715,00 |
28.465,00 |
32.528,00 |
|
|
A.6. Financial and similar charges: |
835.500,00 |
0,00 |
0,00 |
0,00 |
0,00 |
|
|
a) Due to liabilities
with companies of the group: |
0,00 |
0,00 |
0,00 |
0,00 |
0,00 |
|
|
b) Due to liabilities
with associated companies: |
0,00 |
0,00 |
0,00 |
0,00 |
0,00 |
|
|
c) Due to other
debts: |
835.500,00 |
0,00 |
0,00 |
0,00 |
0,00 |
|
|
d) Losses from
financial investments: |
0,00 |
0,00 |
0,00 |
0,00 |
0,00 |
|
|
A.7. Financial investment provision
change: |
0,00 |
0,00 |
0,00 |
0,00 |
0,00 |
|
|
A.8. Exchange losses: |
0,00 |
0,00 |
7.344,00 |
7.187,00 |
0,00 |
|
|
A.II. POSITIVE FINANCIAL RESULTS (B.2+B.3-A.6-A.7-A.8): |
0,00 |
15.586,00 |
0,00 |
0,00 |
25,00 |
|
|
A.III. PROFIT FROM ORDINARY ACTIVITIES (A.I+A.II-B.I-B.II):
|
0,00 |
18.390,00 |
26.371,00 |
21.279,00 |
32.553,00 |
|
|
A.9. Changes in provisions for intangible,
tangible and securities portfolio: |
0,00 |
0,00 |
0,00 |
0,00 |
0,00 |
|
|
A.10. Losses from tangible and intangible
fixed assets and portfolio: |
0,00 |
0,00 |
0,00 |
0,00 |
0,00 |
|
|
A.11. Losses from transactions with own
shares and debentures: |
0,00 |
0,00 |
0,00 |
0,00 |
0,00 |
|
|
A.12. Extraordinary expenses: |
0,00 |
0,00 |
0,00 |
0,00 |
0,00 |
|
|
A.13. Prior year expenses and losses:
|
0,00 |
0,00 |
0,00 |
0,00 |
0,00 |
|
|
A.IV. EXTRAORDINARY PROFIT (B.4+B.5+B.6+B.7+B.8-A.9-A.10-A.11-A.12-A.13):
|
0,00 |
0,00 |
0,00 |
0,00 |
3.571,00 |
|
|
A.V. PROFIT BEFORE TAXES (A.III+A.IV-B.III-B.IV): |
0,00 |
18.390,00 |
26.371,00 |
21.279,00 |
36.123,00 |
|
|
A.14. Corporation Tax: |
0,00 |
23.774,00 |
14.544,00 |
7.464,00 |
12.643,00 |
|
|
A.15. Miscellaneous taxes: |
0,00 |
0,00 |
0,00 |
0,00 |
0,00 |
|
|
A.VI. FINANCIAL YEAR RESULT (PROFIT) (A.V-A.14-A.15): |
0,00 |
0,00 |
11.828,00 |
13.815,00 |
23.480,00 |
|
MERCANTILE
REGISTRY.
|
|
EQUIVALENCIA |
EQUIVALENCIA |
EQUIVALENCIA |
ORIGINAL |
ORIGINAL |
|
|
CREDIT |
2012 |
2011 |
2010 |
2002 |
2001 |
|
|
B)
INCOME ( B.1 to B.8): |
771.122,00 |
1.203.566,00 |
984.774,00 |
407.995,00 |
469.828,00 |
|
|
B.1. Operating income: |
770.185,00 |
1.187.980,00 |
984.774,00 |
407.994,00 |
466.233,00 |
|
|
a) Net total sales:
|
770.185,00 |
1.187.980,00 |
984.774,00 |
407.994,00 |
466.233,00 |
|
|
b) Miscellaneous
operating income: |
0,00 |
0,00 |
0,00 |
0,00 |
0,00 |
|
|
B.I. PÉRDIDAS DE EXPLOTACIÓN (A.1+A.2+A.3+A.4+A.5-B.1 ): |
428.086,00 |
0,00 |
0,00 |
0,00 |
0,00 |
|
|
B.2. Financial income: |
0,00 |
1.905,00 |
0,00 |
1,00 |
25,00 |
|
|
a) Companies of the
group: |
0,00 |
1.905,00 |
0,00 |
0,00 |
0,00 |
|
|
b) In associated
companies: |
0,00 |
0,00 |
0,00 |
0,00 |
0,00 |
|
|
c) Miscellaneous:
|
0,00 |
0,00 |
0,00 |
1,00 |
25,00 |
|
|
d) Profit on
financial investment: |
0,00 |
0,00 |
0,00 |
0,00 |
0,00 |
|
|
B.3. Exchange gains: |
937,00 |
13.681,00 |
0,00 |
0,00 |
0,00 |
|
|
B.II. NEGATIVE FINANCIAL RESULTS (A.6+A.7+A.8-B.2-B.3): |
834.563,00 |
0,00 |
7.344,00 |
7.186,00 |
0,00 |
|
|
B.III. LOSSES ON ORDINARY ACTIVITIES ( B.I + B.II - A.I - A.II
): |
1.262.649,00 |
0,00 |
0,00 |
0,00 |
0,00 |
|
|
B.4. Profit on disposal of both tangible
and intangible fixed assets and securities portfolio: |
0,00 |
0,00 |
0,00 |
0,00 |
0,00 |
|
|
B.5. Profit on transactions with own
shares and debentures: |
0,00 |
0,00 |
0,00 |
0,00 |
0,00 |
|
|
B.6. Capital grants transferred to profit
and loss: |
0,00 |
0,00 |
0,00 |
0,00 |
0,00 |
|
|
B.7. Extraordinary income: |
0,00 |
0,00 |
0,00 |
0,00 |
3.571,00 |
|
|
B.8. Income and profit of former financial
years: |
0,00 |
0,00 |
0,00 |
0,00 |
0,00 |
|
|
B.IV. NEGATIVE EXTRAORDINARY RESULTS
(A.9+A.10+A.11+A.12+A.13-B.4-B.5-B.6-B.7-B.8): |
0,00 |
0,00 |
0,00 |
0,00 |
0,00 |
|
|
B.V. LOSSES BEFORE TAXES (B.III+B.IV-A.III-A.IV): |
1.262.649,00 |
0,00 |
0,00 |
0,00 |
0,00 |
|
|
B.VI. FINANCIAL YEAR RESULTS (LOSSES) (B.V+A.14+A.15): |
1.262.649,00 |
5.384,00 |
0,00 |
0,00 |
0,00 |
|
MERCANTILE
REGISTRY.
CASHFLOW
STATEMENT
Model: Normal
>
Source of information: Data contained in this section is taken from the
information declared in the Annual Accounts submitted to the Trade Register.
|
|
2012 |
2011 |
2010 |
2002 |
2001 |
|
|
1.
Fiscal year result before taxes.: 61100 |
-1.262.649,00 |
18.390,00 |
26.371,00 |
21.279,00 |
36.123,00 |
|
|
2.
Results adjustments.: 61200 |
15.467.067,00 |
-1.905,00 |
143,00 |
5.219,00 |
4.912,00 |
|
|
a) Fixed Assets Amortization (+).: 61201 |
1.523,00 |
0,00 |
143,00 |
5.220,00 |
4.937,00 |
|
|
c) Variation in Provision (+/-). : 61203 |
14.630.045,00 |
0,00 |
0,00 |
0,00 |
0,00 |
|
|
g) Financial income (-).: 61207 |
0,00 |
-1.905,00 |
0,00 |
-1,00 |
-25,00 |
|
|
h) Financial Expenses (+). : 61208 |
835.500,00 |
0,00 |
0,00 |
0,00 |
0,00 |
|
|
3.
Changes in current capital equity.: 61300 |
255.866,00 |
-66.756,00 |
-98.598,00 |
30.854,00 |
-16.376,00 |
|
|
d) Debtors and other accounts receivable (+/-). : 61302 |
266.964,00 |
-92.075,00 |
-186.597,00 |
76.047,00 |
-76.047,00 |
|
|
c) Other current assets (+/-). : 61303 |
5.457,00 |
34.699,00 |
-51.864,00 |
0,00 |
0,00 |
|
|
d) Creditors and other accounts payable (+/-). : 61304 |
-16.555,00 |
-9.380,00 |
139.863,00 |
-45.193,00 |
59.671,00 |
|
|
4.
Other cash flows for operating activities.: 61400 |
-835.500,00 |
1.905,00 |
0,00 |
1,00 |
25,00 |
|
|
a) Interest payments (-). : 61401 |
-835.500,00 |
0,00 |
0,00 |
0,00 |
0,00 |
|
|
c) Interest collection (+). : 61403 |
0,00 |
1.905,00 |
0,00 |
1,00 |
25,00 |
|
|
5.
Operating activity cash flows (1 + 2 + 3 + 4) : 61500 |
13.624.784,00 |
-48.366,00 |
-72.084,00 |
57.353,00 |
24.685,00 |
|
|
6.
Payments for investment (-).: 62100 |
-38.248.375,00 |
-2.284,00 |
0,00 |
-16.274,00 |
-9.273,00 |
|
|
a) Companies of the group and affiliates. : 62101 |
-38.248.375,00 |
0,00 |
0,00 |
0,00 |
0,00 |
|
|
c) Fixed assets. : 62103 |
0,00 |
-2.284,00 |
0,00 |
0,00 |
-9.273,00 |
|
|
h) Other assets. : 62108 |
0,00 |
0,00 |
0,00 |
-16.274,00 |
0,00 |
|
|
7.
Divestment payment collection (+). : 62200 |
1.523,00 |
0,00 |
0,00 |
5.220,00 |
0,00 |
|
|
c) Fixed assets. : 62203 |
1.523,00 |
0,00 |
0,00 |
5.220,00 |
0,00 |
|
|
8.
Investment activity cash flows (6 + 7) minus Amortization: 62300 |
-38.248.375,00 |
-2.284,00 |
-143,00 |
-16.274,00 |
-14.210,00 |
|
|
9.
Payment collection and payments for equity instruments. : 63100 |
1.715,00 |
42.887,00 |
281.412,00 |
-3.031,00 |
12.844,00 |
|
|
a) Issuance of equity instruments (+). : 63101 |
1.715,00 |
42.887,00 |
281.412,00 |
6.634,00 |
12.844,00 |
|
|
b) Amortization of assets instruments (-). : 63102 |
0,00 |
0,00 |
0,00 |
-9.665,00 |
0,00 |
|
|
10.
Payment collection and payments for financial liabilities instruments.:
63200 |
24.443.213,00 |
0,00 |
0,00 |
0,00 |
0,00 |
|
|
a) Issuance : 63201 |
24.443.213,00 |
0,00 |
0,00 |
0,00 |
0,00 |
|
|
3. Debts incurred with companies of the group and affiliates
(+).: 63204 |
24.443.213,00 |
0,00 |
0,00 |
0,00 |
0,00 |
|
|
11.
Payments from dividends and remunerations from other assets instruments. :
63300 |
0,00 |
0,00 |
0,00 |
0,00 |
0,00 |
|
|
12.
Cash flows for financing activities (9+10+11).: 63400 |
24.444.928,00 |
42.887,00 |
281.412,00 |
-3.031,00 |
12.844,00 |
|
|
D)
EFECTO DE LAS VARIACIONES DE LOS TIPOS DE CAMBIO: 64000 |
0,00 |
0,00 |
0,00 |
0,00 |
0,00 |
|
|
E)
NET INCREASE/DECREASE OF CASH OR EQUIVALENT ASSETS (+/-5+/-8+/12+/-D) :
65000 |
-178.663,00 |
-7.763,00 |
209.185,00 |
38.048,00 |
23.319,00 |
|
|
Cash or equivalent assets as of beginning of the fiscal year.:
65100 |
201.422,00 |
209.185,00 |
0,00 |
23.319,00 |
0,00 |
|
|
Cash or equivalent assets as of end of the fiscal year.:
65200 |
34.467,00 |
201.422,00 |
209.185,00 |
61.366,00 |
23.319,00 |
|
FINANCIAL DIAGNOSIS
> Economic-Financial Comparative Analysis
Data used in the following ratios and indicators is taken from the
Annual Accounts submitted by the company to the TRADE REGISTER.
>
Comparison within the Sector
|
Cash
Flow |
2012 |
2011 |
Variación
2012 - 2011 |
|
|||
|
|
Empresa |
Sector |
Empresa |
Sector |
Empresa |
Sector |
|
|
Cash
Flow over Sales: |
-0,22
% |
0,02
% |
-0,01
% |
0,14
% |
-3.217,11
% |
-86,47
% |
|
|
EBITDA
over Sales: |
-55,38
% |
-0,46
% |
0,24
% |
5,98
% |
-23.560,87
% |
-107,75
% |
|
|
Cash
Flow Yield: |
0,00
% |
0,00
% |
-0,02
% |
0,03
% |
71,94
% |
-87,24
% |
|
|
Profitability |
2012 |
2011 |
Variación
2012 - 2011 |
|
|||
|
|
Empresa |
Sector |
Empresa |
Sector |
Empresa |
Sector |
|
|
Operating
economic profitability: |
-912,07
% |
-3,35
% |
0,56
% |
0,35
% |
-162.559,25
% |
-1.061,10
% |
|
|
Total
economic profitability: |
-1,12
% |
-1,87
% |
3,68
% |
-0,19
% |
-130,30
% |
-891,69
% |
|
|
Financial
profitability: |
-135,74
% |
-6,60
% |
-1,63
% |
-3,85
% |
-8.238,37
% |
-71,64
% |
|
|
Margin:
|
-55,58
% |
-6,56
% |
0,24
% |
0,70
% |
-23.644,63
% |
-1.030,64
% |
|
|
Mark-up:
|
-163,94
% |
-14,21
% |
1,55
% |
-6,92
% |
-10.690,41
% |
-105,39
% |
|
|
Solvency |
2012 |
2011 |
Variación
2012 - 2011 |
|
|||
|
|
Empresa |
Sector |
Empresa |
Sector |
Empresa |
Sector |
|
|
Liquidity:
|
0,00 |
0,16 |
1,19 |
0,13 |
-99,88 |
17,24 |
|
|
Acid
Test: |
0,00 |
0,87 |
2,84 |
0,84 |
-99,93 |
2,75 |
|
|
Working
Capital / Investment: |
-0,84 |
0,08 |
0,66 |
0,11 |
-227,26 |
-24,27 |
|
|
Solvency:
|
0,00 |
1,44 |
2,95 |
1,50 |
-99,94 |
-3,90 |
|
|
Indebtedness |
2012 |
2011 |
Variación
2012 - 2011 |
|
|||
|
|
Empresa |
Sector |
Empresa |
Sector |
Empresa |
Sector |
|
|
Indebtedness
level: |
3,96 |
1,05 |
0,51 |
1,32 |
676,48 |
-19,92 |
|
|
Borrowing
Composition: |
0,00 |
1,19 |
0,00 |
1,24 |
|
-3,61 |
|
|
Repayment
Ability: |
-147,32 |
118,65 |
-21,74 |
16,79 |
-577,50 |
606,54 |
|
|
Warranty:
|
1,56 |
1,95 |
2,96 |
1,76 |
-47,39 |
10,90 |
|
|
Generated
resources / Total creditors: |
-0,05 |
-0,01 |
-0,03 |
0,01 |
-60,75 |
-192,26 |
|
|
Efficiency |
2012 |
2011 |
Variación
2012 - 2011 |
|
|||
|
|
Empresa |
Sector |
Empresa |
Sector |
Empresa |
Sector |
|
|
Productivity:
|
0,18 |
0,98 |
1,00 |
1,27 |
-81,57 |
-23,03 |
|
|
Turnover
of Collection Rights : |
65,79 |
3,45 |
4,26 |
3,45 |
1.443,17 |
0,24 |
|
|
Turnover
of Payment Entitlements: |
4,42 |
2,41 |
2,11 |
2,24 |
109,57 |
7,41 |
|
|
Stock
rotation: |
|
2,20 |
|
1,72 |
|
27,98 |
|
|
Assets
turnover: |
16,41 |
0,51 |
2,38 |
0,49 |
590,01 |
3,27 |
|
|
Borrowing
Cost: |
3,40 |
2,82 |
0,00 |
2,81 |
|
0,27 |
|
> Trend of indicators under the General Accounting Plan of 2007
(2012, 2011, 2010, 2002, 2001)
|
Cash
Flow |
2012 |
2011 |
2010 |
2002 |
2001 |
|
|
Cash
Flow over Sales: |
-0,22
% |
-0,01
% |
0,21
% |
9,33
% |
5,00
% |
|
|
EBITDA
over Sales: |
-55,38
% |
0,24
% |
3,44
% |
8,26
% |
8,04
% |
|
|
Cash
Flow Yield: |
0,00
% |
-0,02
% |
0,47
% |
46,57
% |
21,46
% |
|
|
Profitability |
2012 |
2011 |
2010 |
2002 |
2001 |
|
|
Operating
economic profitability: |
-912,07
% |
0,56
% |
7,53
% |
34,84
% |
29,94
% |
|
|
Total
economic profitability: |
-1,12
% |
3,68
% |
5,89
% |
26,05
% |
33,25
% |
|
|
Financial
profitability: |
-135,74
% |
-1,63
% |
4,03
% |
29,33
% |
64,64
% |
|
|
Margin:
|
-55,58
% |
0,24
% |
3,42
% |
6,98
% |
6,98
% |
|
|
Mark-up:
|
-163,94
% |
1,55
% |
2,68
% |
5,22
% |
6,98
% |
|
|
Solvency |
2012 |
2011 |
2010 |
2002 |
2001 |
|
|
Liquidity:
|
0,00 |
1,19 |
1,35 |
1,77 |
0,32 |
|
|
Acid
Test: |
0,00 |
2,84 |
2,56 |
1,77 |
1,37 |
|
|
Working
Capital / Investment: |
-0,84 |
0,66 |
0,66 |
0,53 |
0,25 |
|
|
Solvency:
|
0,00 |
2,95 |
2,90 |
2,24 |
1,37 |
|
|
Indebtedness |
2012 |
2011 |
2010 |
2002 |
2001 |
|
|
Indebtedness
level: |
3,96 |
0,51 |
0,53 |
0,73 |
1,99 |
|
|
Borrowing
Composition: |
0,00 |
0,00 |
0,00 |
0,00 |
0,00 |
|
|
Repayment
Ability: |
-147,32 |
-21,74 |
0,74 |
-1,12 |
4,41 |
|
|
Warranty:
|
1,56 |
2,96 |
2,90 |
2,36 |
1,50 |
|
|
Generated
resources / Total creditors: |
-0,05 |
-0,03 |
0,08 |
0,25 |
0,26 |
|
|
Efficiency |
2012 |
2011 |
2010 |
2002 |
2001 |
|
|
Productivity:
|
0,18 |
1,00 |
1,05 |
1,18 |
1,16 |
|
|
Turnover
of Collection Rights : |
65,79 |
4,26 |
5,28 |
|
6,13 |
|
|
Turnover
of Payment Entitlements: |
4,42 |
2,11 |
1,90 |
5,45 |
2,79 |
|
|
Assets
turnover: |
16,41 |
2,38 |
2,20 |
4,99 |
4,29 |
|
|
Borrowing
Cost: |
3,40 |
0,00 |
0,00 |
0,00 |
0,00 |
|
COMPARATIVE
SECTORIAL BALANCE
Sector-based Comparison
under the rules of the New General Accounting Plan.
|
Variación
- |
|
|
Empresa |
Sector |
|
Variación
- |
|
|
Empresa |
Sector |
|
Variación
- |
|
|
Empresa |
Sector |
Public
Tenders and Works Won
No Public Tenders assigned to the name of the company.
Research Summary
|
Founded in 2000, at the start of the year 2013, the subject
absorbed the activities of the company RETAPRINT SL (VAT number B96668140) so
it is now in a restructuring process. During 2012 the company acted as a
holding company which explains the economical and financial structure showed
by its balance sheet during this year. Cretaprint SL (VAT number B96668140)
had a turnover in 2012, of 30 millions of euros, with a profit of 4 and an
asset with 29,5 millions of Euros The subject usually meets its financial
obligations. |
Sources
|
|
Registry
of Commerce's Official Gazette. Own and external data bases Company
References |
FOREIGN EXCHANGE RATES
|
Currency |
Unit
|
Indian Rupees |
|
US Dollar |
1 |
Rs.61.10 |
|
UK Pound |
1 |
Rs.99.04 |
|
Euro |
1 |
Rs.79.03 |
INFORMATION DETAILS
|
Analysis Done by
: |
DIV |
|
|
|
|
Report Prepared
by : |
NIS |
RATING EXPLANATIONS
|
RATING |
STATUS |
PROPOSED CREDIT LINE |
|
|
|
>86 |
Aaa |
Possesses an extremely sound financial base with the strongest
capability for timely payment of interest and principal sums |
Unlimited |
|
|
71-85 |
Aa |
Possesses adequate working capital. No caution needed for credit
transaction. It has above average (strong) capability for payment of interest
and principal sums |
Large |
|
|
56-70 |
A |
Financial & operational base are regarded healthy. General unfavourable
factors will not cause fatal effect. Satisfactory capability for payment of
interest and principal sums |
Fairly Large |
|
|
41-55 |
Ba |
Overall operation is considered normal. Capable to meet normal
commitments. |
Satisfactory |
|
|
26-40 |
B |
Capability to overcome financial difficulties seems comparatively
below average. |
Small |
|
|
11-25 |
Ca |
Adverse factors
are apparent. Repayment of interest and principal sums in default or expected
to be in default upon maturity |
Limited with full security |
|
|
<10 |
C |
Absolute credit risk exists. Caution needed to be exercised |
Credit not
recommended |
|
|
-- |
NB |
New Business |
-- |
|
This score serves as a reference to assess SC’s credit risk and
to set the amount of credit to be extended. It is calculated from a composite
of weighted scores obtained from each of the major sections of this report. The
assessed factors and their relative weights (as indicated through %) are as
follows:
Financial
condition (40%) Ownership
background (20%) Payment
record (10%)
Credit history
(10%) Market trend
(10%) Operational
size (10%)
This report is issued at your request without any
risk and responsibility on the part of MIRA INFORM PRIVATE LIMITED (MIPL)
or its officials.