MIRA
INFORM REPORT
|
Report Date : |
22.09.2014 |
IDENTIFICATION DETAILS
|
Name : |
CLOCKWORK COMPONENTS LIMITED |
|
|
|
|
Formerly Known As : |
RUBYMOUNTAIN LIMITED |
|
|
|
|
Registered Office : |
Unit 6, Network Point, |
|
|
|
|
Country : |
|
|
|
|
|
Financials (as on) : |
30.06.2013 |
|
|
|
|
Date of Incorporation : |
15.03.2004 |
|
|
|
|
Com. Reg. No.: |
05073827 |
|
|
|
|
Legal Form : |
Private Limited With Share Capital |
|
|
|
|
Line of Business : |
Wholesale of Other Intermediate Products. |
|
|
|
|
No of Employees : |
Not Available |
RATING & COMMENTS
|
MIRA’s Rating : |
Ca |
|
RATING |
STATUS |
PROPOSED CREDIT LINE |
|
|
11-25 |
Ca |
Adverse factors are apparent. Repayment of interest and principal sums
in default or expected to be in default upon maturity |
Limited with
full security |
|
Status : |
Moderate |
|
Payment Behaviour : |
No Complaints |
|
Litigation : |
Clear |
NOTES :
Any query related to this report can be made
on e-mail : infodept@mirainform.com
while quoting report number, name and date.
ECGC Country Risk Classification List – June 1, 2014
|
Country Name |
Previous Rating (31.03.2014) |
Current Rating (01.06.2014) |
|
United Kingdom |
A1 |
A1 |
|
Risk Category |
ECGC
Classification |
|
Insignificant |
A1 |
|
Low |
A2 |
|
Moderate |
B1 |
|
High |
B2 |
|
Very High |
C1 |
|
Restricted |
C2 |
|
Off-credit |
D |
UNITED KINGDOM - ECONOMIC OVERVIEW
The UK, a leading trading
power and financial center, is the third largest economy in Europe after Germany
and France. Over the past two decades, the government has greatly reduced
public ownership. Agriculture is intensive, highly mechanized, and efficient by
European standards, producing about 60% of food needs with less than 2% of the
labor force. The UK has large coal, natural gas, and oil resources, but its oil
and natural gas reserves are declining and the UK became a net importer of
energy in 2005. Services, particularly banking, insurance, and business
services, are key drivers of British GDP growth. Manufacturing, meanwhile, has
declined in importance but still accounts for about 10% of economic output.
After emerging from recession in 1992, Britain's economy enjoyed the longest
period of expansion on record during which time growth outpaced most of Western
Europe. In 2008, however, the global financial crisis hit the economy
particularly hard, due to the importance of its financial sector. Falling home
prices, high consumer debt, and the global economic slowdown compounded
Britain's economic problems, pushing the economy into recession in the latter
half of 2008 and prompting the then BROWN (Labour)
government to implement a number of measures to stimulate the economy and
stabilize the financial markets; these included nationalizing parts of the banking
system, temporarily cutting taxes, suspending public sector borrowing rules,
and moving forward public spending on capital projects. Facing burgeoning
public deficits and debt levels, in 2010 the CAMERON-led coalition government
(between Conservatives and Liberal Democrats) initiated a five-year austerity
program, which aimed to lower London's budget deficit from about 11% of GDP in
2010 to nearly 1% by 2015. In November 2011, Chancellor of the Exchequer George
OSBORNE announced additional austerity measures through 2017 largely due to the
euro-zone debt crisis. The CAMERON government raised the value added tax from
17.5% to 20% in 2011. It has pledged to reduce the corporation tax rate to 21%
by 2014. The Bank of England (BoE) implemented an
asset purchase program of £375 billion (approximately $605 billion) as of
December 2013. During times of economic crisis, the BoE
coordinates interest rate moves with the European Central Bank, but Britain
remains outside the European Economic and Monetary Union (EMU). In 2012, weak
consumer spending and subdued business investment weighed on the economy,
however, in 2013 GDP grew 1.4%, accelerating unexpectedly in the second half of
the year because of greater consumer spending and a recovering housing market.
The budget deficit is falling but remains high at nearly 7% and public debt has
continued to increase.
|
Source
: CIA |
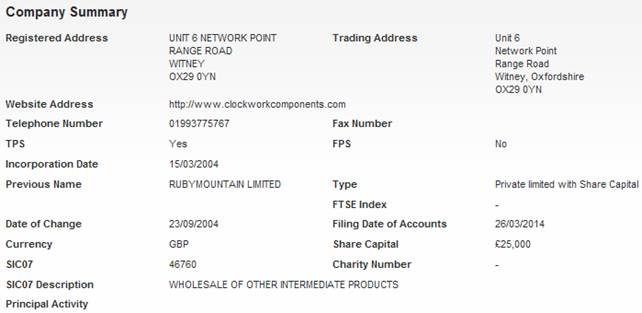
REGISTERED NAME & COMPANY
SUMMARY
COMPANY NAME: Clockwork Components Limited
COMPANY NO.: 05073827
COMPANY STATUS: Active-Accounts Filed
DIRECTORS/MANAGEMENT
Current Directors
|
Name |
Christopher Mark Plews |
Date of Birth |
02/11/1962 |
|
Officers Title |
Mr |
Nationality |
British |
|
Present Appointments |
4 |
Function |
Director |
|
Appointment Date |
22/07/2008 |
|
|
|
Address |
14 Turnpike Road, Oxford, Oxfordshire, OX2
9JQ |
||
|
Other Actions |
View Director Report |
View Consumer Report |
View AML Report |
|
|
View Trace Report |
|
|
|
Name |
James Justin Viney |
Date of Birth |
11/05/1966 |
|
Officers Title |
Mr |
Nationality |
British |
|
Present Appointments |
4 |
Function |
Director |
|
Appointment Date |
16/03/2004 |
|
|
|
Address |
Mount Owen Farm, Mount Owen Road Lew, Bampton, Oxfordshire, OX18 2BE |
||
|
Other Actions |
View Director Report |
View Consumer Report |
View AML Report |
|
|
View Trace Report |
|
|
|
Name |
Oliver Charles Richard Tattersall |
Date of Birth |
15/01/1974 |
|
Officers Title |
Mr |
Nationality |
British |
|
Present Appointments |
1 |
Function |
Director |
|
Appointment Date |
22/07/2008 |
|
|
|
Address |
97a Lower End, Leafield, Oxfordshire,
OX29 9QG |
||
NEGATIVE INFORMATION
CCJ
|
Total Number of Exact CCJs - |
0 |
Total Value of Exact CCJs - |
|
|
Total Number of Possible CCJs - |
0 |
Total Value of Possible CCJs - |
|
|
Total Number of Satisfied CCJs - |
0 |
Total Value of Satisfied CCJs - |
|
|
Total Number of Writs - |
- |
|
|
Exact CCJ Details
|
No CCJs found |
Possible CCJs Details
|
There are no possible CCJ details |
Writ Details
|
No writs found |
SHARE & SHARE CAPITAL
INFORMATION
Top 20
Shareholders
|
Name |
Currency |
Share Count |
Share Type |
Nominal Value |
% of Total Share Count |
|
CLOCKWORK HOLDINGS LTD |
GBP |
25,000 |
ORDINARY |
1 |
100 |
GROUP STRUCTURE & AFFILIATED
COMPANIES
Statistics
|
Group |
2 companies |
|
Linkages |
0 companies |
|
Countries |
In 0 countries |
Summary
|
Holding Company |
CLOCKWORK HOLDINGS LIMITED |
|
Ownership Status |
Wholly Owned |
|
Ultimate Holding Company |
CLOCKWORK HOLDINGS LIMITED |
Group structure
|
Company Name |
|
Registered
Number |
Latest Key
Financials |
Consol. Accounts |
Turnover |
|
|
|
03693141 |
30.06.2013 |
N |
|
|
|
|
05073827 |
30.06.2013 |
N |
|
FINANCIAL INFORMATION
Profit & Loss
|
Date Of Accounts |
30/06/13 |
(%) |
30/06/12 |
(%) |
30/06/11 |
(%) |
30/06/10 |
(%) |
30/06/09 |
|
Weeks |
52 |
(%) |
52 |
(%) |
52 |
(%) |
52 |
(%) |
52 |
|
Currency |
GBP |
(%) |
GBP |
(%) |
GBP |
(%) |
GBP |
(%) |
GBP |
|
Consolidated A/cs |
N |
(%) |
N |
(%) |
N |
(%) |
N |
(%) |
N |
|
Turnover |
- |
- |
- |
- |
- |
- |
- |
- |
- |
|
Export |
- |
- |
- |
- |
- |
- |
- |
- |
- |
|
Cost of Sales |
- |
- |
- |
- |
- |
- |
- |
- |
- |
|
Gross Profit |
- |
- |
- |
- |
- |
- |
- |
- |
- |
|
Wages & Salaries |
- |
- |
- |
- |
- |
- |
- |
- |
- |
|
Directors Emoluments |
- |
- |
- |
- |
- |
- |
- |
- |
- |
|
Operating Profit |
- |
- |
- |
- |
- |
- |
- |
- |
- |
|
Depreciation |
£70,492 |
58.9% |
£44,354 |
-11.3% |
£50,010 |
-26.3% |
£67,884 |
-36.8% |
£107,471 |
|
Audit Fees |
- |
- |
- |
- |
- |
- |
- |
- |
- |
|
Interest Payments |
- |
- |
- |
- |
- |
- |
- |
- |
- |
|
Pre Tax Profit |
- |
- |
- |
- |
- |
- |
- |
- |
- |
|
Taxation |
- |
- |
- |
- |
- |
- |
- |
- |
- |
|
Profit After Tax |
- |
- |
- |
- |
- |
- |
- |
- |
- |
|
Dividends Payable |
- |
- |
- |
- |
- |
- |
- |
- |
- |
|
Retained Profit |
- |
- |
- |
- |
- |
- |
- |
- |
- |
Balance Sheet
|
Date Of Accounts |
30/06/13 |
(%) |
30/06/12 |
(%) |
30/06/11 |
(%) |
30/06/10 |
(%) |
30/06/09 |
|
Tangible Assets |
£201,219 |
127.8% |
£88,329 |
-17.1% |
£106,573 |
-16.3% |
£127,256 |
-12.3% |
£145,130 |
|
Intangible Assets |
0 |
- |
0 |
- |
0 |
- |
0 |
- |
0 |
|
Total Fixed Assets |
£201,219 |
127.8% |
£88,329 |
-17.1% |
£106,573 |
-16.3% |
£127,256 |
-12.3% |
£145,130 |
|
Stock |
£710,639 |
19.4% |
£594,934 |
3.9% |
£572,378 |
13% |
£506,503 |
18.7% |
£426,634 |
|
Trade Debtors |
£1,717,687 |
-8.3% |
£1,872,860 |
1.1% |
£1,852,277 |
16.8% |
£1,585,309 |
38.3% |
£1,146,002 |
|
Cash |
£35,680 |
-66.7% |
£107,065 |
999.9% |
£5,618 |
-25.5% |
£7,538 |
-60.2% |
£18,926 |
|
Other Debtors |
0 |
-100% |
£2,040 |
- |
0 |
- |
0 |
-100% |
£153,989 |
|
Miscellaneous Current Assets |
0 |
- |
0 |
- |
0 |
- |
0 |
- |
0 |
|
Total Current Assets |
£2,464,006 |
-4.4% |
£2,576,899 |
6% |
£2,430,273 |
15.8% |
£2,099,350 |
20.3% |
£1,745,551 |
|
Trade Creditors |
£1,916,450 |
-0.9% |
£1,934,478 |
-3.7% |
£2,008,340 |
2.4% |
£1,960,789 |
15.3% |
£1,700,911 |
|
Bank Loans & Overdrafts |
0 |
- |
0 |
- |
0 |
- |
0 |
- |
0 |
|
Other Short Term Finance |
0 |
- |
0 |
- |
0 |
- |
0 |
- |
0 |
|
Miscellaneous Current Liabilities |
0 |
- |
0 |
- |
0 |
- |
0 |
- |
0 |
|
Total Current Liabilities |
£1,916,450 |
-0.9% |
£1,934,478 |
-3.7% |
£2,008,340 |
2.4% |
£1,960,789 |
15.3% |
£1,700,911 |
|
Bank Loans & Overdrafts and LTL |
£80,940 |
671.4% |
£10,492 |
-57.8% |
£24,855 |
-54.6% |
£54,793 |
35% |
£40,581 |
|
Other Long Term Finance |
0 |
- |
0 |
- |
0 |
- |
0 |
- |
0 |
|
Total Long Term Liabilities |
£80,940 |
671.4% |
£10,492 |
-57.8% |
£24,855 |
-54.6% |
£54,793 |
35% |
£40,581 |
Capital & Reserves
|
Date Of Accounts |
30/06/13 |
(%) |
30/06/12 |
(%) |
30/06/11 |
(%) |
30/06/10 |
(%) |
30/06/09 |
|
Called Up Share Capital |
£25,000 |
- |
£25,000 |
- |
£25,000 |
- |
£25,000 |
- |
£25,000 |
|
P & L Account Reserve |
£642,835 |
-7.5% |
£695,258 |
45.3% |
£478,651 |
157.3% |
£186,024 |
49.8% |
£124,189 |
|
Revaluation Reserve |
- |
- |
- |
- |
- |
- |
- |
- |
- |
|
Sundry Reserves |
- |
- |
- |
- |
- |
- |
- |
- |
- |
|
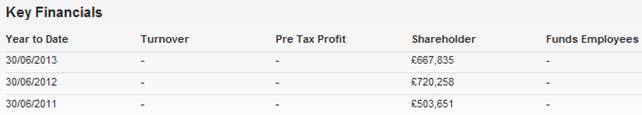
Shareholder Funds |
£667,835 |
-7.3% |
£720,258 |
43% |
£503,651 |
138.7% |
£211,024 |
41.4% |
£149,189 |
Other Financial
Items
|
Date Of Accounts |
30/06/13 |
(%) |
30/06/12 |
(%) |
30/06/11 |
(%) |
30/06/10 |
(%) |
30/06/09 |
|
Net Worth |
£667,835 |
-7.3% |
£720,258 |
43% |
£503,651 |
138.7% |
£211,024 |
41.4% |
£149,189 |
|
Working Capital |
£547,556 |
-14.8% |
£642,421 |
52.3% |
£421,933 |
204.5% |
£138,561 |
210.4% |
£44,640 |
|
Total Assets |
£2,665,225 |
0% |
£2,665,228 |
5.1% |
£2,536,846 |
13.9% |
£2,226,606 |
17.8% |
£1,890,681 |
|
Total Liabilities |
£1,997,390 |
2.7% |
£1,944,970 |
-4.3% |
£2,033,195 |
0.9% |
£2,015,582 |
15.7% |
£1,741,492 |
|
Net Assets |
£667,835 |
-7.3% |
£720,258 |
43% |
£503,651 |
138.7% |
£211,024 |
41.4% |
£149,189 |
Cash Flow
|
Date Of Accounts |
30/06/13 |
(%) |
30/06/12 |
(%) |
30/06/11 |
(%) |
30/06/10 |
(%) |
30/06/09 |
|
Net Cashflow from Operations |
- |
- |
- |
- |
- |
- |
- |
- |
- |
|
Net Cashflow before Financing |
- |
- |
- |
- |
- |
- |
- |
- |
- |
|
Net Cashflow from Financing |
- |
- |
- |
- |
- |
- |
- |
- |
- |
|
Increase in Cash |
- |
- |
- |
- |
- |
- |
- |
- |
- |
Miscellaneous
|
Date Of Accounts |
30/06/13 |
(%) |
30/06/12 |
(%) |
30/06/11 |
(%) |
30/06/10 |
(%) |
30/06/09 |
|
Contingent Liability |
NO |
- |
NO |
- |
NO |
- |
NO |
- |
NO |
|
Capital Employed |
£748,775 |
2.5% |
£730,750 |
38.3% |
£528,506 |
98.8% |
£265,817 |
40.1% |
£189,770 |
|
Number of Employees |
- |
- |
- |
- |
- |
- |
- |
- |
- |
|
Auditors |
HAINES WATTS |
||||||||
|
Auditor Comments |
The audit report contains no adverse comments |
||||||||
|
Bankers |
|
||||||||
|
Bank Branch Code |
|
||||||||
Ratios
|
Date Of Accounts |
30/06/13 |
30/06/12 |
30/06/11 |
30/06/10 |
30/06/09 |
|
Pre-tax profit margin % |
- |
- |
- |
- |
- |
|
Current ratio |
1.29 |
1.33 |
1.21 |
1.07 |
1.03 |
|
Sales/Net Working Capital |
- |
- |
- |
- |
- |
|
Gearing % |
12.10 |
1.50 |
4.90 |
26 |
27.20 |
|
Equity in % |
25.10 |
27 |
19.90 |
9.50 |
7.90 |
|
Creditor Days |
- |
- |
- |
- |
- |
|
Debtor Days |
- |
- |
- |
- |
- |
|
Liquidity/Acid Test |
0.91 |
1.02 |
0.92 |
0.81 |
0.77 |
|
Return On Capital Employed % |
- |
- |
- |
- |
- |
|
Return On Total Assets Employed % |
- |
- |
- |
- |
- |
|
Current Debt Ratio |
2.86 |
2.68 |
3.98 |
9.29 |
11.40 |
|
Total Debt Ratio |
2.99 |
2.70 |
4.03 |
9.55 |
11.67 |
|
Stock Turnover Ratio % |
- |
- |
- |
- |
- |
|
Return on Net Assets Employed % |
- |
- |
- |
- |
- |
Creditor Details
|
|
Total Number |
Total Value |
|
Trade Creditors |
0 |
- |
|
No Creditor Data |
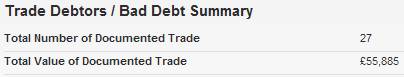
Trade Debtors /
Bad Debt Detail
|
|
Total Number of Documented Trade |
Total Value of Documented Trade |
|
Trade Debtors |
27 |
£55,885 |
|
|
|
|
|
Company Name |
Amount |
Statement Date |
|
Freestyle Of London Limited |
£12,402 |
06/09/2012 |
|
Botley Furniture Limited |
£10,552 |
25/02/2011 |
|
Nottingham Trophies Limited |
£8,648 |
28/06/2011 |
|
Gainsborough Reproductions Limited |
£3,563 |
13/03/2013 |
|
Sofa Classics Limited |
£3,339 |
30/04/2010 |
|
Glenbery Upholstery Limited |
£2,655 |
17/09/2009 |
|
The Chesterfield Workshop Ltd |
£2,380 |
20/03/2012 |
|
Ipec Furniture Limited |
£1,563 |
21/06/2012 |
|
Gingko Design Furniture Ltd |
£1,435 |
25/09/2012 |
|
U B U Limited |
£1,433 |
18/05/2010 |
|
Jade Classic Designs Limited |
£1,249 |
26/02/2013 |
|
J C & M P Smith Limited |
£1,030 |
20/08/2014 |
|
Tract Limited |
£929 |
13/05/2011 |
|
Wharram Designs Limited |
£839 |
14/07/2014 |
|
S & L Upholstery (South Wales) Ltd |
£656 |
30/06/2010 |
|
U B U Manufacturing Ltd |
£565 |
22/12/2011 |
|
Classix Design Ltd |
£487 |
29/11/2012 |
|
Hide And Chic Limited |
£461 |
09/06/2010 |
|
C F S Furniture Ltd |
£259 |
02/02/2012 |
|
Lancaster Partners Ltd |
£226 |
02/07/2013 |
|
Designer Trade Furniture Ltd |
£216 |
07/02/2014 |
|
L Neumann Overseas Limited |
£201 |
19/08/2011 |
|
Swanglen Furniture Ltd |
£188 |
04/07/2013 |
|
Manor House Upholstery Limited |
£186 |
19/03/2013 |
|
Sovereign Sofas Limited |
£175 |
19/04/2011 |
|
In Stitches Upholstery Ltd |
£135 |
26/08/2010 |
|
Angraves Cane Furniture Ltd |
£113 |
10/01/2011 |
FOREIGN EXCHANGE RATES
N/a
ADDITIONAL INFORMATION
Current Company
Secretary
|
Name |
Christopher Mark Plews |
Date of Birth |
02/11/1962 |
|
Officers Title |
Mr |
Nationality |
British |
|
Present Appointments |
4 |
Function |
Company Secretary |
|
Appointment Date |
26/04/2006 |
|
|
|
Address |
14 Turnpike Road, Oxford, Oxfordshire, OX2
9JQ |
||
Status History
|
No Status History found |
Event History
|
Date |
Description |
|
05/04/2014 |
Annual Returns |
|
05/04/2014 |
New Accounts Filed |
|
05/04/2014 |
New Accounts Filed |
|
12/04/2013 |
New Accounts Filed |
|
03/04/2013 |
Annual Returns |
|
27/04/2012 |
Annual Returns |
|
02/04/2012 |
New Accounts Filed |
|
09/04/2011 |
New Accounts Filed |
|
30/03/2011 |
Annual Returns |
|
17/04/2010 |
Annual Returns |
|
10/04/2010 |
New Accounts Filed |
|
10/05/2009 |
New Accounts Filed |
|
08/04/2009 |
Annual Returns |
|
01/01/2009 |
New Board Member Mr C.M. Plews
appointed |
|
19/09/2008 |
New Board Member Mr O.C. Tattersall
appointed |
Previous Company
Names
|
Date |
Previous Name |
|
23/09/2004 |
RUBYMOUNTAIN LIMITED |
Previous
Director/Company Secretaries
|
Name |
Current
Directorships |
Previous
Directorships |
|
Robert William Loosemore |
2 |
67 |
|
Robert William Loosemore |
2 |
67 |
|
CORPORATE APPOINTMENTS LIMITED |
561 |
34023 |
|
SECRETARIAL APPOINTMENTS LIMITED |
644 |
34994 |
NOTES & COMMENTS
Commentary
|
There has been no significant change in the company's credit rating. |
|
|
There is insufficient data to indicate a change in this company's
percentage of sales. |
|
|
There is insufficient data to indicate a change in this company's
pre-tax profit. |
|
|
No recent changes in directorship are recorded. |
|
|
The company is part of a group. |
|
|
No exact match CCJs are recorded against the
company. |
|
|
Net Worth increased by 43% during the latest trading period. |
|
|
A 5.1% growth in Total Assets occurred during the latest trading
period. |
|
|
The company saw an increase in their Cash Balance of 999.9% during the
latest trading period. |
|
|
The audit report contains no adverse comments. |
|
|
The movement in accumulated earnings would indicate that the company
made a profit after tax and other appropriations, including dividends. |
|
|
The company was established over 10 years ago. |
|
FOREIGN EXCHANGE RATES
|
Currency |
Unit
|
Indian Rupees |
|
US Dollar |
1 |
Rs.60.81 |
|
|
1 |
Rs.100.06 |
|
Euro |
1 |
Rs.78.47 |
INFORMATION DETAILS
|
Analysis Done by
: |
SUM |
|
|
|
|
Report Prepared
by : |
TPT |
RATING EXPLANATIONS
|
RATING |
STATUS |
PROPOSED CREDIT LINE |
|
|
>86 |
Aaa |
Possesses an extremely sound financial base with the strongest
capability for timely payment of interest and principal sums |
Unlimited |
|
71-85 |
Aa |
Possesses adequate working capital. No caution needed for credit transaction.
It has above average (strong) capability for payment of interest and
principal sums |
Large |
|
56-70 |
A |
Financial & operational base are regarded healthy. General unfavourable factors will not cause fatal effect.
Satisfactory capability for payment of interest and principal sums |
Fairly Large |
|
41-55 |
Ba |
Overall operation is considered normal. Capable to meet normal
commitments. |
Satisfactory |
|
26-40 |
B |
Capability to overcome financial difficulties seems comparatively
below average. |
Small |
|
11-25 |
Ca |
Adverse factors
are apparent. Repayment of interest and principal sums in default or expected
to be in default upon maturity |
Limited with full security |
|
<10 |
C |
Absolute credit risk exists. Caution needed to be exercised |
Credit not
recommended |
|
-- |
NB |
New Business |
-- |
This score serves as a reference to assess SC’s credit risk
and to set the amount of credit to be extended. It is calculated from a
composite of weighted scores obtained from each of the major sections of this
report. The assessed factors and their relative weights (as indicated through
%) are as follows:
Financial
condition (40%) Ownership
background (20%) Payment
record (10%)
Credit history
(10%) Market trend
(10%) Operational
size (10%)
This report is issued at your request without any
risk and responsibility on the part of MIRA INFORM PRIVATE LIMITED (MIPL)
or its officials.