MIRA
INFORM REPORT
|
Report Date : |
22.09.2014 |
IDENTIFICATION DETAILS
|
Name : |
MICROCHIP TECHNOLOGY |
|
|
|
|
Registered Office : |
Block W |
|
|
|
|
Country : |
|
|
|
|
|
Financials (as on) : |
31.03.2012 |
|
|
|
|
Date of Incorporation : |
13.02.2004 |
|
|
|
|
Com. Reg. No.: |
IE381811 |
|
|
|
|
Legal Form : |
Private Unlimited with Share Capital |
|
|
|
|
Line of Business : |
·
Repairs of Electrical Equipment The Importation and |
|
|
|
|
No. of Employees : |
14 |
RATING & COMMENTS
|
MIRA’s Rating : |
Ba |
|
RATING |
STATUS |
PROPOSED CREDIT LINE |
|
|
41-55 |
Ba |
Overall operation is considered normal. Capable to meet normal
commitments. |
Satisfactory |
|
Status : |
Satisfactory |
|
|
|
|
Payment Behaviour : |
Slow but correct |
|
|
|
|
Litigation : |
Clear |
NOTES:
Any query related to this report can be made
on e-mail: infodept@mirainform.com
while quoting report number, name and date.
ECGC Country Risk Classification List – June 1, 2014
|
Country Name |
Previous Rating (31.03.2014) |
Current Rating (01.06.2014) |
|
|
B1 |
A2 |
|
Risk Category |
ECGC
Classification |
|
Insignificant |
A1 |
|
Low |
A2 |
|
Moderate |
B1 |
|
High |
B2 |
|
Very High |
C1 |
|
Restricted |
C2 |
|
Off-credit |
D |
|
Source
: CIA |
REGISTERED NAME
Company Name: MICROCHIP TECHNOLOGY
Company No: IE381811
Registered Address: BLOCK W GROUND FLOOR EAST POINT BUSINESS PARK
COMPANY SUMMARY
Registered Address: BLOCK W GROUND FLOOR EAST POINT BUSINESS PARK
Trading Address: 1st Floor, Block 31
Website Address: --
Tel No.: --
Fax No: --
TPS No
FPS No
Incorporated Number: 13/02/2004
Previous Name --
Type Private
Unlimited with Share Capital
Currency USD
Share Capital €11
SIC07 33140
Charity Number --
SIC07 Description Repair
of Electrical Equipment
Principal Activity The Importation and
DIRECTORS/MANAGEMENT
|
Total Current Directors |
3 |
|
Total Current
Secretaries |
1 |
|
Total Previous Directors
/ Company Secretaries |
4 |
Current Directors
|
Name |
NAWAZ SHARIF |
Date of Birth |
16/03/1970 |
|
Officers Title |
|
Nationality |
|
|
Present Appointments |
2 |
Function |
Director |
|
Appointment Date |
13/02/2004 |
|
|
|
Address |
13 KINGHORN PARK,
MAIDENHEAD, |
||
|
Other Actions |
View Director Report |
|
View AML Report |
|
|
|
|
|
|
Name |
SANDRA MARIE GRAHAM |
Date of Birth |
08/11/1964 |
|
Officers Title |
|
Nationality |
|
|
Present Appointments |
1 |
Function |
Director |
|
Appointment Date |
21/09/2011 |
|
|
|
Address |
91 THE VILLAGE,
BETTYGLEN, RAHENY, |
||
|
Other Actions |
View Director Report |
|
View AML Report |
|
|
|
|
|
|
Name |
JAMES ERIC BJORNHOLT |
Date of Birth |
01/08/1970 |
|
Officers Title |
|
Nationality |
|
|
Present Appointments |
1 |
Function |
Director |
|
Appointment Date |
02/12/2013 |
|
|
|
Address |
|
||
|
Other Actions |
View Director Report |
|
View AML Report |
|
|
|
|
|
Current Company Secretary
|
Name |
NAWAZ SHARIF |
Date of Birth |
16/03/1970 |
|
Officers Title |
|
Nationality |
|
|
Present Appointments |
2 |
Function |
Company Secretary |
|
Appointment Date |
13/02/2004 |
|
|
|
Address |
13 KINGHORN PARK, MAIDENHEAD,
|
||
Previous Director/Company Secretaries
|
Name |
Current Directorships |
Previous Directorships |
|
BJORNHOLT JAMES ERIC |
0 |
1 |
|
KIERON HAYES |
17 |
17 |
|
GARY PAUL MARSH |
0 |
1 |
|
GORDON WATTERS PARNELL |
0 |
1 |
NEGATIVE INFORMATION
Mortgage Summary
· Total Mortgage 0
· Outstanding 0
· Satisfied 0
CJ
|
Total Number of Exact CJs - |
0 |
Total Value of Exact CJs - |
€0 |
|
Total Number of Possible CJs - |
0 |
Total Value of Possible CJs - |
€0 |
|
Total Number of Satisfied CJs - |
0 |
Total Value of Satisfied CJs - |
€0 |
Possible CJ Details
There are no
possible CJ details
Writ Details
Unregistered - Exact CJ Details
|
No CJs found |
Unregistered - Possible CJ Details
|
No CJs found |
Registered - Exact CJ Details
|
No CJs found |
Registered - Possible CJ Details
|
No CJs found |
SHARE & SHARE CAPITAL
INFORMATION
Top 20 Shareholders
|
Name |
Currency |
Share Count |
Share Type |
Nominal Value |
% of Total Share Count |
|
MICROCHIP TECHNOLOGY
JERSEY LIMITED |
USD |
9 |
ORDINARY |
1 |
81.82 |
|
MCHP TECHNOLOGY |
USD |
1 |
DEFERRED |
1 |
9.09 |
|
MCHP TECHNOLOGY |
USD |
1 |
ORDINARY |
1 |
9.09 |
PAYMENT INFORMATION
Trade Debtors / Bad Debt Summary
· Total Number of Documented Trade 0
· Total Value of Documented Trade €0
Trade Payment Information
|
Average Invoice Value |
n/a |
|
Invoices available |
n/a |
|
Paid |
n/a |
|
Outstanding |
n/a |
Trade Payment Data is information that we collect from selected third party partners who send us information about their whole sales ledger.
|
Average Invoice Value |
n/a |
|
Invoices available |
n/a |
|
Paid |
n/a |
|
Outstanding |
n/a |
|
Trade Payment Data is information that we
collect from selected third party partners who send us information about
their whole sales ledger. |
|
|
Within Terms |
0-30 Days |
31-60 Days |
61-90 Days |
91+ Days |
|
Paid |
|
|
|
|
|
|
Outstanding |
|
|
|
|
|
GROUP STRUCTURE & AFFILIATED
COMPANIES
Statistics
|
Group |
5 companies |
|
Linkages |
15 companies |
|
Countries |
In 5 countries |
Summary
|
Holding Company |
- |
|
Ownership Status |
Intermediately Owned |
|
Ultimate Holding Company
|
MICROCHIP TECHNOLOGY,
INC |
Group structure
|
Company Name |
|
Registered Number |
Latest Key Financials |
Consol. Accounts |
Turnover |
|
MICROCHIP TECHNOLOGY, INC |
|
|
- |
- |
$1,581,623,000 |
|
|
|
03593068 |
31.03.2014 |
N |
|
|
MICROCHIP TECHNOLOGY |
|
N/A |
- |
- |
|
|
MICROCHIP TECHNOLOGY... |
|
IE381811 |
31.03.2012 |
N |
€696,541,516 |
|
MICROCHIP LIMITED |
|
02189500 |
31.03.2013 |
N |
|
Other Linked companies
|
Name |
|
Number |
Latest Key Financials |
Turnover |
|
MICROCHIP TECHNOLOGY ( |
|
33236121 |
31.03.2013 |
|
|
SILICON STORAGE TECHNOLOGY B.V. |
|
50972472 |
31.03.2013 |
|
|
MICROCHIP TECHNOLOGY GMBH |
|
HRB 85450 |
31.03.2013 |
|
|
K2L GMBH & CO. KG |
|
HRA 100781 |
- |
|
|
G2 MICROSYSTEMS, INC |
|
|
- |
|
|
SYMWAVE INC |
|
|
- |
$1,100,000 |
|
SST COMMUNICATIONS CORP |
|
|
- |
|
|
SUPERTEX, INC |
|
|
- |
|
|
SILICON STORAGE TECHNOLOGY, INC |
|
|
- |
$1,390,000,000 |
|
ROVING NETWORKS, INC |
|
|
- |
|
|
BRIDGECO, INC |
|
|
- |
|
|
R & E INTERNATIONAL CORP |
|
|
- |
$5,000,000 |
|
STANDARD MICROSYSTEMS CORP |
|
|
- |
$325,496,000 |
|
MICROCHIP TECHNOLOGY ( |
|
|
- |
|
|
MICROCHIP TECHNOLOGY ( |
|
|
- |
|
FINANCIAL INFORMATION
Profit & Loss
|
|
Date Of Accounts |
31/03/12 |
(%) |
31/03/11 |
(%) |
31/03/10 |
(%) |
31/03/09 |
(%) |
31/03/08 |
|
|
Weeks |
52 |
(%) |
52 |
(%) |
52 |
(%) |
52 |
(%) |
52 |
|
|
Currency |
EUR |
(%) |
EUR |
(%) |
EUR |
(%) |
EUR |
(%) |
EUR |
|
|
Consolidated A/cs |
N |
(%) |
N |
(%) |
N |
(%) |
N |
(%) |
N |
|
|
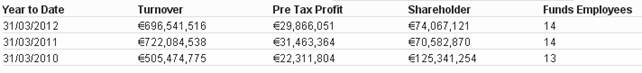
Turnover |
€696,541,516 |
-3.5% |
€722,084,538 |
42.9% |
€505,474,775 |
11.8% |
€452,314,608 |
-7.3% |
€487,789,960 |
|
|
Export |
- |
- |
- |
- |
- |
- |
- |
- |
- |
|
|
Cost of Sales |
€373,123,943 |
-5% |
€392,750,390 |
46.2% |
€268,625,953 |
19.5% |
€224,753,471 |
-3.3% |
€232,517,460 |
|
|
Gross Profit |
€323,417,572 |
-1.8% |
€329,334,148 |
39% |
€236,848,822 |
4.1% |
€227,561,136 |
-10.9% |
€255,272,500 |
|
|
Wages & Salaries |
€730,504 |
-1.5% |
€741,476 |
25.6% |
€590,347 |
-6% |
€628,310 |
-4.9% |
€660,686 |
|
|
Directors Emoluments |
€335,729 |
-24.6% |
€445,012 |
60.2% |
€277,855 |
-11.9% |
€315,340 |
-54.3% |
€690,455 |
|
|
Operating Profit |
€29,622,205 |
-4.5% |
€31,014,084 |
41.8% |
€21,877,351 |
10.8% |
€19,736,090 |
-6.5% |
€21,113,251 |
|
|
Depreciation |
€14,939 |
66.2% |
€8,989 |
-30.8% |
€12,982 |
-63.7% |
€35,774 |
-0.2% |
€35,832 |
|
|
Audit Fees |
€98,942 |
4% |
€95,165 |
4.1% |
€91,420 |
3.9% |
€87,963 |
-36.3% |
€138,004 |
|
|
Interest Payments |
- |
- |
- |
- |
- |
- |
- |
- |
- |
|
|
Pre Tax Profit |
€29,866,051 |
-5.1% |
€31,463,364 |
41% |
€22,311,804 |
5.7% |
€21,114,608 |
-9.1% |
€23,228,090 |
|
|
Taxation |
-€3,700,323 |
1.3% |
-€3,749,105 |
-31.6% |
-€2,849,506 |
5.6% |
-€3,017,102 |
15.8% |
-€3,585,264 |
|
|
Profit After Tax |
€26,165,728 |
-5.6% |
€27,714,259 |
42.4% |
€19,462,298 |
7.5% |
€18,097,505 |
-7.9% |
€19,642,826 |
|
|
Dividends Payable |
€22,658,439 |
-71.4% |
€79,304,537 |
- |
- |
- |
- |
- |
- |
|
|
Retained Profit |
€3,507,288 |
106.8% |
-€51,590,278 |
-365.1% |
€19,462,298 |
7.5% |
€18,097,505 |
-7.9% |
€19,642,826 |
Balance Sheet
|
|
Date Of Accounts |
31/03/12 |
(%) |
31/03/11 |
(%) |
31/03/10 |
(%) |
31/03/09 |
(%) |
31/03/08 |
|
|
Tangible Assets |
€10,772,894 |
0.2% |
€10,751,315 |
-2.2% |
€10,990,411 |
3.8% |
€10,584,318 |
6.7% |
€9,922,879 |
|
|
Intangible Assets |
€385,882 |
-49.4% |
€762,756 |
-34.8% |
€1,168,997 |
-21.9% |
€1,496,760 |
-14.3% |
€1,747,249 |
|
|
Total Fixed Assets |
€11,158,776 |
-3.1% |
€11,514,070 |
-5.3% |
€12,159,408 |
0.6% |
€12,081,078 |
3.5% |
€11,670,128 |
|
|
Stock |
€87,347 |
-11.2% |
€98,325 |
-30.2% |
€140,882 |
-36.2% |
€220,877 |
-9.5% |
€244,020 |
|
|
Trade Debtors |
€85,135,994 |
-2.1% |
€87,003,548 |
29.1% |
€67,368,831 |
58.5% |
€42,511,573 |
-33.3% |
€63,766,607 |
|
|
Cash |
€85,815,049 |
-1.3% |
€86,981,516 |
-43.3% |
€153,471,918 |
62.8% |
€94,274,101 |
75.8% |
€53,617,881 |
|
|
Other Debtors |
€8,207,004 |
4.1% |
€7,882,678 |
-21% |
€9,981,902 |
-9.2% |
€10,994,248 |
16.5% |
€9,434,830 |
|
|
Miscellaneous Current
Assets |
€557,737 |
112.8% |
€262,106 |
-43.1% |
€460,530 |
100.6% |
€229,585 |
-25.9% |
€309,846 |
|
|
Total Current Assets |
€179,803,131 |
-1.3% |
€182,228,173 |
-21.3% |
€231,424,064 |
56.1% |
€148,230,384 |
16.4% |
€127,373,183 |
|
|
Trade Creditors |
€32,976 |
-90.7% |
€355,574 |
236.5% |
€105,664 |
7% |
€98,712 |
-71.9% |
€350,979 |
|
|
Bank Loans &
Overdrafts |
0 |
- |
0 |
- |
0 |
- |
0 |
- |
0 |
|
|
Other Short Term Finance |
€83,031,800 |
-1.5% |
€84,288,448 |
-6.5% |
€90,189,648 |
160.6% |
€34,613,052 |
1.7% |
€34,046,880 |
|
|
Miscellaneous Current Liabilities |
€33,830,010 |
-12.2% |
€38,515,351 |
37.8% |
€27,946,907 |
17.8% |
€23,731,992 |
-9.9% |
€26,336,145 |
|
|
Total Current
Liabilities |
€116,894,786 |
-5.1% |
€123,159,373 |
4.2% |
€118,242,218 |
102.3% |
€58,443,756 |
-3.8% |
€60,734,003 |
|
|
Bank Loans &
Overdrafts and LTL |
0 |
- |
0 |
- |
0 |
- |
0 |
- |
0 |
|
|
Other Long Term Finance |
0 |
- |
0 |
- |
0 |
- |
0 |
- |
0 |
|
|
Total Long Term
Liabilities |
0 |
- |
0 |
- |
0 |
- |
0 |
- |
0 |
.
Capital & Reserves
|
|
Date Of Accounts |
31/03/12 |
(%) |
31/03/11 |
(%) |
31/03/10 |
(%) |
31/03/09 |
(%) |
31/03/08 |
|
|
Called Up Share Capital |
€1 |
- |
€1 |
-2.6% |
€1 |
4.1% |
€1 |
7.2% |
€1 |
|
|
P & L Account
Reserve |
€63,375,558 |
5.8% |
€59,891,307 |
-47.6% |
€114,374,166 |
25.3% |
€91,315,331 |
33.4% |
€68,442,896 |
|
|
Revaluation Reserve |
- |
- |
- |
- |
- |
- |
- |
- |
- |
|
|
Sundry Reserves |
€10,691,562 |
- |
€10,691,562 |
-2.5% |
€10,967,087 |
3.9% |
€10,552,374 |
7% |
€9,866,411 |
|
|
Shareholder Funds |
€74,067,121 |
4.9% |
€70,582,870 |
-43.7% |
€125,341,254 |
23% |
€101,867,706 |
30.1% |
€78,309,308 |
Other Financial Items
|
|
Date Of Accounts |
31/03/12 |
(%) |
31/03/11 |
(%) |
31/03/10 |
(%) |
31/03/09 |
(%) |
31/03/08 |
|
|
Net Worth |
€73,681,239 |
5.5% |
€69,820,115 |
-43.8% |
€124,172,257 |
23.7% |
€100,370,946 |
31.1% |
€76,562,059 |
|
|
Working Capital |
€62,908,345 |
6.5% |
€59,068,800 |
-47.8% |
€113,181,846 |
26.1% |
€89,786,628 |
34.7% |
€66,639,180 |
|
|
Total Assets |
€190,961,907 |
-1.4% |
€193,742,243 |
-20.5% |
€243,583,472 |
51.9% |
€160,311,462 |
15.3% |
€139,043,311 |
|
|
Total Liabilities |
€116,894,786 |
-5.1% |
€123,159,373 |
4.2% |
€118,242,218 |
102.3% |
€58,443,756 |
-3.8% |
€60,734,003 |
|
|
Net Assets |
€74,067,121 |
4.9% |
€70,582,870 |
-43.7% |
€125,341,254 |
23% |
€101,867,706 |
30.1% |
€78,309,308 |
Cash Flow
|
|
Date Of Accounts |
31/03/12 |
(%) |
31/03/11 |
(%) |
31/03/10 |
(%) |
31/03/09 |
(%) |
31/03/08 |
|
|
Net Cashflow
from Operations |
- |
- |
- |
- |
- |
- |
- |
- |
- |
|
|
Net Cashflow
before Financing |
- |
- |
- |
- |
- |
- |
- |
- |
- |
|
|
Net Cashflow
from Financing |
- |
- |
- |
- |
- |
- |
- |
- |
- |
|
|
Increase in Cash |
- |
- |
- |
- |
- |
- |
- |
- |
- |
Miscellaneous
|
|
Date Of Accounts |
31/03/12 |
(%) |
31/03/11 |
(%) |
31/03/10 |
(%) |
31/03/09 |
(%) |
31/03/08 |
|
|
Contingent Liability |
NO |
- |
NO |
- |
NO |
- |
NO |
- |
NO |
|
|
Capital Employed |
€74,067,121 |
4.9% |
€70,582,870 |
-43.7% |
€125,341,254 |
23% |
€101,867,706 |
30.1% |
€78,309,308 |
|
|
Number of Employees |
14 |
- |
14 |
7.7% |
13 |
-7.1% |
14 |
- |
14 |
|
|
Auditors |
ERNST & YOUNG |
||||||||
|
|
Auditor Comments |
The audit report contains
no adverse comments |
||||||||
|
|
Bankers |
J P MORGAN |
||||||||
|
|
Bank Branch Code |
60-95-76 |
||||||||
Ratios
|
|
Date Of Accounts |
31/03/12 |
31/03/11 |
31/03/10 |
31/03/09 |
31/03/08 |
|
|
Pre-tax profit margin % |
4.29 |
4.36 |
4.41 |
4.67 |
4.76 |
|
|
Current ratio |
1.54 |
1.48 |
1.96 |
2.54 |
2.10 |
|
|
Sales/Net Working
Capital |
11.07 |
12.22 |
4.47 |
5.04 |
7.32 |
|
|
Gearing % |
0 |
0 |
0 |
0 |
0 |
|
|
Equity in % |
38.90 |
36.60 |
51.70 |
64.10 |
57 |
|
|
Creditor Days |
0.01 |
0.17 |
0.07 |
0.07 |
0.26 |
|
|
Debtor Days |
44.49 |
43.85 |
48.51 |
34.21 |
47.58 |
|
|
Liquidity/Acid Test |
1.53 |
1.47 |
1.95 |
2.53 |
2.09 |
|
|
Return On Capital
Employed % |
40.32 |
44.57 |
17.80 |
20.72 |
29.66 |
|
|
Return On Total Assets
Employed % |
15.63 |
16.23 |
9.15 |
13.17 |
16.70 |
|
|
Current Debt Ratio |
1.57 |
1.74 |
0.94 |
0.57 |
0.77 |
|
|
Total Debt Ratio |
1.57 |
1.74 |
0.94 |
0.57 |
0.77 |
|
|
Stock Turnover Ratio % |
0.01 |
0.01 |
0.02 |
0.04 |
0.05 |
|
|
Return on Net Assets
Employed % |
40.32 |
44.57 |
17.80 |
20.72 |
29.66 |
FOREIGN EXCHANGE RATES
NA
ADDITIONAL INFORMATION
Enquiries Trend
|
There have been 15 enquiries in the last 12
months. |
|
There are an average
of 1 reports taken each month. |
|
|
3 MONTHS |
6 MONTHS |
9 MONTHS |
|
Enquiries |
4 |
8 |
13 |
Status History
|
No Status History found |
Event History
|
Date |
Description |
|
31/01/2014 |
Annual Returns |
|
02/12/2013 |
New Board Member (JAMES ERIC BJORNHOLT)
appointed |
|
28/11/2013 |
BJORNHOLT JAMES ERIC has left the board |
|
29/01/2013 |
Annual Returns |
|
29/01/2013 |
New Accounts Filed |
|
29/01/2013 |
New Accounts Filed |
|
26/01/2012 |
Annual Returns |
|
26/01/2012 |
New Accounts Filed |
|
26/01/2012 |
New Accounts Filed |
|
21/09/2011 |
GARY PAUL MARSH has left the board |
|
21/09/2011 |
New Board Member (SANDRA MARIE GRAHAM)
appointed |
|
21/01/2011 |
Annual Returns |
|
21/01/2011 |
New Accounts Filed |
|
21/01/2011 |
New Accounts Filed |
|
21/01/2010 |
Annual Returns |
Previous Company Names
|
No Previous Names found |
NOTES & COMMENTS
Commentary
No comments to
display
FOREIGN EXCHANGE RATES
|
Currency |
Unit
|
Indian Rupees |
|
US Dollar |
1 |
Rs.60.81 |
|
|
1 |
Rs.100.06 |
|
Euro |
1 |
Rs.78.47 |
INFORMATION DETAILS
|
Analysis Done by
: |
RAS |
|
|
|
|
Report Prepared
by : |
NIT |
RATING EXPLANATIONS
|
RATING |
STATUS |
PROPOSED CREDIT LINE |
|
|
|
>86 |
Aaa |
Possesses an extremely sound financial base with the strongest
capability for timely payment of interest and principal sums |
Unlimited |
|
|
71-85 |
Aa |
Possesses adequate working capital. No caution needed for credit
transaction. It has above average (strong) capability for payment of interest
and principal sums |
Large |
|
|
56-70 |
A |
Financial & operational base are regarded healthy. General unfavourable factors will not cause fatal effect.
Satisfactory capability for payment of interest and principal sums |
Fairly Large |
|
|
41-55 |
Ba |
Overall operation is considered normal. Capable to meet normal
commitments. |
Satisfactory |
|
|
26-40 |
B |
Capability to overcome financial difficulties seems comparatively
below average. |
Small |
|
|
11-25 |
Ca |
Adverse factors are apparent. Repayment of interest and principal sums
in default or expected to be in default upon maturity |
Limited with
full security |
|
|
<10 |
C |
Absolute credit risk exists. Caution needed to be exercised |
Credit not
recommended |
|
|
-- |
NB |
New Business |
-- |
|
This score serves as a reference to assess SC’s credit risk
and to set the amount of credit to be extended. It is calculated from a
composite of weighted scores obtained from each of the major sections of this
report. The assessed factors and their relative weights (as indicated through
%) are as follows:
Financial
condition (40%) Ownership
background (20%) Payment
record (10%)
Credit history
(10%) Market trend
(10%) Operational
size (10%)
This report is issued at your request without any
risk and responsibility on the part of MIRA INFORM PRIVATE LIMITED (MIPL)
or its officials.