MIRA
INFORM REPORT
|
Report Date : |
23.09.2014 |
IDENTIFICATION DETAILS
|
Name : |
NIGLON LIMITED |
|
|
|
|
Registered Office : |
|
|
|
|
|
Country : |
|
|
|
|
|
Financials (as on) : |
30.04.2013 |
|
|
|
|
Date of Incorporation : |
11.11.1966 |
|
|
|
|
Com. Reg. No.: |
00891753 |
|
|
|
|
Legal Form : |
Private Limited with Share Capital |
|
|
|
|
Line of Business : |
Wholesale of Electronic and Telecommunications Equipment and Parts |
|
|
|
|
No. of Employees : |
37 |
RATING & COMMENTS
|
MIRA’s Rating : |
Ba |
|
RATING |
STATUS |
PROPOSED CREDIT LINE |
|
|
41-55 |
Ba |
Overall operation is considered normal. Capable to meet normal
commitments. |
Satisfactory |
|
Status : |
Satisfactory |
|
Payment Behaviour : |
No complaints |
|
Litigation : |
Clear |
NOTES :
Any query related to this report can be made
on e-mail : infodept@mirainform.com
while quoting report number, name and date.
ECGC Country Risk Classification List – June 1, 2014
|
Country Name |
Previous Rating (31.03.2014) |
Current Rating (01.06.2014) |
|
|
A1 |
A1 |
|
Risk Category |
ECGC
Classification |
|
Insignificant |
A1 |
|
Low |
A2 |
|
Moderate |
B1 |
|
High |
B2 |
|
Very High |
C1 |
|
Restricted |
C2 |
|
Off-credit |
D |
The
|
Source
: CIA |
REGISTERED NAME & COMPANY
SUMMARY
Company Name: NIGLON LIMITED
Company No.: 00891753
Company Status: Active – Accounts Filed

DIRECTORS/MANAGEMENT
Current Directors
|
Name |
John Grahame Hinley |
Date of Birth |
13/04/1930 |
|
Officers Title |
Mr |
Nationality |
British |
|
Present Appointments |
8 |
Function |
Director |
|
Appointment Date |
31/12/1991 |
|
|
|
Address |
Tile Cross House 51 Browns Lane, Knowle, Solihull, |
||
|
Other Actions |
View Director Report |
View Consumer Report |
View AML Report |
|
|
View Trace Report |
|
|
|
Name |
Simon Brett Hinley |
Date of Birth |
14/04/1958 |
|
Officers Title |
Mr |
Nationality |
British |
|
Present Appointments |
10 |
Function |
Director |
|
Appointment Date |
31/12/1991 |
|
|
|
Address |
The Rickyard, Barston Lane Barston, Solihull, |
||
|
Other Actions |
View Director Report |
View Consumer Report |
View AML Report |
|
|
View Trace Report |
|
|
|
Name |
Janet Elizabeth Hinley |
Date of Birth |
09/12/1934 |
|
Officers Title |
Mrs |
Nationality |
British |
|
Present Appointments |
4 |
Function |
Director |
|
Appointment Date |
31/12/1991 |
|
|
|
Address |
Tile Cross House 51 Browns Lane, Knowle, Solihull, |
||
|
Other Actions |
View Director Report |
View Consumer Report |
View AML Report |
|
|
View Trace Report |
|
|
|
Name |
Jeremy Wilson |
Date of Birth |
25/05/1955 |
|
Officers Title |
Mr |
Nationality |
British |
|
Present Appointments |
1 |
Function |
Director |
|
Appointment Date |
31/12/1991 |
|
|
|
Address |
|
||
|
Other Actions |
View Director Report |
View Consumer Report |
View AML Report |
|
|
View Trace Report |
|
|
|
Name |
Oliver Hinley |
Date of Birth |
26/05/1991 |
|
Officers Title |
Mr |
Nationality |
British |
|
Present Appointments |
1 |
Function |
Director |
|
Appointment Date |
14/02/2012 |
|
|
|
Address |
|
||
Previous
Director/Company Secretaries
|
No Previous Director Details |
NEGATIVE INFORMATION
CCJ
|
Total Number of Exact CCJs - |
0 |
Total Value of Exact CCJs - |
|
|
Total Number of Possible CCJs - |
0 |
Total Value of Possible CCJs - |
|
|
Total Number of Satisfied CCJs - |
0 |
Total Value of Satisfied CCJs - |
|
|
Total Number of Writs - |
- |
|
|
Exact CCJ Details
|
No CCJs found |
Possible CCJs
Details
|
There are no possible CCJ details |
Writ Details
|
No writs found |
SHARE & SHARE CAPITAL
INFORMATION
Top 20 Shareholders
|
Name |
Currency |
Share Count |
Share Type |
Nominal Value |
% of Total Share
Count |
|
J.G. HINLEY |
GBP |
59,000 |
ORDINARY |
1 |
59 |
|
S.B. HINLEY |
GBP |
21,600 |
ORDINARY |
1 |
21.6 |
|
J.E. HINLEY |
GBP |
18,400 |
ORDINARY |
1 |
18.4 |
|
MR J. WILSON |
GBP |
1,000 |
ORDINARY |
1 |
1 |
GROUP STRUCTURE & AFFILIATED
COMPANIES
Statistics
|
Group |
3 companies |
|
Linkages |
0 companies |
|
Countries |
In 0 countries |
Summary
|
Holding Company |
NIGLON LIMITED |
|
Ownership Status |
Ultimately Owned |
|
Ultimate Holding Company |
NIGLON LIMITED |
Group structure
|
Company Name |
|
Registered
Number |
Latest Key
Financials |
Consol. Accounts |
Turnover |
|
|
|
00891753 |
30.04.2013 |
Y |
|
|
|
|
08460957 |
- |
N |
|
|
|
|
00485618 |
30.04.2013 |
N |
|
FINANCIAL INFORMATION
Profit & Loss
|
Date Of Accounts |
30/04/13 |
(%) |
30/04/12 |
(%) |
30/04/11 |
(%) |
30/04/10 |
(%) |
30/04/09 |
|
Weeks |
52 |
(%) |
52 |
(%) |
52 |
(%) |
52 |
(%) |
52 |
|
Currency |
GBP |
(%) |
GBP |
(%) |
GBP |
(%) |
GBP |
(%) |
GBP |
|
Consolidated A/cs |
Y |
(%) |
Y |
(%) |
Y |
(%) |
Y |
(%) |
Y |
|
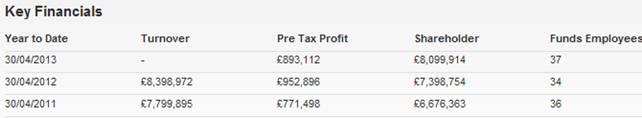
Turnover |
- |
- |
£8,398,972 |
7.7% |
£7,799,895 |
0.9% |
£7,728,186 |
0% |
£7,728,370 |
|
Export |
- |
- |
- |
- |
- |
- |
- |
- |
- |
|
Cost of Sales |
- |
-100% |
£5,626,083 |
6.8% |
£5,269,690 |
2.4% |
£5,144,183 |
-1.2% |
£5,204,471 |
|
Gross Profit |
£3,098,844 |
11.8% |
£2,772,889 |
9.6% |
£2,530,205 |
-2.1% |
£2,584,003 |
2.4% |
£2,523,899 |
|
Wages & Salaries |
£1,619,847 |
19.4% |
£1,356,217 |
5% |
£1,291,067 |
-3.9% |
£1,343,637 |
1.6% |
£1,322,872 |
|
Directors Emoluments |
£1,008,738 |
29.1% |
£781,325 |
-2.2% |
£798,816 |
-6% |
£849,635 |
4% |
£816,952 |
|
Operating Profit |
£880,250 |
-6.3% |
£939,726 |
24.1% |
£757,379 |
-3.9% |
£788,247 |
37.1% |
£574,937 |
|
Depreciation |
£62,548 |
18.7% |
£52,709 |
4.4% |
£50,464 |
-17.3% |
£60,995 |
-1.6% |
£61,986 |
|
Audit Fees |
£12,500 |
-16.7% |
£15,000 |
20% |
£12,500 |
-2.2% |
£12,780 |
-6.4% |
£13,650 |
|
Interest Payments |
- |
-100% |
£1,029 |
- |
- |
-100% |
£854 |
-72.5% |
£3,102 |
|
Pre Tax Profit |
£893,112 |
-6.3% |
£952,896 |
23.5% |
£771,498 |
-2.9% |
£794,736 |
21.7% |
£653,242 |
|
Taxation |
-£216,952 |
15.1% |
-£255,505 |
-11.5% |
-£229,199 |
-11.8% |
-£205,018 |
-16.7% |
-£175,681 |
|
Profit After Tax |
£676,160 |
-3% |
£697,391 |
28.6% |
£542,299 |
-8% |
£589,718 |
23.5% |
£477,561 |
|
Dividends Payable |
- |
- |
- |
- |
- |
- |
- |
- |
- |
|
Retained Profit |
£676,160 |
-3% |
£697,391 |
28.6% |
£542,299 |
-8% |
£589,718 |
23.5% |
£477,561 |
Balance Sheet
|
Date Of Accounts |
30/04/13 |
(%) |
30/04/12 |
(%) |
30/04/11 |
(%) |
30/04/10 |
(%) |
30/04/09 |
|
Tangible Assets |
£1,612,438 |
2.6% |
£1,571,741 |
1% |
£1,555,901 |
-0.9% |
£1,569,905 |
-12.4% |
£1,792,334 |
|
Intangible Assets |
0 |
- |
0 |
- |
0 |
- |
0 |
- |
0 |
|
Total Fixed Assets |
£1,612,438 |
2.6% |
£1,571,741 |
1% |
£1,555,901 |
-0.9% |
£1,569,905 |
-12.4% |
£1,792,334 |
|
Stock |
£1,499,629 |
6.2% |
£1,411,579 |
46.4% |
£964,378 |
-6% |
£1,026,038 |
2.1% |
£1,004,590 |
|
Trade Debtors |
£2,677,543 |
13.9% |
£2,350,790 |
26.3% |
£1,861,743 |
4.5% |
£1,781,912 |
1.1% |
£1,762,126 |
|
Cash |
£4,618,930 |
20.2% |
£3,841,595 |
-4.6% |
£4,027,919 |
13.5% |
£3,549,410 |
1.1% |
£3,511,277 |
|
Other Debtors |
£142,238 |
18.3% |
£120,204 |
-51.6% |
£248,548 |
126.5% |
£109,756 |
-5.1% |
£115,603 |
|
Miscellaneous Current Assets |
0 |
- |
0 |
- |
0 |
- |
0 |
- |
0 |
|
Total Current Assets |
£8,938,340 |
15.7% |
£7,724,168 |
8.8% |
£7,102,588 |
9.8% |
£6,467,116 |
1.1% |
£6,393,596 |
|
Trade Creditors |
£988,689 |
20.2% |
£822,230 |
24% |
£663,216 |
45.9% |
£454,461 |
-21.4% |
£577,845 |
|
Bank Loans & Overdrafts |
0 |
- |
0 |
-100% |
£93,170 |
-10% |
£103,515 |
167.6% |
£38,678 |
|
Other Short Term Finance |
£142,809 |
239.9% |
£42,020 |
-52.6% |
£88,653 |
-70.4% |
£299,649 |
-24.8% |
£398,622 |
|
Miscellaneous Current Liabilities |
£1,319,366 |
27.7% |
£1,032,905 |
-9.2% |
£1,137,087 |
6.2% |
£1,070,332 |
-26.3% |
£1,451,439 |
|
Total Current Liabilities |
£2,450,864 |
29.2% |
£1,897,155 |
-4.3% |
£1,982,126 |
2.8% |
£1,927,957 |
-21.8% |
£2,466,584 |
|
Bank Loans & Overdrafts and LTL |
0 |
- |
0 |
-100% |
£93,170 |
-10% |
£103,515 |
167.6% |
£38,678 |
|
Other Long Term Finance |
0 |
- |
0 |
- |
0 |
- |
0 |
- |
0 |
|
Total Long Term Liabilities |
0 |
- |
0 |
- |
0 |
- |
0 |
- |
0 |
Capital &
Reserves
|
Date Of Accounts |
30/04/13 |
(%) |
30/04/12 |
(%) |
30/04/11 |
(%) |
30/04/10 |
(%) |
30/04/09 |
|
Called Up Share Capital |
£100,000 |
- |
£100,000 |
- |
£100,000 |
- |
£100,000 |
- |
£100,000 |
|
P & L Account Reserve |
£6,940,555 |
10.8% |
£6,264,395 |
12.5% |
£5,567,004 |
10.8% |
£5,024,705 |
13.3% |
£4,434,987 |
|
Revaluation Reserve |
£1,059,359 |
2.4% |
£1,034,359 |
2.5% |
£1,009,359 |
2.5% |
£984,359 |
-16.9% |
£1,184,359 |
|
Sundry Reserves |
- |
- |
- |
- |
- |
- |
- |
- |
- |
|
Shareholder Funds |
£8,099,914 |
9.5% |
£7,398,754 |
10.8% |
£6,676,363 |
9.3% |
£6,109,064 |
6.8% |
£5,719,346 |
Other Financial
Items
|
Date Of Accounts |
30/04/13 |
(%) |
30/04/12 |
(%) |
30/04/11 |
(%) |
30/04/10 |
(%) |
30/04/09 |
|
Net Worth |
£8,099,914 |
9.5% |
£7,398,754 |
10.8% |
£6,676,363 |
9.3% |
£6,109,064 |
6.8% |
£5,719,346 |
|
Working Capital |
£6,487,476 |
11.3% |
£5,827,013 |
13.8% |
£5,120,462 |
12.8% |
£4,539,159 |
15.6% |
£3,927,012 |
|
Total Assets |
£10,550,778 |
13.5% |
£9,295,909 |
7.4% |
£8,658,489 |
7.7% |
£8,037,021 |
-1.8% |
£8,185,930 |
|
Total Liabilities |
£2,450,864 |
29.2% |
£1,897,155 |
-4.3% |
£1,982,126 |
2.8% |
£1,927,957 |
-21.8% |
£2,466,584 |
|
Net Assets |
£8,099,914 |
9.5% |
£7,398,754 |
10.8% |
£6,676,363 |
9.3% |
£6,109,064 |
6.8% |
£5,719,346 |
Cash Flow
|
Date Of Accounts |
30/04/13 |
(%) |
30/04/12 |
(%) |
30/04/11 |
(%) |
30/04/10 |
(%) |
30/04/09 |
|
Net Cashflow from Operations |
£1,049,655 |
326.6% |
£246,067 |
-74.5% |
£963,389 |
268.6% |
£261,344 |
-68% |
£817,308 |
|
Net Cashflow before Financing |
£698,580 |
999.9% |
£26,383 |
-96.5% |
£746,350 |
493.9% |
£125,677 |
-80.7% |
£650,936 |
|
Net Cashflow from Financing |
£78,755 |
165.9% |
-£119,537 |
53.6% |
-£257,496 |
-160.2% |
-£98,973 |
-139.2% |
£252,498 |
|
Increase in Cash |
£777,335 |
934.5% |
-£93,154 |
-119.1% |
£488,854 |
999.9% |
£26,704 |
-97% |
£903,434 |
Miscellaneous
|
Date Of Accounts |
30/04/13 |
(%) |
30/04/12 |
(%) |
30/04/11 |
(%) |
30/04/10 |
(%) |
30/04/09 |
|
Contingent Liability |
NO |
- |
NO |
- |
NO |
- |
NO |
- |
NO |
|
Capital Employed |
£8,099,914 |
9.5% |
£7,398,754 |
10.8% |
£6,676,363 |
9.3% |
£6,109,064 |
6.8% |
£5,719,346 |
|
Number of Employees |
37 |
8.8% |
34 |
-5.6% |
36 |
20% |
30 |
3.4% |
29 |
|
Auditors |
W H PARKER |
||||||||
|
Auditor Comments |
The audit report contains no adverse comments |
||||||||
|
Bankers |
|
||||||||
|
Bank Branch Code |
|
||||||||
Ratios
|
Date Of Accounts |
30/04/13 |
30/04/12 |
30/04/11 |
30/04/10 |
30/04/09 |
|
Pre-tax profit margin % |
- |
11.35 |
9.89 |
10.28 |
8.45 |
|
Current ratio |
3.65 |
4.07 |
3.58 |
3.35 |
2.59 |
|
Sales/Net Working Capital |
- |
1.44 |
1.52 |
1.70 |
1.97 |
|
Gearing % |
0 |
0 |
1.40 |
1.70 |
0.70 |
|
Equity in % |
76.80 |
79.60 |
77.10 |
76 |
69.90 |
|
Creditor Days |
- |
35.63 |
30.95 |
21.40 |
27.21 |
|
Debtor Days |
- |
101.88 |
86.88 |
83.92 |
82.99 |
|
Liquidity/Acid Test |
3.03 |
3.32 |
3.09 |
2.82 |
2.18 |
|
Return On Capital Employed % |
11.02 |
12.87 |
11.55 |
13 |
11.42 |
|
Return On Total Assets Employed % |
8.46 |
10.25 |
8.91 |
9.88 |
7.98 |
|
Current Debt Ratio |
0.30 |
0.25 |
0.29 |
0.31 |
0.43 |
|
Total Debt Ratio |
0.30 |
0.25 |
0.29 |
0.31 |
0.43 |
|
Stock Turnover Ratio % |
- |
16.80 |
12.36 |
13.27 |
12.99 |
|
Return on Net Assets Employed % |
11.02 |
12.87 |
11.55 |
13 |
11.42 |
Creditor Details
|
|
Total Number |
Total Value |
|
Trade Creditors |
0 |
- |
|
No Creditor Data |
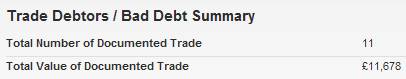
Trade Debtors /
Bad Debt Detail
|
|
Total Number of Documented Trade |
Total Value of Documented Trade |
|
Trade Debtors |
11 |
£11,678 |
|
Company Name |
Amount |
Statement Date |
|
Stephenson Cook Freer Limited |
£3,161 |
25/11/2009 |
|
Stephenson Cook Liddell Limited |
£2,256 |
25/11/2009 |
|
Valmo Electrical Supplies Limited |
£2,250 |
08/08/2011 |
|
Smith Fasteners Limited |
£1,477 |
05/08/2011 |
|
Stephenson Cook Sewell Limited |
£577 |
25/11/2009 |
|
Stephenson Cook Scott Limited |
£537 |
27/11/2009 |
|
Aintree Electrical Supplies Limited |
£493 |
09/11/2012 |
|
Online Electrical Wholesalers Ltd |
£280 |
16/08/2012 |
|
Stephenson Cook Carter Limited |
£273 |
25/11/2009 |
|
Teesside Electrical Supplies Limited |
£238 |
18/01/2010 |
|
Wholesale Electro ( |
£136 |
12/02/2013 |
FOREIGN EXCHANGE RATES
N/a
ADDITIONAL INFORMATION
Enquiries Trend
|
There have been 182 enquiries in the last 12 months. |
|
There are an average of 15 reports taken each month. |
Current Company
Secretary
|
Name |
Janet Elizabeth Hinley |
Date of Birth |
09/12/1934 |
|
Officers Title |
Mrs |
Nationality |
British |
|
Present Appointments |
4 |
Function |
Company Secretary |
|
Appointment Date |
31/12/1991 |
|
|
|
Address |
Tile Cross House 51 Browns Lane, Knowle, Solihull, |
||
Status History
|
No Status History found |
Event History
|
Date |
Description |
|
08/02/2014 |
New Accounts Filed |
|
08/02/2014 |
New Accounts Filed |
|
17/01/2014 |
Annual Returns |
|
08/02/2013 |
New Accounts Filed |
|
08/02/2013 |
New Accounts Filed |
|
21/01/2013 |
Annual Returns |
|
10/03/2012 |
New Accounts Filed |
|
10/03/2012 |
New Accounts Filed |
|
22/02/2012 |
New Board Member Mr O. Hinley appointed |
|
03/01/2012 |
Annual Returns |
|
04/02/2011 |
New Accounts Filed |
|
04/02/2011 |
New Accounts Filed |
|
15/01/2011 |
Annual Returns |
|
11/02/2010 |
New Accounts Filed |
|
11/02/2010 |
New Accounts Filed |
Previous Company
Names
|
No Previous Names found |
NOTES & COMMENTS
Commentary
|
No exact match CCJs are recorded against the company. |
|
The company's credit rating has increased from not rated to 78 which
indicates very good creditworthiness. |
|
Sales in the latest trading period increased 7.7% on the previous
trading period. |
|
Net Worth increased by 10.8% during the latest trading period. |
|
A 7.4% growth in Total Assets occurred during the latest trading
period. |
|
There has been no significant change in the company's credit limit. |
|
Pre-tax profits increased by 23.5% compared to the previous trading
period. |
|
The company saw a decrease in their Cash Balance of 4.6% during the
latest trading period. |
|
The audit report contains no adverse comments. |
|
No recent changes in directorship are recorded. |
|
The company is part of a group. |
|
The company was established over 47 years ago. |
FOREIGN EXCHANGE RATES
|
Currency |
Unit
|
Indian Rupees |
|
US Dollar |
1 |
Rs.60.79 |
|
|
1 |
Rs.99.30 |
|
Euro |
1 |
Rs.78.16 |
INFORMATION DETAILS
|
Analysis Done by
: |
SUB |
|
|
|
|
Report Prepared
by : |
SDA |
RATING EXPLANATIONS
|
RATING |
STATUS |
PROPOSED CREDIT LINE |
|
|
|
>86 |
Aaa |
Possesses an extremely sound financial base with the strongest
capability for timely payment of interest and principal sums |
Unlimited |
|
|
71-85 |
Aa |
Possesses adequate working capital. No caution needed for credit transaction.
It has above average (strong) capability for payment of interest and
principal sums |
Large |
|
|
56-70 |
A |
Financial & operational base are regarded healthy. General unfavourable
factors will not cause fatal effect. Satisfactory capability for payment of
interest and principal sums |
Fairly Large |
|
|
41-55 |
Ba |
Overall
operation is considered normal. Capable to meet normal commitments. |
Satisfactory |
|
|
26-40 |
B |
Capability to overcome financial difficulties seems comparatively
below average. |
Small |
|
|
11-25 |
Ca |
Adverse factors are apparent. Repayment of interest and principal sums
in default or expected to be in default upon maturity |
Limited with
full security |
|
|
<10 |
C |
Absolute credit risk exists. Caution needed to be exercised |
Credit not
recommended |
|
|
-- |
NB |
New Business |
-- |
|
This score serves as a reference to assess SC’s credit risk and
to set the amount of credit to be extended. It is calculated from a composite
of weighted scores obtained from each of the major sections of this report. The
assessed factors and their relative weights (as indicated through %) are as
follows:
Financial
condition (40%) Ownership
background (20%) Payment
record (10%)
Credit history
(10%) Market trend
(10%) Operational
size (10%)
This report is issued at your request without any
risk and responsibility on the part of MIRA INFORM PRIVATE LIMITED (MIPL)
or its officials.